
By InvestMacro
Here are the latest charts and statistics for the Commitment of Traders (COT) reports data published by the Commodities Futures Trading Commission (CFTC).
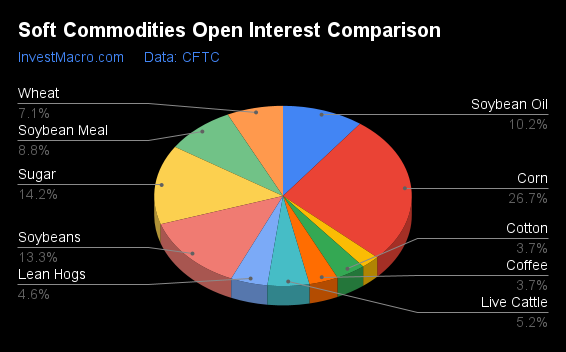
The latest COT data is updated through Tuesday June 25th and shows a quick view of how large traders (for-profit speculators and commercial entities) were positioned in the futures markets.
Weekly Speculator Changes led by Sugar, Cotton & Coffee
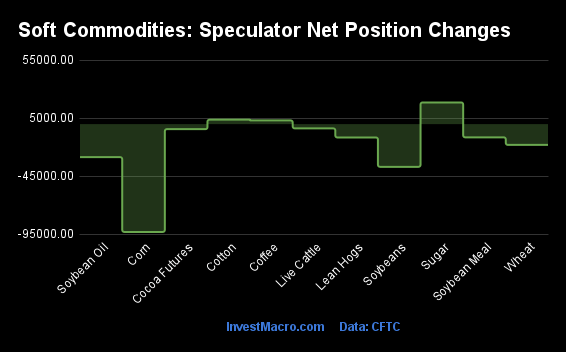
The COT soft commodities markets speculator bets were lower this week as just three out of the eleven softs markets we cover had higher positioning while the other eight markets had lower speculator contracts.
Free Reports:
 Get our Weekly Commitment of Traders Reports - See where the biggest traders (Hedge Funds and Commercial Hedgers) are positioned in the futures markets on a weekly basis.
 Sign Up for Our Stock Market Newsletter – Get updated on News, Charts & Rankings of Public Companies when you join our Stocks Newsletter
Leading the gains for the softs markets was Sugar (18,663 contracts) with Cotton (3,789 contracts) and Coffee (3,163 contracts) also having positive weeks.
The markets with the declines in speculator bets this week were Corn (-93,072 contracts), Soybeans (-36,877 contracts), Soybean Oil (-28,553 contracts), Wheat (-17,962 contracts), Lean Hogs (-11,565 contracts), Soybean Meal (-11,451 contracts), Cocoa (-4,384 contracts) and Live Cattle (-3,732 contracts) also registering lower bets on the week.
Soft Commodities Net Speculators Leaderboard
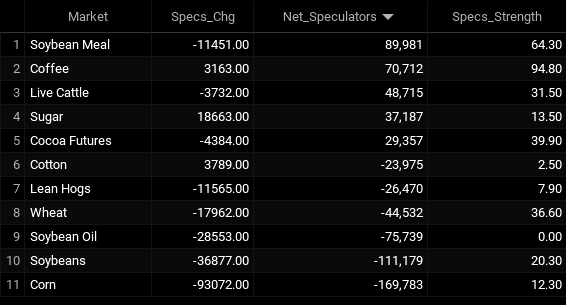
Legend: Weekly Speculators Change | Speculators Current Net Position | Speculators Strength Score compared to last 3-Years (0-100 range)
Strength Scores led by Coffee
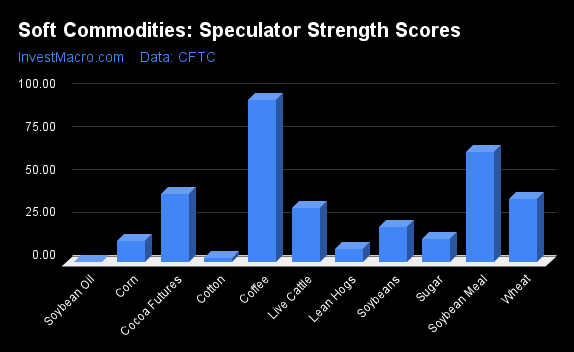
COT Strength Scores (a normalized measure of Speculator positions over a 3-Year range, from 0 to 100 where above 80 is Extreme-Bullish and below 20 is Extreme-Bearish) showed that Coffee (95 percent) leads the softs markets this week. Soybean Meal (64 percent) comes in as the next highest market.
On the downside, Soybean Oil (0 percent), Cotton (3 percent), Lean Hogs (8 percent), Corn (12 percent) and Sugar (14 percent) come in at the lowest strength levels currently and are in Extreme-Bearish territory (below 20 percent).
Strength Statistics:
Corn (12.3 percent) vs Corn previous week (24.1 percent)
Sugar (13.5 percent) vs Sugar previous week (7.4 percent)
Coffee (94.8 percent) vs Coffee previous week (91.7 percent)
Soybeans (20.3 percent) vs Soybeans previous week (29.0 percent)
Soybean Oil (0.0 percent) vs Soybean Oil previous week (15.6 percent)
Soybean Meal (64.3 percent) vs Soybean Meal previous week (69.0 percent)
Live Cattle (31.5 percent) vs Live Cattle previous week (35.5 percent)
Lean Hogs (7.9 percent) vs Lean Hogs previous week (17.4 percent)
Cotton (2.5 percent) vs Cotton previous week (0.0 percent)
Cocoa (39.9 percent) vs Cocoa previous week (44.4 percent)
Wheat (36.6 percent) vs Wheat previous week (49.1 percent)
Coffee & Sugar top the 6-Week Strength Trends
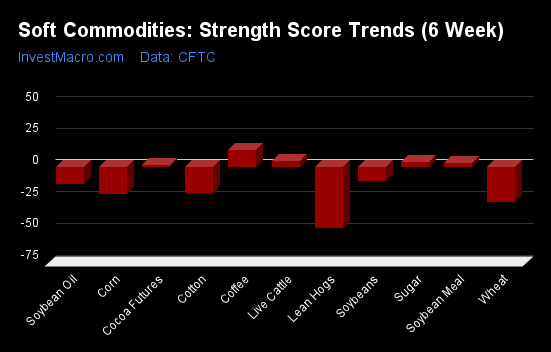
COT Strength Score Trends (or move index, calculates the 6-week changes in strength scores) showed that Coffee (13 percent) and Sugar (4 percent) lead the past six weeks trends for soft commodities. Live Cattle (4 percent), Soybean Meal (3 percent) and Cocoa (1 percent) are the next highest positive movers in the latest trends data.
Lean Hogs (-48 percent) leads the downside trend scores currently with Wheat (-27 percent), Corn (-22 percent) and Cotton (-20 percent) following next with lower trend scores.
Strength Trend Statistics:
Corn (-21.6 percent) vs Corn previous week (-5.8 percent)
Sugar (3.7 percent) vs Sugar previous week (-3.3 percent)
Coffee (13.1 percent) vs Coffee previous week (4.5 percent)
Soybeans (-10.7 percent) vs Soybeans previous week (-3.4 percent)
Soybean Oil (-13.8 percent) vs Soybean Oil previous week (2.4 percent)
Soybean Meal (3.0 percent) vs Soybean Meal previous week (11.3 percent)
Live Cattle (4.4 percent) vs Live Cattle previous week (9.7 percent)
Lean Hogs (-48.1 percent) vs Lean Hogs previous week (-43.8 percent)
Cotton (-20.4 percent) vs Cotton previous week (-24.1 percent)
Cocoa (1.4 percent) vs Cocoa previous week (7.3 percent)
Wheat (-27.2 percent) vs Wheat previous week (-6.1 percent)
Individual Soft Commodities Markets:
CORN Futures:
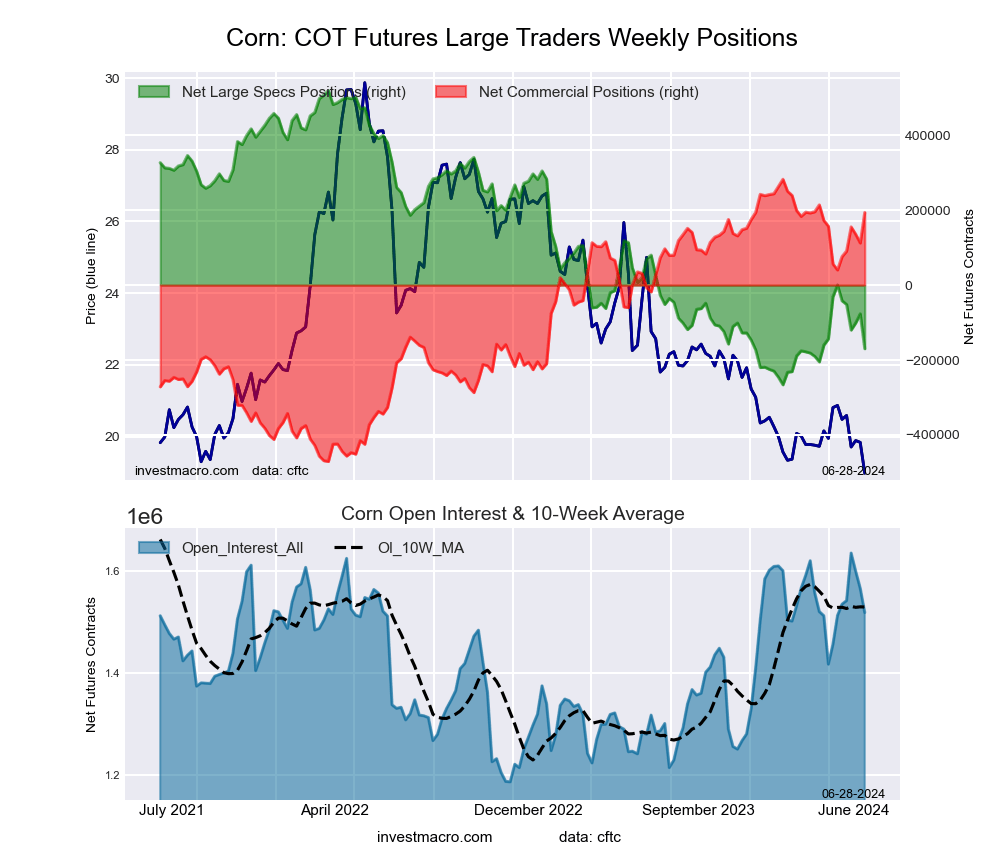 The CORN large speculator standing this week resulted in a net position of -169,783 contracts in the data reported through Tuesday. This was a weekly fall of -93,072 contracts from the previous week which had a total of -76,711 net contracts.
This week’s current strength score (the trader positioning range over the past three years, measured from 0 to 100) shows the speculators are currently Bearish-Extreme with a score of 12.3 percent. The commercials are Bullish-Extreme with a score of 88.2 percent and the small traders (not shown in chart) are Bullish with a score of 75.6 percent.
Price Trend-Following Model: Weak Uptrend
Our weekly trend-following model classifies the current market price position as: Weak Uptrend. The current action for the model is considered to be: Hold – Maintain Long Position.
| CORN Futures Statistics | SPECULATORS | COMMERCIALS | SMALL TRADERS |
| – Percent of Open Interest Longs: | 23.1 | 43.5 | 10.0 |
| – Percent of Open Interest Shorts: | 34.3 | 30.8 | 11.6 |
| – Net Position: | -169,783 | 193,911 | -24,128 |
| – Gross Longs: | 350,579 | 661,385 | 151,802 |
| – Gross Shorts: | 520,362 | 467,474 | 175,930 |
| – Long to Short Ratio: | 0.7 to 1 | 1.4 to 1 | 0.9 to 1 |
| NET POSITION TREND: | |||
| – Strength Index Score (3 Year Range Pct): | 12.3 | 88.2 | 75.6 |
| – Strength Index Reading (3 Year Range): | Bearish-Extreme | Bullish-Extreme | Bullish |
| NET POSITION MOVEMENT INDEX: | |||
| – 6-Week Change in Strength Index: | -21.6 | 20.4 | 21.9 |
SUGAR Futures:
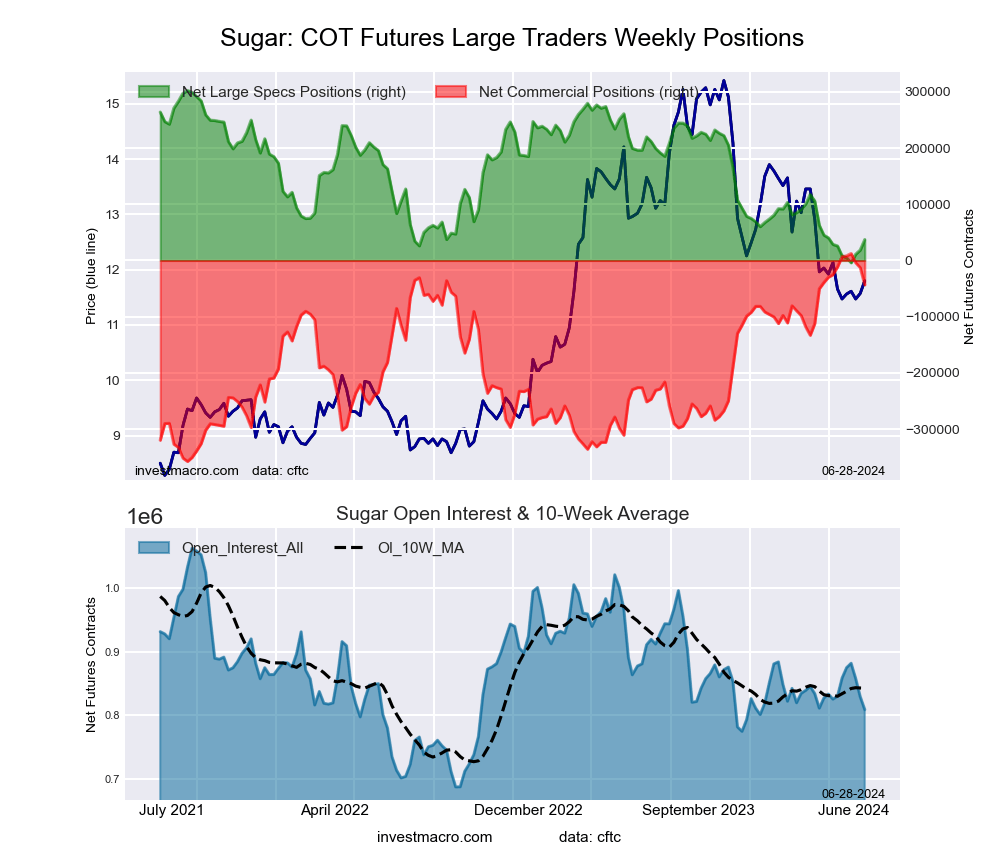 The SUGAR large speculator standing this week resulted in a net position of 37,187 contracts in the data reported through Tuesday. This was a weekly advance of 18,663 contracts from the previous week which had a total of 18,524 net contracts.
This week’s current strength score (the trader positioning range over the past three years, measured from 0 to 100) shows the speculators are currently Bearish-Extreme with a score of 13.5 percent. The commercials are Bullish-Extreme with a score of 85.0 percent and the small traders (not shown in chart) are Bearish with a score of 27.5 percent.
Price Trend-Following Model: Downtrend
Our weekly trend-following model classifies the current market price position as: Downtrend. The current action for the model is considered to be: Hold – Maintain Short Position.
| SUGAR Futures Statistics | SPECULATORS | COMMERCIALS | SMALL TRADERS |
| – Percent of Open Interest Longs: | 22.3 | 55.0 | 9.0 |
| – Percent of Open Interest Shorts: | 17.7 | 60.4 | 8.2 |
| – Net Position: | 37,187 | -43,286 | 6,099 |
| – Gross Longs: | 180,313 | 445,248 | 72,600 |
| – Gross Shorts: | 143,126 | 488,534 | 66,501 |
| – Long to Short Ratio: | 1.3 to 1 | 0.9 to 1 | 1.1 to 1 |
| NET POSITION TREND: | |||
| – Strength Index Score (3 Year Range Pct): | 13.5 | 85.0 | 27.5 |
| – Strength Index Reading (3 Year Range): | Bearish-Extreme | Bullish-Extreme | Bearish |
| NET POSITION MOVEMENT INDEX: | |||
| – 6-Week Change in Strength Index: | 3.7 | -8.6 | 26.7 |
COFFEE Futures:
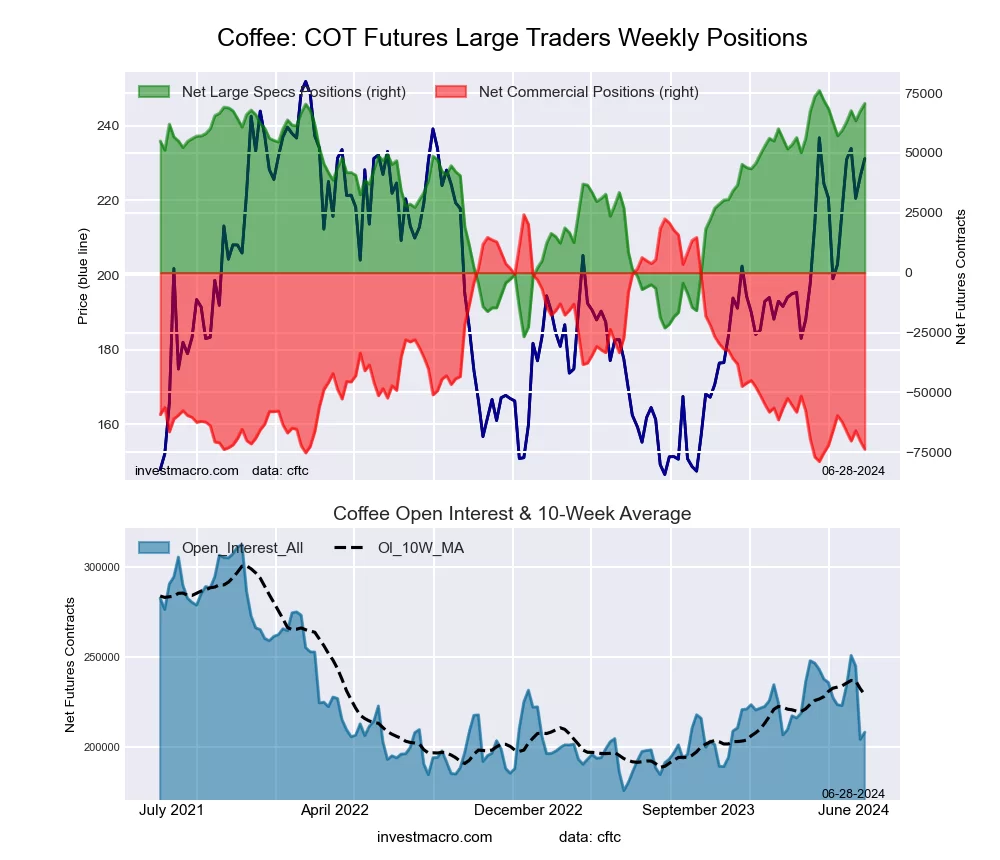 The COFFEE large speculator standing this week resulted in a net position of 70,712 contracts in the data reported through Tuesday. This was a weekly advance of 3,163 contracts from the previous week which had a total of 67,549 net contracts.
This week’s current strength score (the trader positioning range over the past three years, measured from 0 to 100) shows the speculators are currently Bullish-Extreme with a score of 94.8 percent. The commercials are Bearish-Extreme with a score of 5.0 percent and the small traders (not shown in chart) are Bullish with a score of 62.9 percent.
Price Trend-Following Model: Uptrend
Our weekly trend-following model classifies the current market price position as: Uptrend. The current action for the model is considered to be: Hold – Maintain Long Position.
| COFFEE Futures Statistics | SPECULATORS | COMMERCIALS | SMALL TRADERS |
| – Percent of Open Interest Longs: | 41.0 | 33.6 | 3.7 |
| – Percent of Open Interest Shorts: | 7.0 | 69.0 | 2.2 |
| – Net Position: | 70,712 | -73,719 | 3,007 |
| – Gross Longs: | 85,222 | 69,889 | 7,628 |
| – Gross Shorts: | 14,510 | 143,608 | 4,621 |
| – Long to Short Ratio: | 5.9 to 1 | 0.5 to 1 | 1.7 to 1 |
| NET POSITION TREND: | |||
| – Strength Index Score (3 Year Range Pct): | 94.8 | 5.0 | 62.9 |
| – Strength Index Reading (3 Year Range): | Bullish-Extreme | Bearish-Extreme | Bullish |
| NET POSITION MOVEMENT INDEX: | |||
| – 6-Week Change in Strength Index: | 13.1 | -13.6 | 8.1 |
SOYBEANS Futures:
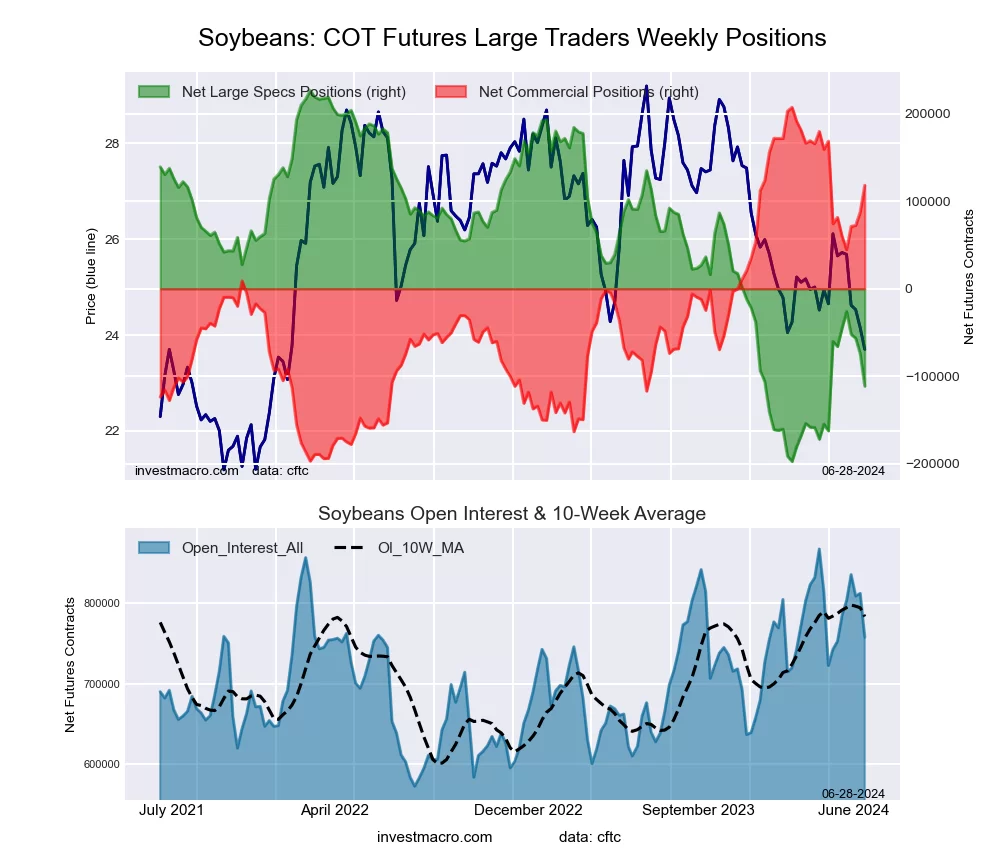 The SOYBEANS large speculator standing this week resulted in a net position of -111,179 contracts in the data reported through Tuesday. This was a weekly decrease of -36,877 contracts from the previous week which had a total of -74,302 net contracts.
This week’s current strength score (the trader positioning range over the past three years, measured from 0 to 100) shows the speculators are currently Bearish with a score of 20.3 percent. The commercials are Bullish with a score of 78.0 percent and the small traders (not shown in chart) are Bullish-Extreme with a score of 94.0 percent.
Price Trend-Following Model: Strong Downtrend
Our weekly trend-following model classifies the current market price position as: Strong Downtrend. The current action for the model is considered to be: New Sell – Short Position.
| SOYBEANS Futures Statistics | SPECULATORS | COMMERCIALS | SMALL TRADERS |
| – Percent of Open Interest Longs: | 17.4 | 57.8 | 7.0 |
| – Percent of Open Interest Shorts: | 32.1 | 42.2 | 7.9 |
| – Net Position: | -111,179 | 118,244 | -7,065 |
| – Gross Longs: | 132,269 | 438,467 | 52,892 |
| – Gross Shorts: | 243,448 | 320,223 | 59,957 |
| – Long to Short Ratio: | 0.5 to 1 | 1.4 to 1 | 0.9 to 1 |
| NET POSITION TREND: | |||
| – Strength Index Score (3 Year Range Pct): | 20.3 | 78.0 | 94.0 |
| – Strength Index Reading (3 Year Range): | Bearish | Bullish | Bullish-Extreme |
| NET POSITION MOVEMENT INDEX: | |||
| – 6-Week Change in Strength Index: | -10.7 | 9.1 | 22.3 |
SOYBEAN OIL Futures:
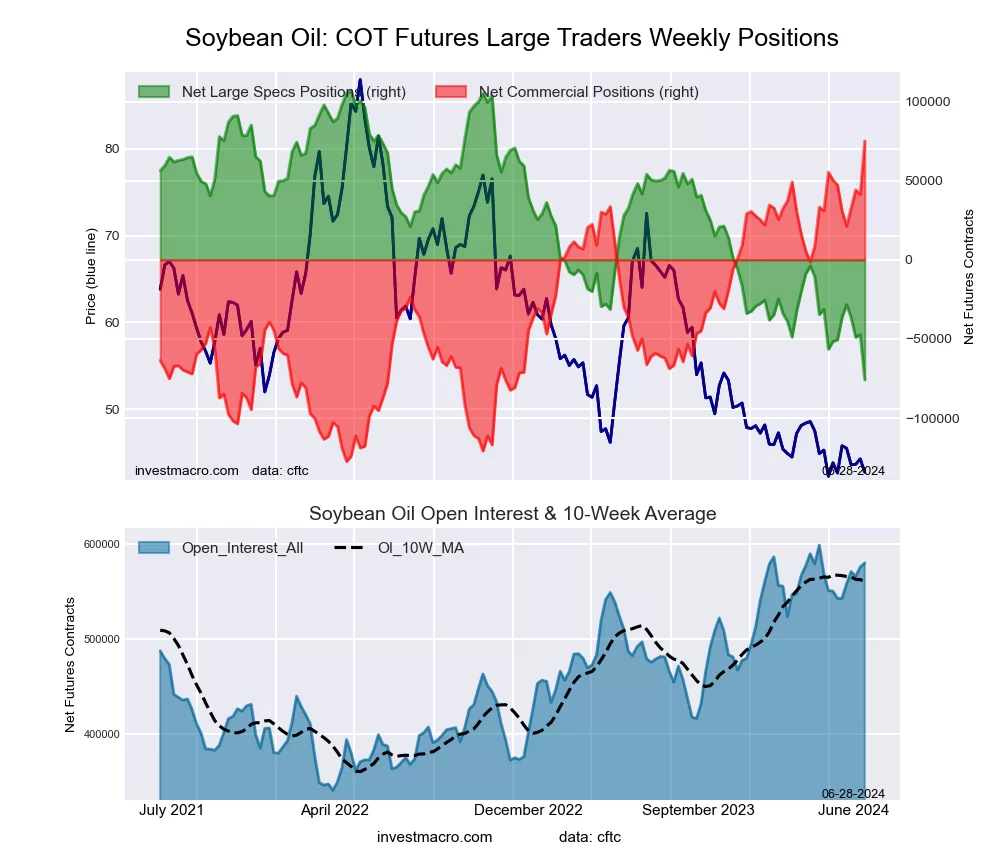 The SOYBEAN OIL large speculator standing this week resulted in a net position of -75,739 contracts in the data reported through Tuesday. This was a weekly fall of -28,553 contracts from the previous week which had a total of -47,186 net contracts.
This week’s current strength score (the trader positioning range over the past three years, measured from 0 to 100) shows the speculators are currently Bearish-Extreme with a score of 0.0 percent. The commercials are Bullish-Extreme with a score of 100.0 percent and the small traders (not shown in chart) are Bearish-Extreme with a score of 16.6 percent.
Price Trend-Following Model: Strong Downtrend
Our weekly trend-following model classifies the current market price position as: Strong Downtrend. The current action for the model is considered to be: Hold – Maintain Short Position.
| SOYBEAN OIL Futures Statistics | SPECULATORS | COMMERCIALS | SMALL TRADERS |
| – Percent of Open Interest Longs: | 20.7 | 55.4 | 5.5 |
| – Percent of Open Interest Shorts: | 33.7 | 42.4 | 5.4 |
| – Net Position: | -75,739 | 75,083 | 656 |
| – Gross Longs: | 119,940 | 321,287 | 31,856 |
| – Gross Shorts: | 195,679 | 246,204 | 31,200 |
| – Long to Short Ratio: | 0.6 to 1 | 1.3 to 1 | 1.0 to 1 |
| NET POSITION TREND: | |||
| – Strength Index Score (3 Year Range Pct): | 0.0 | 100.0 | 16.6 |
| – Strength Index Reading (3 Year Range): | Bearish-Extreme | Bullish-Extreme | Bearish-Extreme |
| NET POSITION MOVEMENT INDEX: | |||
| – 6-Week Change in Strength Index: | -13.8 | 13.8 | -10.4 |
SOYBEAN MEAL Futures:
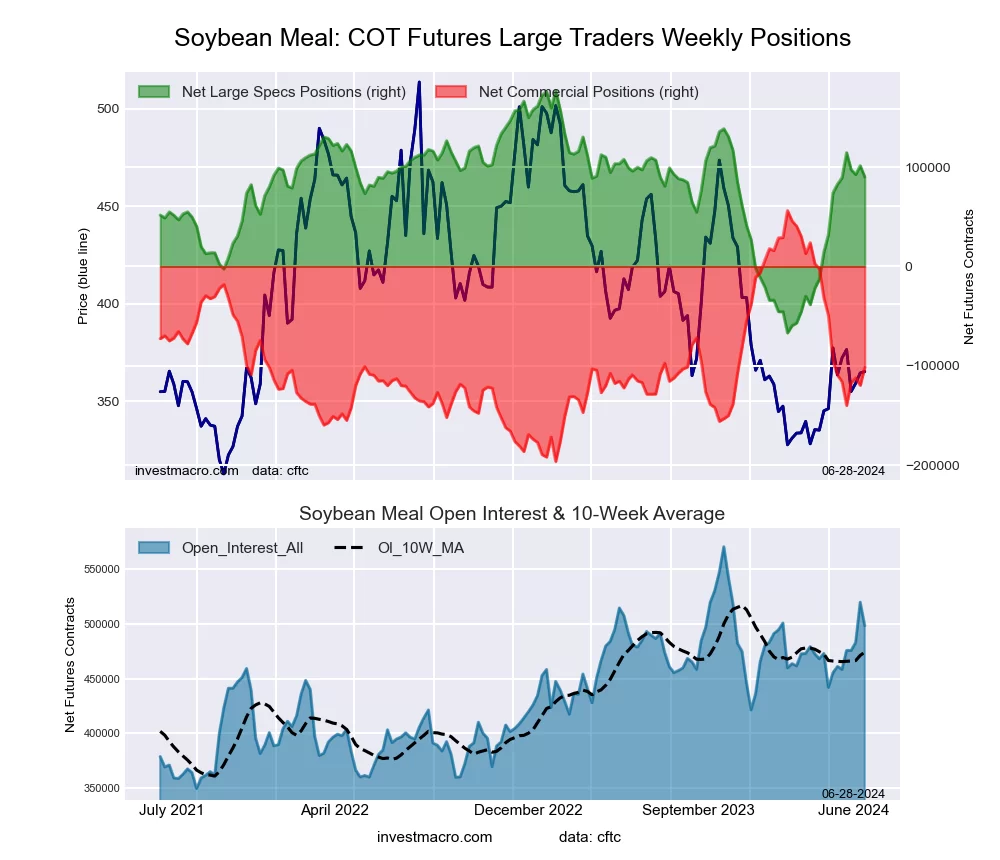 The SOYBEAN MEAL large speculator standing this week resulted in a net position of 89,981 contracts in the data reported through Tuesday. This was a weekly fall of -11,451 contracts from the previous week which had a total of 101,432 net contracts.
This week’s current strength score (the trader positioning range over the past three years, measured from 0 to 100) shows the speculators are currently Bullish with a score of 64.3 percent. The commercials are Bearish with a score of 37.5 percent and the small traders (not shown in chart) are Bearish-Extreme with a score of 7.7 percent.
Price Trend-Following Model: Uptrend
Our weekly trend-following model classifies the current market price position as: Uptrend. The current action for the model is considered to be: Hold – Maintain Long Position.
| SOYBEAN MEAL Futures Statistics | SPECULATORS | COMMERCIALS | SMALL TRADERS |
| – Percent of Open Interest Longs: | 29.7 | 38.4 | 8.5 |
| – Percent of Open Interest Shorts: | 11.7 | 58.8 | 6.2 |
| – Net Position: | 89,981 | -101,575 | 11,594 |
| – Gross Longs: | 148,158 | 191,411 | 42,356 |
| – Gross Shorts: | 58,177 | 292,986 | 30,762 |
| – Long to Short Ratio: | 2.5 to 1 | 0.7 to 1 | 1.4 to 1 |
| NET POSITION TREND: | |||
| – Strength Index Score (3 Year Range Pct): | 64.3 | 37.5 | 7.7 |
| – Strength Index Reading (3 Year Range): | Bullish | Bearish | Bearish-Extreme |
| NET POSITION MOVEMENT INDEX: | |||
| – 6-Week Change in Strength Index: | 3.0 | 3.1 | -67.6 |
LIVE CATTLE Futures:
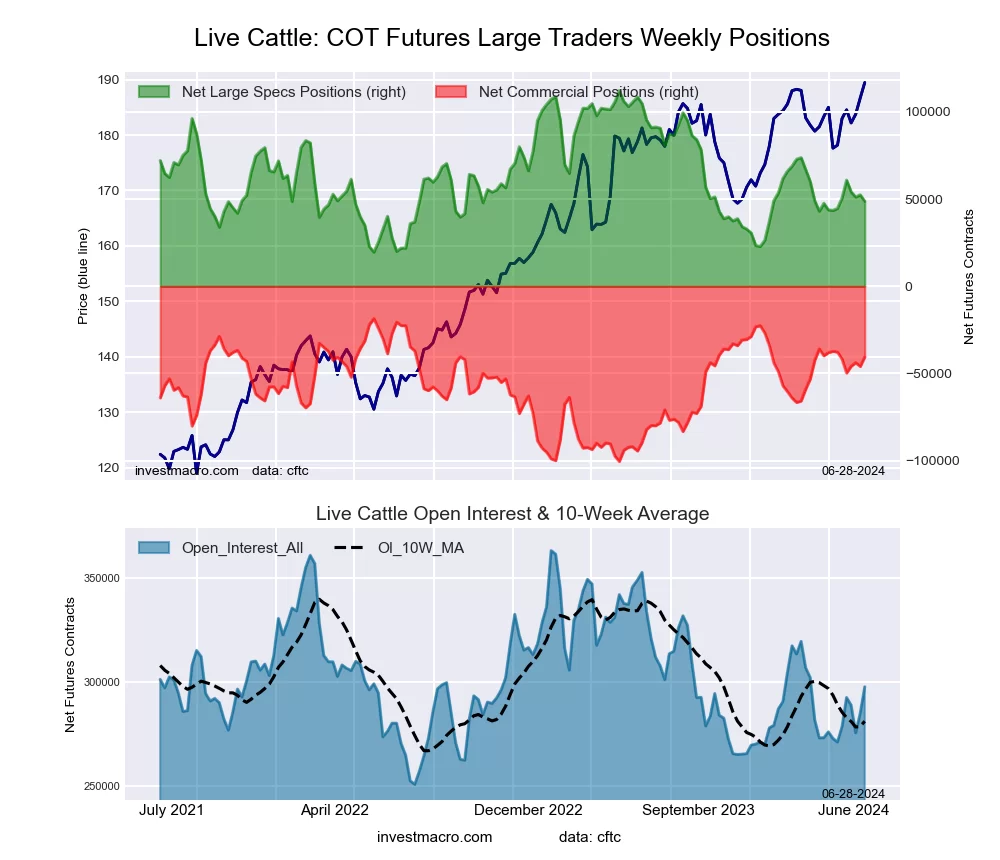 The LIVE CATTLE large speculator standing this week resulted in a net position of 48,715 contracts in the data reported through Tuesday. This was a weekly reduction of -3,732 contracts from the previous week which had a total of 52,447 net contracts.
This week’s current strength score (the trader positioning range over the past three years, measured from 0 to 100) shows the speculators are currently Bearish with a score of 31.5 percent. The commercials are Bullish with a score of 73.2 percent and the small traders (not shown in chart) are Bearish with a score of 46.2 percent.
Price Trend-Following Model: Weak Downtrend
Our weekly trend-following model classifies the current market price position as: Weak Downtrend. The current action for the model is considered to be: Hold – Maintain Short Position.
| LIVE CATTLE Futures Statistics | SPECULATORS | COMMERCIALS | SMALL TRADERS |
| – Percent of Open Interest Longs: | 41.0 | 31.2 | 9.3 |
| – Percent of Open Interest Shorts: | 24.6 | 44.9 | 12.1 |
| – Net Position: | 48,715 | -40,548 | -8,167 |
| – Gross Longs: | 121,955 | 93,017 | 27,814 |
| – Gross Shorts: | 73,240 | 133,565 | 35,981 |
| – Long to Short Ratio: | 1.7 to 1 | 0.7 to 1 | 0.8 to 1 |
| NET POSITION TREND: | |||
| – Strength Index Score (3 Year Range Pct): | 31.5 | 73.2 | 46.2 |
| – Strength Index Reading (3 Year Range): | Bearish | Bullish | Bearish |
| NET POSITION MOVEMENT INDEX: | |||
| – 6-Week Change in Strength Index: | 4.4 | -3.4 | -6.7 |
LEAN HOGS Futures:
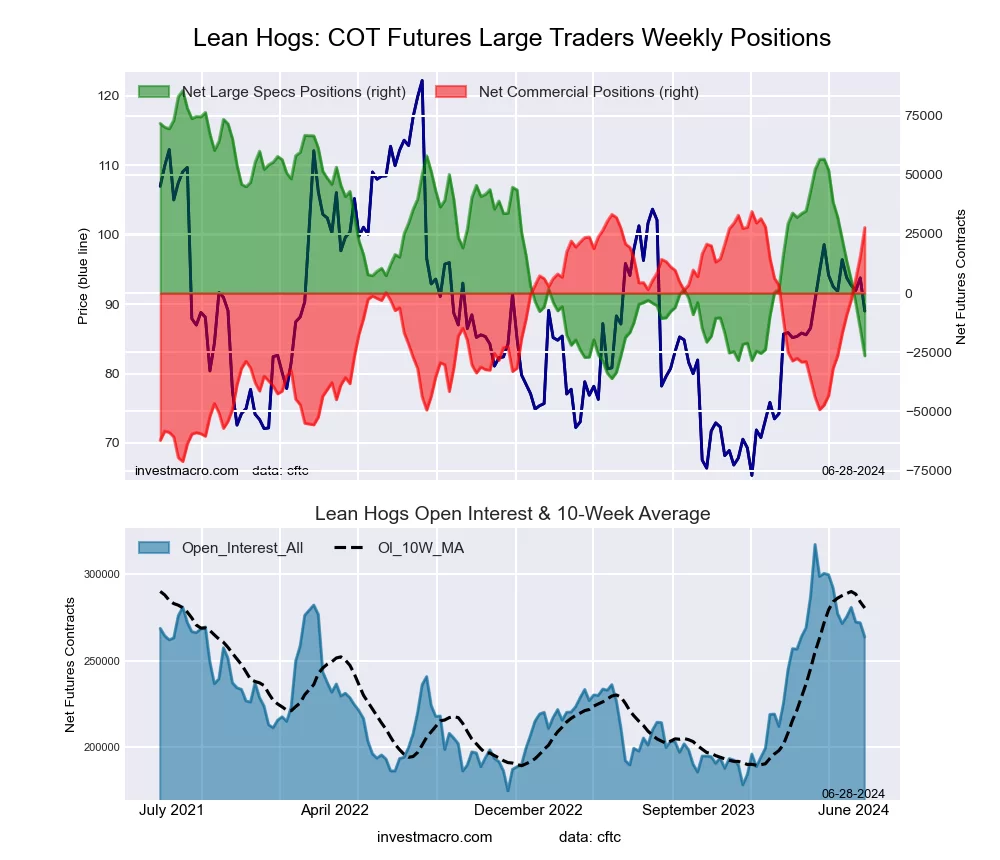 The LEAN HOGS large speculator standing this week resulted in a net position of -26,470 contracts in the data reported through Tuesday. This was a weekly decrease of -11,565 contracts from the previous week which had a total of -14,905 net contracts.
This week’s current strength score (the trader positioning range over the past three years, measured from 0 to 100) shows the speculators are currently Bearish-Extreme with a score of 7.9 percent. The commercials are Bullish-Extreme with a score of 93.6 percent and the small traders (not shown in chart) are Bullish with a score of 77.9 percent.
Price Trend-Following Model: Weak Uptrend
Our weekly trend-following model classifies the current market price position as: Weak Uptrend. The current action for the model is considered to be: Hold – Maintain Long Position.
| LEAN HOGS Futures Statistics | SPECULATORS | COMMERCIALS | SMALL TRADERS |
| – Percent of Open Interest Longs: | 30.5 | 40.7 | 8.1 |
| – Percent of Open Interest Shorts: | 40.5 | 30.2 | 8.5 |
| – Net Position: | -26,470 | 27,687 | -1,217 |
| – Gross Longs: | 80,465 | 107,333 | 21,319 |
| – Gross Shorts: | 106,935 | 79,646 | 22,536 |
| – Long to Short Ratio: | 0.8 to 1 | 1.3 to 1 | 0.9 to 1 |
| NET POSITION TREND: | |||
| – Strength Index Score (3 Year Range Pct): | 7.9 | 93.6 | 77.9 |
| – Strength Index Reading (3 Year Range): | Bearish-Extreme | Bullish-Extreme | Bullish |
| NET POSITION MOVEMENT INDEX: | |||
| – 6-Week Change in Strength Index: | -48.1 | 51.3 | 19.6 |
COTTON Futures:
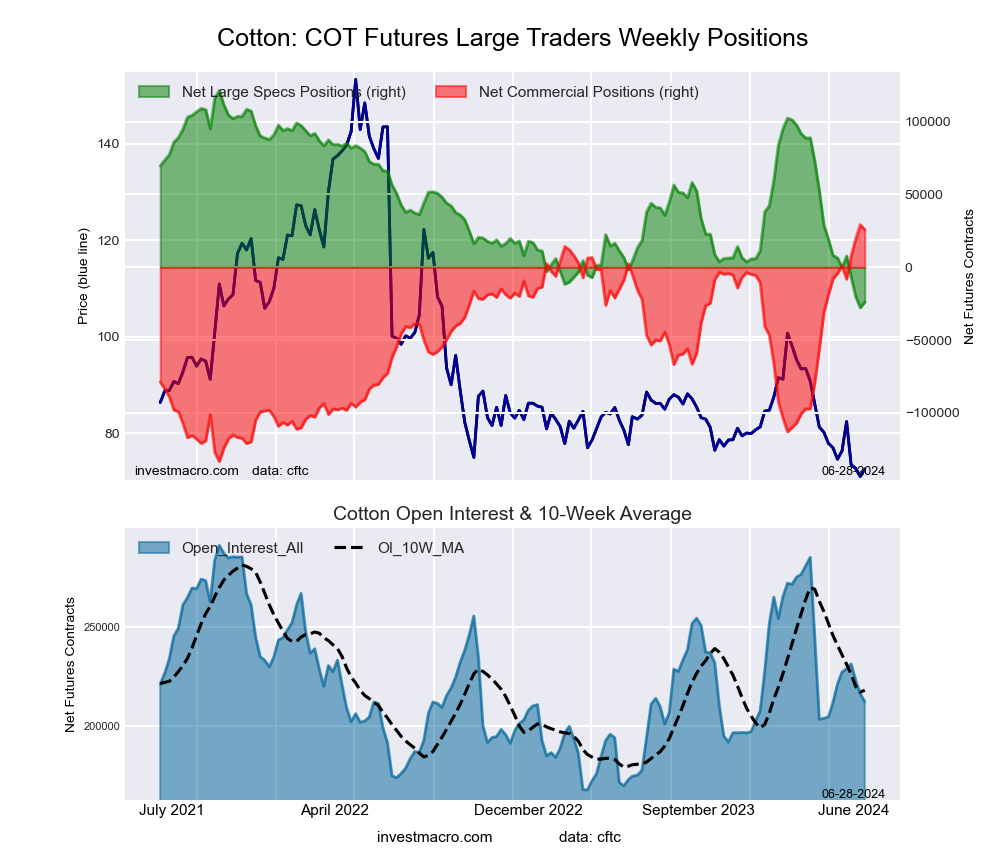 The COTTON large speculator standing this week resulted in a net position of -23,975 contracts in the data reported through Tuesday. This was a weekly gain of 3,789 contracts from the previous week which had a total of -27,764 net contracts.
This week’s current strength score (the trader positioning range over the past three years, measured from 0 to 100) shows the speculators are currently Bearish-Extreme with a score of 2.5 percent. The commercials are Bullish-Extreme with a score of 97.9 percent and the small traders (not shown in chart) are Bearish-Extreme with a score of 4.7 percent.
Price Trend-Following Model: Downtrend
Our weekly trend-following model classifies the current market price position as: Downtrend. The current action for the model is considered to be: Hold – Maintain Short Position.
| COTTON Futures Statistics | SPECULATORS | COMMERCIALS | SMALL TRADERS |
| – Percent of Open Interest Longs: | 28.5 | 49.5 | 5.0 |
| – Percent of Open Interest Shorts: | 39.8 | 37.4 | 5.9 |
| – Net Position: | -23,975 | 25,842 | -1,867 |
| – Gross Longs: | 60,552 | 105,223 | 10,719 |
| – Gross Shorts: | 84,527 | 79,381 | 12,586 |
| – Long to Short Ratio: | 0.7 to 1 | 1.3 to 1 | 0.9 to 1 |
| NET POSITION TREND: | |||
| – Strength Index Score (3 Year Range Pct): | 2.5 | 97.9 | 4.7 |
| – Strength Index Reading (3 Year Range): | Bearish-Extreme | Bullish-Extreme | Bearish-Extreme |
| NET POSITION MOVEMENT INDEX: | |||
| – 6-Week Change in Strength Index: | -20.4 | 18.5 | 1.7 |
COCOA Futures:
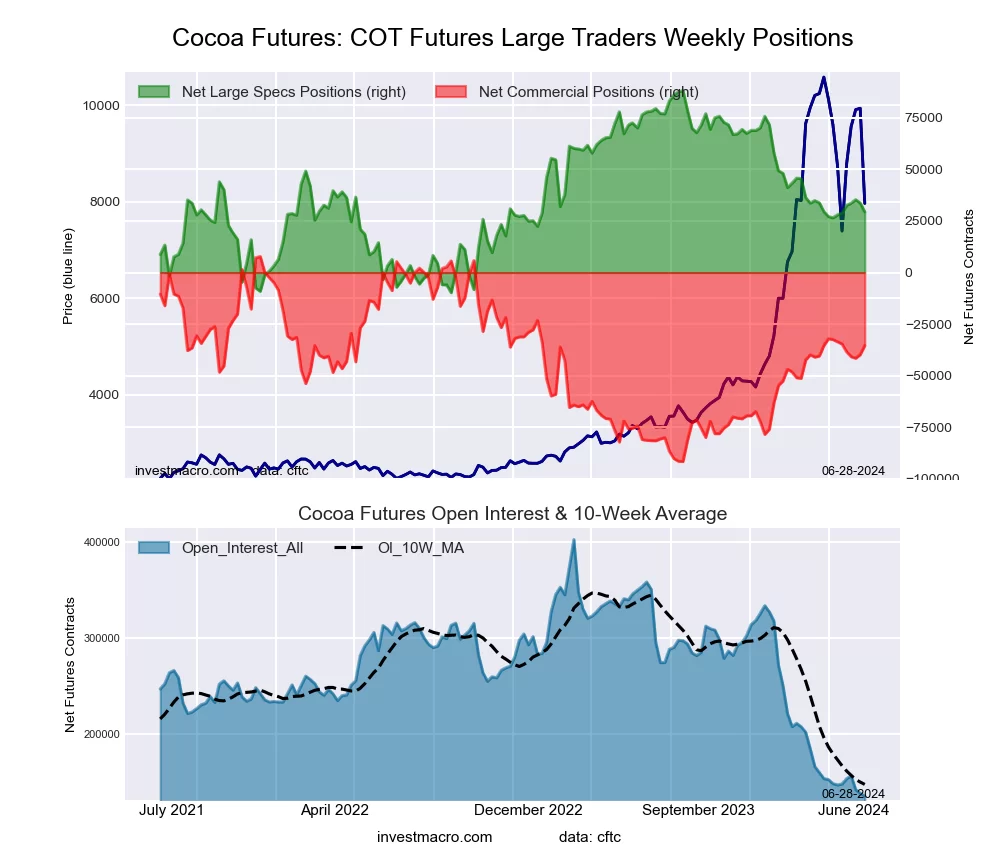 The COCOA large speculator standing this week resulted in a net position of 29,357 contracts in the data reported through Tuesday. This was a weekly decline of -4,384 contracts from the previous week which had a total of 33,741 net contracts.
This week’s current strength score (the trader positioning range over the past three years, measured from 0 to 100) shows the speculators are currently Bearish with a score of 39.9 percent. The commercials are Bullish with a score of 56.6 percent and the small traders (not shown in chart) are Bullish with a score of 63.2 percent.
Price Trend-Following Model: Weak Uptrend
Our weekly trend-following model classifies the current market price position as: Weak Uptrend. The current action for the model is considered to be: Hold – Maintain Long Position.
| COCOA Futures Statistics | SPECULATORS | COMMERCIALS | SMALL TRADERS |
| – Percent of Open Interest Longs: | 32.0 | 36.9 | 8.3 |
| – Percent of Open Interest Shorts: | 10.2 | 63.2 | 3.8 |
| – Net Position: | 29,357 | -35,345 | 5,988 |
| – Gross Longs: | 43,025 | 49,716 | 11,159 |
| – Gross Shorts: | 13,668 | 85,061 | 5,171 |
| – Long to Short Ratio: | 3.1 to 1 | 0.6 to 1 | 2.2 to 1 |
| NET POSITION TREND: | |||
| – Strength Index Score (3 Year Range Pct): | 39.9 | 56.6 | 63.2 |
| – Strength Index Reading (3 Year Range): | Bearish | Bullish | Bullish |
| NET POSITION MOVEMENT INDEX: | |||
| – 6-Week Change in Strength Index: | 1.4 | -1.8 | 3.2 |
WHEAT Futures:
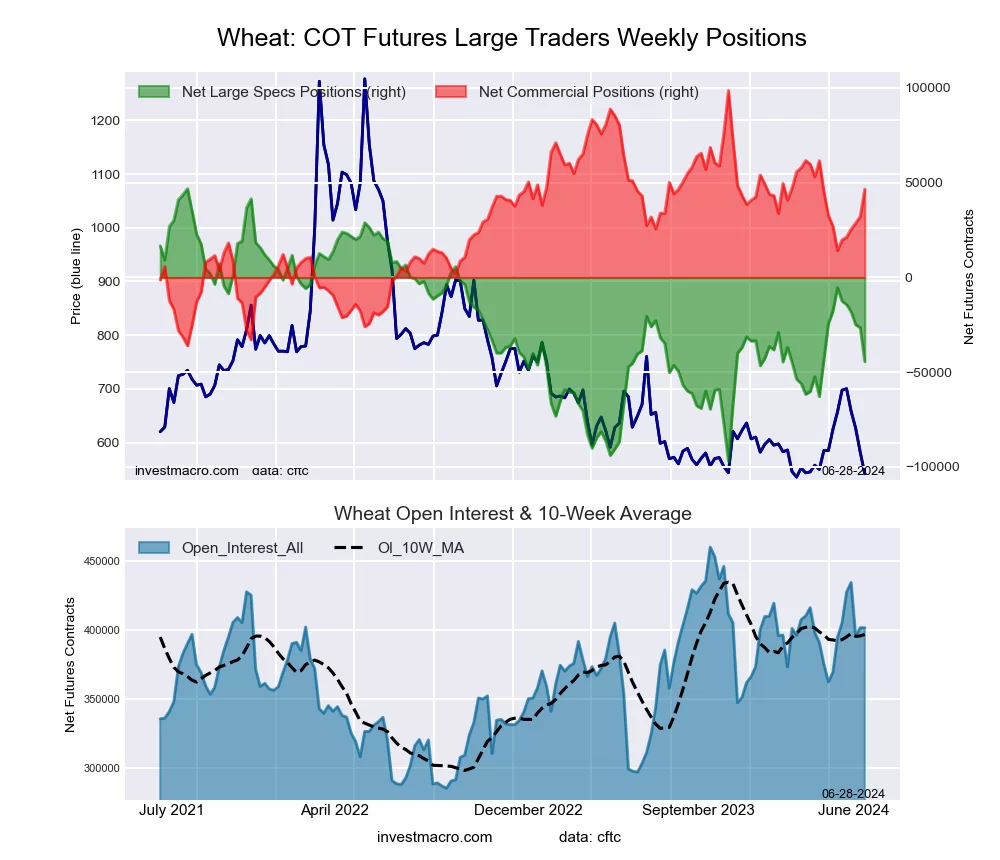 The WHEAT large speculator standing this week resulted in a net position of -44,532 contracts in the data reported through Tuesday. This was a weekly decline of -17,962 contracts from the previous week which had a total of -26,570 net contracts.
This week’s current strength score (the trader positioning range over the past three years, measured from 0 to 100) shows the speculators are currently Bearish with a score of 36.6 percent. The commercials are Bullish with a score of 61.3 percent and the small traders (not shown in chart) are Bullish with a score of 57.3 percent.
Price Trend-Following Model: Weak Uptrend
Our weekly trend-following model classifies the current market price position as: Weak Uptrend. The current action for the model is considered to be: Hold – Maintain Long Position.
| WHEAT Futures Statistics | SPECULATORS | COMMERCIALS | SMALL TRADERS |
| – Percent of Open Interest Longs: | 29.7 | 41.0 | 8.8 |
| – Percent of Open Interest Shorts: | 40.8 | 29.4 | 9.3 |
| – Net Position: | -44,532 | 46,557 | -2,025 |
| – Gross Longs: | 119,255 | 164,798 | 35,487 |
| – Gross Shorts: | 163,787 | 118,241 | 37,512 |
| – Long to Short Ratio: | 0.7 to 1 | 1.4 to 1 | 0.9 to 1 |
| NET POSITION TREND: | |||
| – Strength Index Score (3 Year Range Pct): | 36.6 | 61.3 | 57.3 |
| – Strength Index Reading (3 Year Range): | Bearish | Bullish | Bullish |
| NET POSITION MOVEMENT INDEX: | |||
| – 6-Week Change in Strength Index: | -27.2 | 24.0 | 29.2 |
Article By InvestMacro – Receive our weekly COT Newsletter
*COT Report: The COT data, released weekly to the public each Friday, is updated through the most recent Tuesday (data is 3 days old) and shows a quick view of how large speculators or non-commercials (for-profit traders) were positioned in the futures markets.
The CFTC categorizes trader positions according to commercial hedgers (traders who use futures contracts for hedging as part of the business), non-commercials (large traders who speculate to realize trading profits) and nonreportable traders (usually small traders/speculators) as well as their open interest (contracts open in the market at time of reporting). See CFTC criteria here.

- Investors run to safe-haven assets amid Middle East escalation Mar 6, 2026
- EUR/USD Under Pressure: Middle East Risks Outweigh All Else Mar 6, 2026
- Bitcoin shows resilience to Middle East events. Oil market stabilizes Mar 5, 2026
- GBP/USD: Market Not Expecting BoE Rate Cut in March Mar 5, 2026
- Brent headed for $100? Mar 4, 2026
- Global stock indices continue sell-off due to Middle East conflict Mar 4, 2026
- USD/JPY to Quickly Return to Growth: Momentum Favours the US Dollar Mar 4, 2026
- European equities plunge amid Persian Gulf military conflict Mar 3, 2026
- Gold Rallies for Fifth Day, With External Risks Mounting Mar 3, 2026
- Iran Crisis: A Dangerous Turning Point Mar 2, 2026