By RoboForex Analytical Department
As of Wednesday, the EUR/USD pair is hovering near 1.0925 after experiencing a volatile session, with expectations for a more subdued week ahead.
Recent statistical data highlighted higher-than-expected inflation in the US for February, prompting adjustments to predictions about the easing of monetary policy by the Federal Reserve in June.
The Consumer Price Index (CPI) rose by 0.4% month-on-month last month, aligning with expectations. Year-on-year, the indicator expanded to 3.2% from 3.1%. Core inflation in the US increased by 0.4% month-on-month, surpassing the forecast of 0.3%. From year to year, the indicator rose to 3.8% from the previous 3.7%.
While these figures did not come as a “surprise,” they reaffirmed that inflation is more persistent than previously thought. Specific details of the reports offer local hope for improvement, although it is clear overall that the situation could be more comfortable for the Fed to make significant decisions.
The market interpreted these developments favourably for the US dollar, shifting investor preferences towards it.
Free Reports:
Market focus is squarely on the Fed’s June meeting, with the March and May sessions attracting less interest. The Fed will likely require more statistical information by then.
As indicated by public data, investor expectations suggest a 69% chance of a rate cut in June, down from 71% earlier in the week.
In what would be the most optimistic forecast, the Fed will probably manage to cut rates only three times this year.
Technical Analysis of EUR/USD
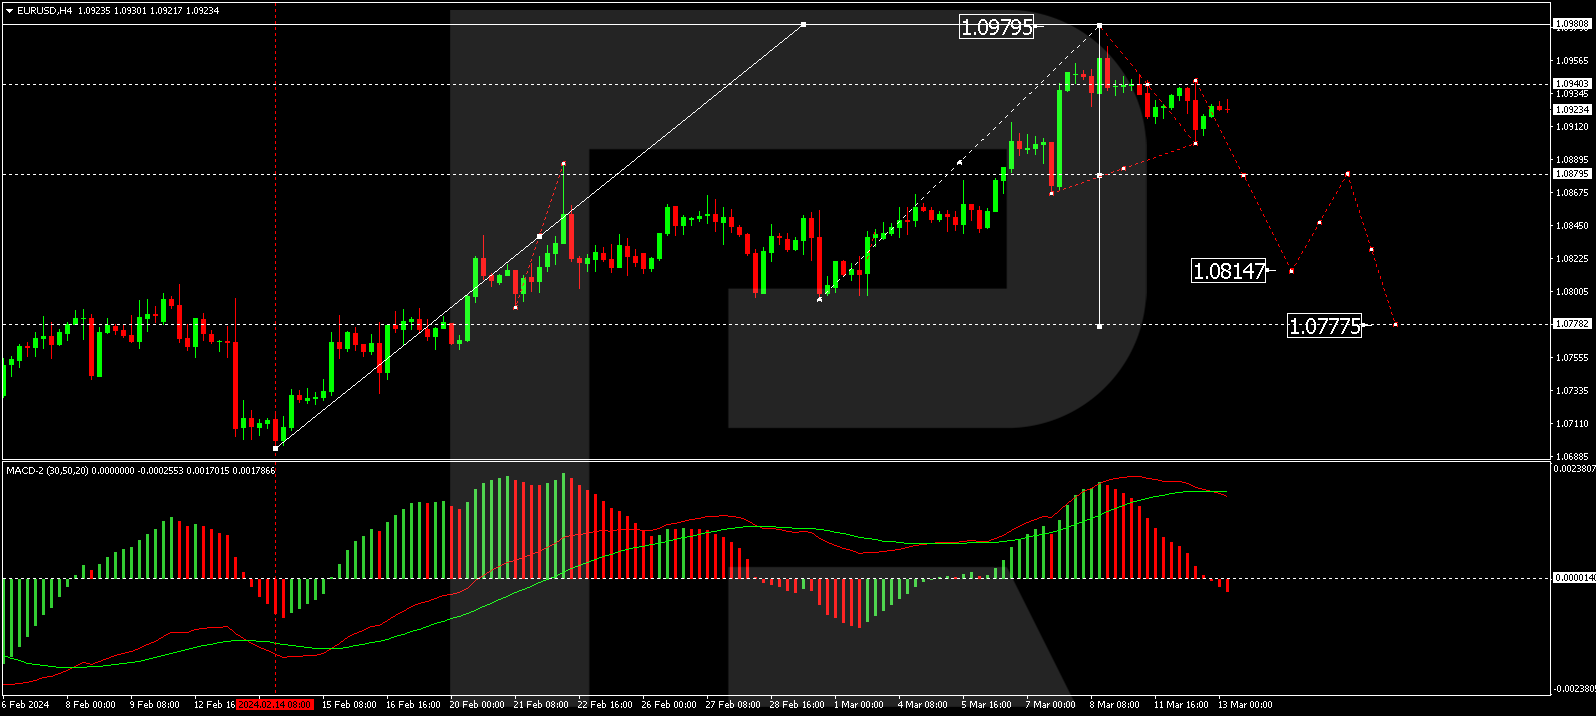
On the H4 chart, EUR/USD is forming the first wave of decline towards 1.0777. The first structure of this wave and its correction have been completed. Today, we will consider the likelihood of breaking the minimum of the first structure and continuing the development of the wave to the local target level of 1.0815. The MACD indicator confirms this scenario, with its signal line above zero and a sharply decreasing histogram, indicating the continuation of the downtrend.
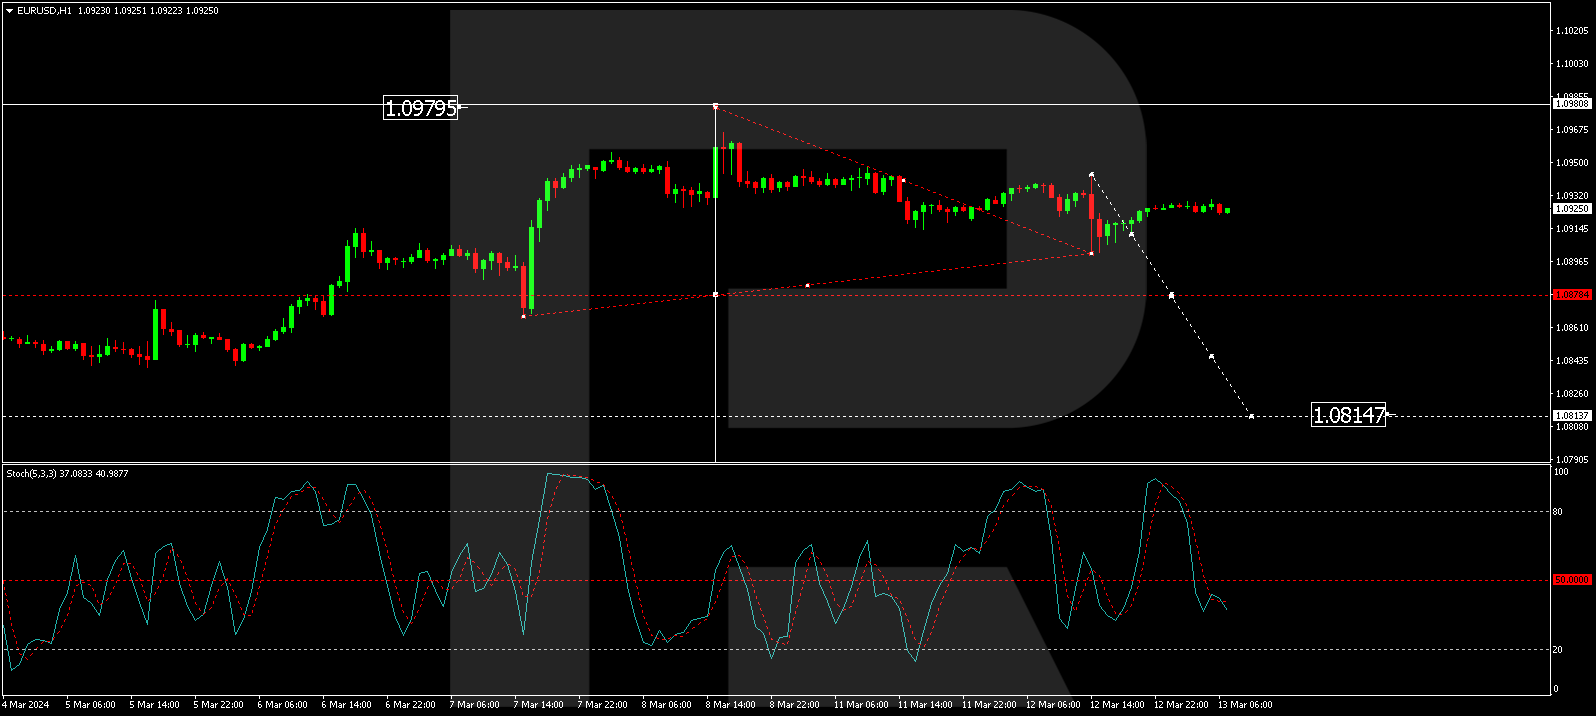
On the H1 chart, EUR/USD has formed the first wave of a decline structure to 1.0900 and a correction to 1.0939. The market has essentially delineated a consolidation range around the level of 1.0939. Today, a decline to the lower boundary of this range is expected. With a breach of 1.0900, a further decline to 1.0880 is anticipated, with the trend potentially continuing to 1.0815. The Stochastic oscillator confirms this scenario, with its signal line below the 50 mark, expecting a continuation of the decline towards 20.
Disclaimer
Any forecasts contained herein are based on the author’s particular opinion. This analysis may not be treated as trading advice. RoboForex bears no responsibility for trading results based on trading recommendations and reviews contained herein.
By Analytical Department RoboForex Gold fell to 4,033 USD per ounce on Thursday, extending its…
By JustMarkets By the end of the day, the Dow Jones Index (US30) rose by…
By JustMarkets On Tuesday, the US stock indices finished the session in the green, supported…
By Analytical Department RoboForex GBP/USD rose to 1.3403 on Wednesday, with British politics taking centre…
By Analytical Department RoboForex USD/JPY ended Tuesday at 162.27, with the Japanese yen remaining near…
By JustMarkets On Friday, the Dow Jones Index (US30) rose by 0.29% (weekly: -0.36%). The…
This website uses cookies.