
By ForexTime


Everyone wanted a piece of the precious metal last Friday after dovish comments from Jerome Powell hit the dollar along with Treasury yields. Investor appetite for gold seems to have intensified over the weekend with bulls stepping into higher gear as rate-cut bets intensified.
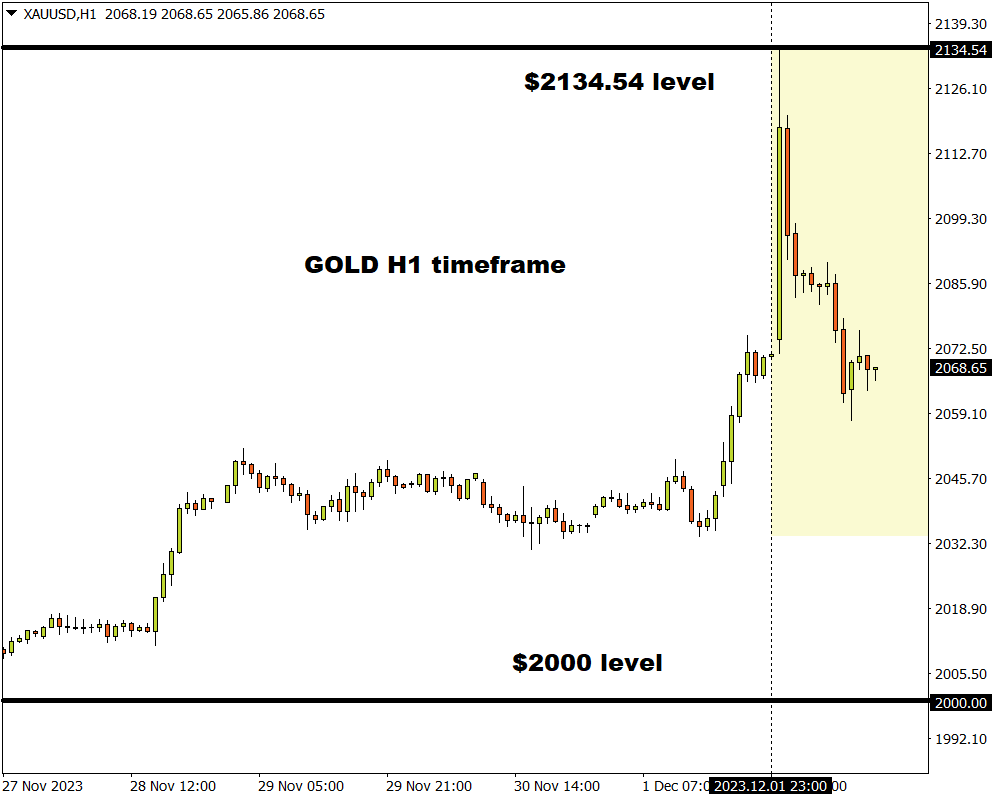
Despite the sharp pullback in prices, gold prices remain fundamentally bullish due to geopolitical risk and growing expectations for a US rate cut in 2024. Indeed, the precious metal is up roughly 15% since the October low and still trading a distance away from the psychological $2000 level.
Taking a quick look at the technicals, prices remain on an uptrend but this could be threatened if the current daily candle stick forms a shooting star pattern.
Free Reports:
Note: A shooting star is a bearish candlestick that signals a potential reversal. It can be identified with a long wick and small-bodied candlestick.
This could be another wild week for gold as the focus falls on key US economic reports that may influence expectations around what the Fed will do beyond 2023.
Here are some events that may rock gold over the next few days:
It is a data-heavy week for the US economy with all eyes will be on the latest non-farm payrolls report on Friday.
As far as markets are concerned, the Federal Reserve’s hiking campaign is over with the next move being a rate cut in 2024. Dovish comments by Powell last Friday simply reinforced these expectations with traders now pricing in a 67% probability of a 25-basis point cut by March 2024.
The real market moving this week will most likely be November’s jobs report. Markets expect the US economy to have created 200,000 jobs last month while unemployment is expected to remain unchanged at 3.9%.
The end of the truce deal between Israel and Hamas could fuel risk aversion and investors’ concerns.
A truce deal between both sides that began on November 24th ended last Friday after negotiations reached a deadlock. The temporary truce initially sparked hopes for a long-term peace deal that could reduce geopolitical risks. However, with the conflict between Israel and Hamas resuming this could send investors rushing towards safe-haven destinations like gold.
After gaining aggressively during early trading on Monday, prices came crashing down, giving back most of the gains.
Gold remains bullish on the daily charts as there have been consistently higher highs and higher lows while prices are trading above the 50, 100, and 200-day SMA. However, the Relative Strength Index (RSI) is above 70, indicating that prices are heavily overbought. In addition, the current daily candle stick could be a threat to bulls if it closes as a shooting star pattern.
ForexTime Ltd (FXTM) is an award winning international online forex broker regulated by CySEC 185/12 www.forextime.com
By InvestMacro Here are the latest charts and statistics for the Commitment of Traders (COT)…
By InvestMacro The latest update for the weekly Commitment of Traders (COT) report was released…
By InvestMacro Here are the latest charts and statistics for the Commitment of Traders (COT)…
By InvestMacro Here are the latest charts and statistics for the Commitment of Traders (COT)…
By InvestMacro Here are the latest charts and statistics for the Commitment of Traders (COT)…
By InvestMacro Here are the latest charts and statistics for the Commitment of Traders (COT)…
This website uses cookies.