By InvestMacro
Here are the latest charts and statistics for the Commitment of Traders (COT) reports data published by the Commodities Futures Trading Commission (CFTC).
The latest COT data is updated through Tuesday October 11th and shows a quick view of how large traders (for-profit speculators and commercial hedgers) were positioned in the futures markets.
10-Year Bond & Ultra US Bond lead Weekly Speculator Changes
The COT bond market speculator bets were higher this week as five out of the eight bond markets we cover had higher positioning this week while two markets had lower contracts.
Free Reports:
 Get our Weekly Commitment of Traders Reports - See where the biggest traders (Hedge Funds and Commercial Hedgers) are positioned in the futures markets on a weekly basis.
 Sign Up for Our Stock Market Newsletter – Get updated on News, Charts & Rankings of Public Companies when you join our Stocks Newsletter
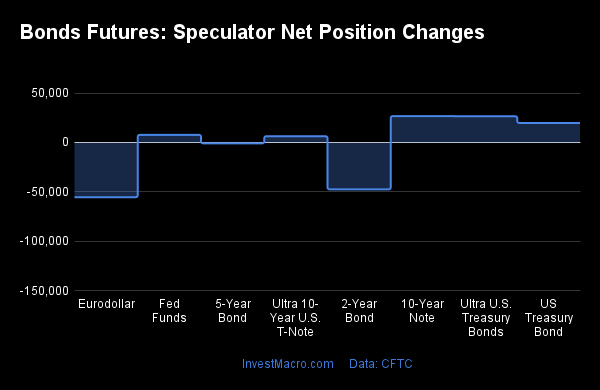
Leading the weekly gains for the bond market was the 10-Year Bond (26,709 contracts) with the Ultra US Bond (26,591 contracts), the Long US Bond (19,731 contracts), the Fed Funds (7,692 contracts) and the Ultra 10-Year (6,320 contracts) also showing positive weeks.
The bond market leading the weekly declines in speculator bets this week was the Eurodollar (-55,468 contracts) with the 2-Year Bond (-47,552 contracts) and the 5-Year Bond (-888 contracts) also registering lower bets on the week.
Highlighting the COT bonds data this week is the bearishness of the 2-Year Bond market. Speculators added over -47,000 contracts this week to the overall bearish position. The decline in the 2-Year this week follows three straight weeks of lessening bearish levels. This bearish reboot pushed the overall bearish standing up to -353,686 total net contracts which is the most in five weeks and the second highest in past 79 weeks. The 2-Year is feeling the brunt of the US Federal Reserve’s interest rate hiking campaign (to subdue inflation) and will likely not get a reprieve any time soon with inflation coming in higher again this week. The 2-Year yield (as bond prices fall, yields rise) ended the week at just under 4.50 percent and significantly higher from a 2-Year yield of just 0.38 percent on October 15th of 2021, exactly one year ago today.
| Oct-11-2022 | OI | OI-Index | Spec-Net | Spec-Index | Com-Net | COM-Index | Smalls-Net | Smalls-Index |
|---|---|---|---|---|---|---|---|---|
| Eurodollar | 8,129,682 | 0 | -2,143,216 | 14 | 2,373,775 | 83 | -230,559 | 54 |
| FedFunds | 1,617,720 | 50 | 888 | 40 | 22,183 | 63 | -23,071 | 1 |
| 2-Year | 2,045,923 | 12 | -353,686 | 11 | 443,750 | 100 | -90,064 | 12 |
| Long T-Bond | 1,211,229 | 45 | -83,792 | 57 | 56,157 | 31 | 27,635 | 75 |
| 10-Year | 3,873,986 | 56 | -340,163 | 21 | 392,171 | 68 | -52,008 | 68 |
| 5-Year | 4,040,583 | 54 | -483,920 | 12 | 601,685 | 87 | -117,765 | 49 |
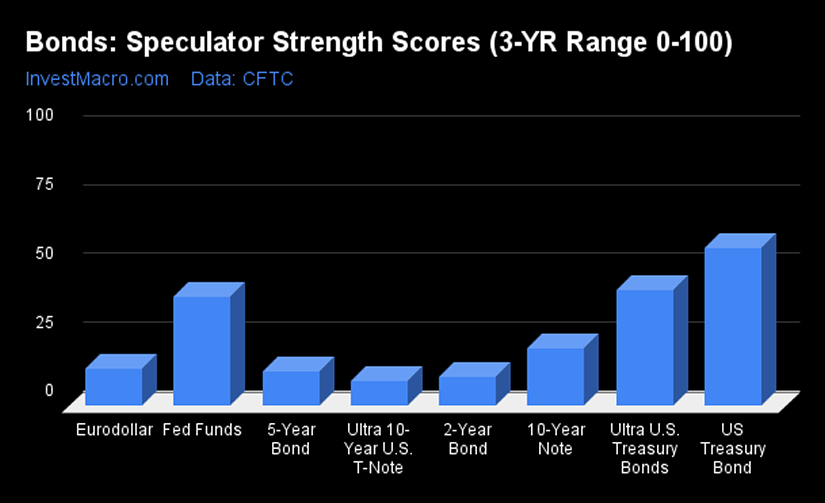
US Treasury Bond leads the Strength Scores
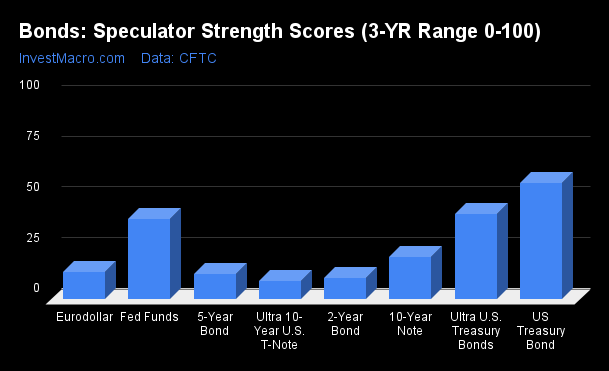
Strength Scores (a normalized measure of Speculator positions over a 3-Year range, from 0 to 100 where above 80 is extreme bullish and below 20 is extreme bearish) show that the US Treasury Bond (57.3 percent) lead the bonds category. This is the only market above 50 percent or the midpoint of its 3-year range. The Ultra US Treasury Bond (42.3 percent) comes in as the next highest bonds market in strength scores and its score this week has risen from 31.5 percent last week.
On the downside, the Ultra 10-Year Bond (9.1 percent), the 2-Year Bond (10.8 percent), the 5-Year Bond (12.3 percent) and the Eurodollar (13.7 percent) come in at the lowest strength level currently and are all in bearish extreme speculator levels (below 20 percent).
Strength Statistics:
Fed Funds (39.7 percent) vs Fed Funds previous week (38.8 percent)
2-Year Bond (10.8 percent) vs 2-Year Bond previous week (20.4 percent)
5-Year Bond (12.3 percent) vs 5-Year Bond previous week (12.5 percent)
10-Year Bond (20.7 percent) vs 10-Year Bond previous week (16.7 percent)
Ultra 10-Year Bond (9.1 percent) vs Ultra 10-Year Bond previous week (7.4 percent)
US Treasury Bond (57.3 percent) vs US Treasury Bond previous week (50.9 percent)
Ultra US Treasury Bond (42.3 percent) vs Ultra US Treasury Bond previous week (31.5 percent)
Eurodollar (13.7 percent) vs Eurodollar previous week (14.7 percent)
Strength Trends led by 10-Year Bond
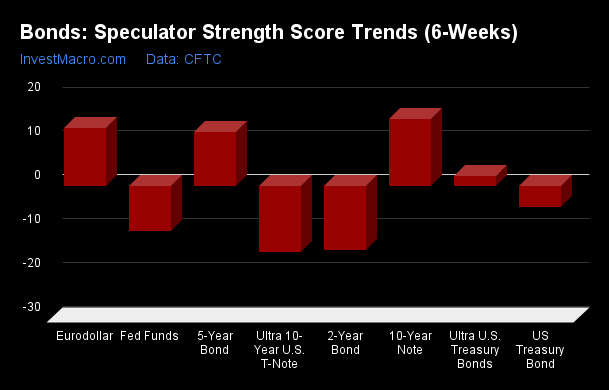
Strength Score Trends (or move index, calculates the 6-week changes in strength scores) show that the 10-Year Bond (15.2 percent) leads the past six weeks trends for bonds this week. The Eurodollar (13.2 percent), the 5-Year Bond (12.3 percent) and the Ultra US Treasury Bond (2.3 percent) fill out the rest of the positive movers in the latest trends data.
The Ultra 10-Year Bond (-15.0 percent) and the 2-Year Bond (-14.6 percent) lead the downside trend scores this week followed by the Fed Funds (-10.4 percent).
Strength Trend Statistics:
Fed Funds (-10.4 percent) vs Fed Funds previous week (-13.5 percent)
2-Year Bond (-14.6 percent) vs 2-Year Bond previous week (-13.1 percent)
5-Year Bond (12.3 percent) vs 5-Year Bond previous week (3.1 percent)
10-Year Bond (15.2 percent) vs 10-Year Bond previous week (2.2 percent)
Ultra 10-Year Bond (-15.0 percent) vs Ultra 10-Year Bond previous week (-14.8 percent)
US Treasury Bond (-4.9 percent) vs US Treasury Bond previous week (-17.0 percent)
Ultra US Treasury Bond (2.3 percent) vs Ultra US Treasury Bond previous week (-0.2 percent)
Eurodollar (13.2 percent) vs Eurodollar previous week (14.6 percent)
Individual Bond Markets:
3-Month Eurodollars Futures:
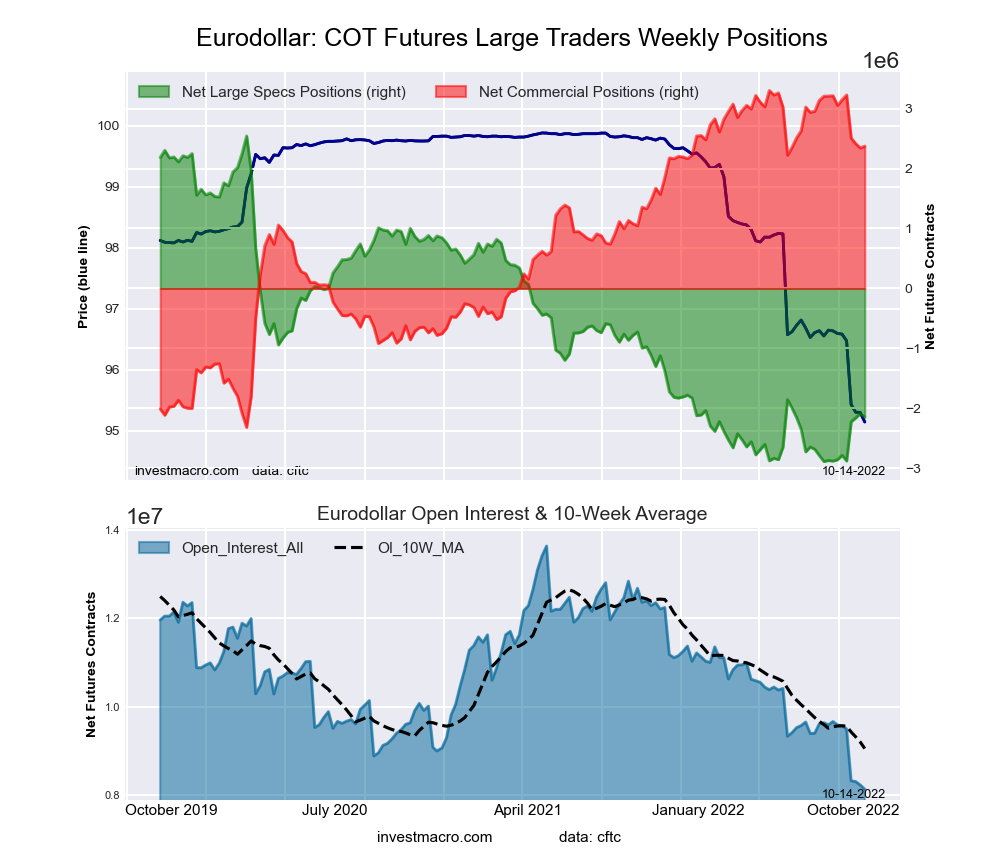 The 3-Month Eurodollars large speculator standing this week recorded a net position of -2,143,216 contracts in the data reported through Tuesday. This was a weekly decrease of -55,468 contracts from the previous week which had a total of -2,087,748 net contracts.
This week’s current strength score (the trader positioning range over the past three years, measured from 0 to 100) shows the speculators are currently Bearish-Extreme with a score of 13.7 percent. The commercials are Bullish-Extreme with a score of 83.5 percent and the small traders (not shown in chart) are Bullish with a score of 53.7 percent.
| 3-Month Eurodollars Statistics | SPECULATORS | COMMERCIALS | SMALL TRADERS |
| – Percent of Open Interest Longs: | 7.3 | 69.4 | 5.1 |
| – Percent of Open Interest Shorts: | 33.6 | 40.2 | 7.9 |
| – Net Position: | -2,143,216 | 2,373,775 | -230,559 |
| – Gross Longs: | 591,090 | 5,639,550 | 411,933 |
| – Gross Shorts: | 2,734,306 | 3,265,775 | 642,492 |
| – Long to Short Ratio: | 0.2 to 1 | 1.7 to 1 | 0.6 to 1 |
| NET POSITION TREND: | |||
| – Strength Index Score (3 Year Range Pct): | 13.7 | 83.5 | 53.7 |
| – Strength Index Reading (3 Year Range): | Bearish-Extreme | Bullish-Extreme | Bullish |
| NET POSITION MOVEMENT INDEX: | |||
| – 6-Week Change in Strength Index: | 13.2 | -12.1 | -7.6 |
30-Day Federal Funds Futures:
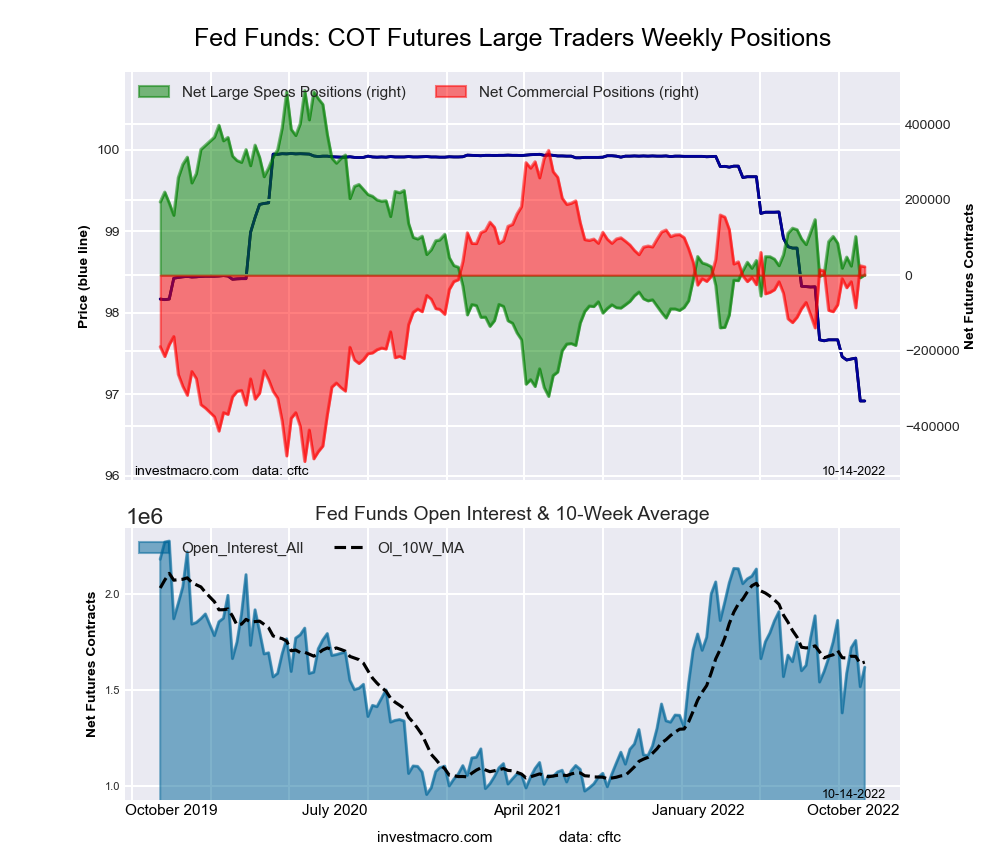 The 30-Day Federal Funds large speculator standing this week recorded a net position of 888 contracts in the data reported through Tuesday. This was a weekly rise of 7,692 contracts from the previous week which had a total of -6,804 net contracts.
This week’s current strength score (the trader positioning range over the past three years, measured from 0 to 100) shows the speculators are currently Bearish with a score of 39.7 percent. The commercials are Bullish with a score of 62.6 percent and the small traders (not shown in chart) are Bearish-Extreme with a score of 0.9 percent.
| 30-Day Federal Funds Statistics | SPECULATORS | COMMERCIALS | SMALL TRADERS |
| – Percent of Open Interest Longs: | 10.7 | 73.3 | 1.4 |
| – Percent of Open Interest Shorts: | 10.6 | 71.9 | 2.8 |
| – Net Position: | 888 | 22,183 | -23,071 |
| – Gross Longs: | 172,327 | 1,185,073 | 22,805 |
| – Gross Shorts: | 171,439 | 1,162,890 | 45,876 |
| – Long to Short Ratio: | 1.0 to 1 | 1.0 to 1 | 0.5 to 1 |
| NET POSITION TREND: | |||
| – Strength Index Score (3 Year Range Pct): | 39.7 | 62.6 | 0.9 |
| – Strength Index Reading (3 Year Range): | Bearish | Bullish | Bearish-Extreme |
| NET POSITION MOVEMENT INDEX: | |||
| – 6-Week Change in Strength Index: | -10.4 | 12.2 | -42.1 |
2-Year Treasury Note Futures:
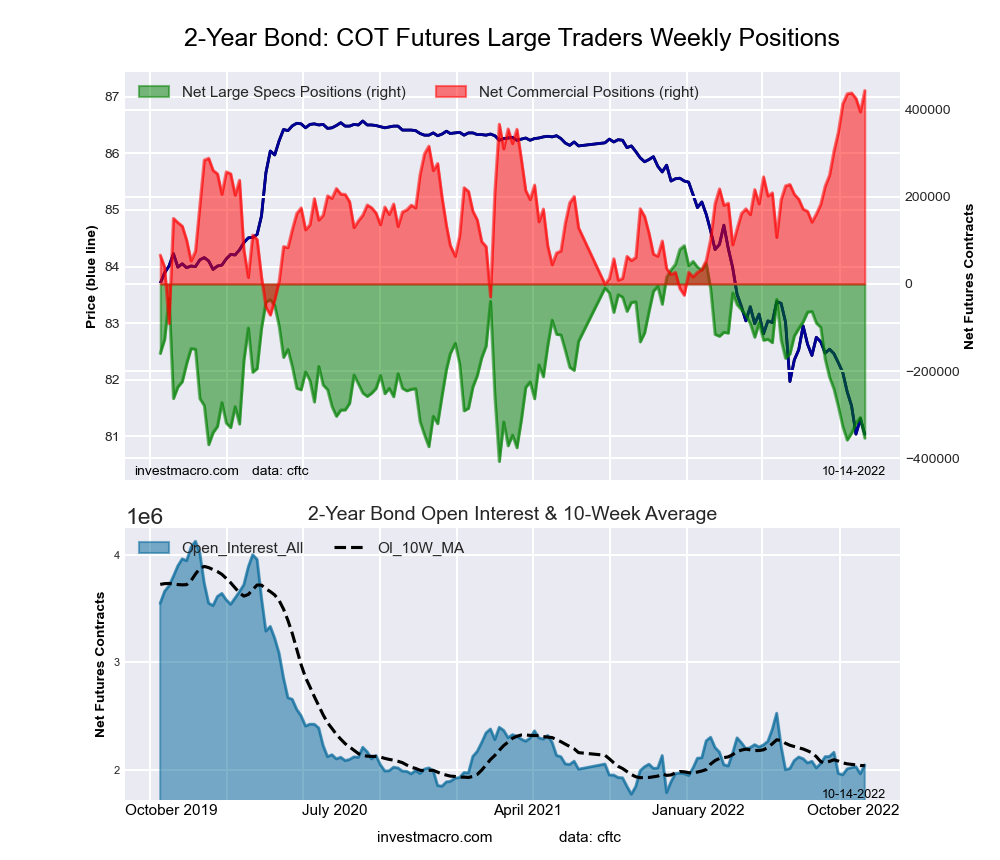 The 2-Year Treasury Note large speculator standing this week recorded a net position of -353,686 contracts in the cot data reported through Tuesday. This was a weekly lowering of -47,552 contracts from the previous week which had a total of -306,134 net contracts.
This week’s current strength score (the trader positioning range over the past three years, measured from 0 to 100) shows the speculators are currently Bearish-Extreme with a score of 10.8 percent. The commercials are Bullish-Extreme with a score of 100.0 percent and the small traders (not shown in chart) are Bearish-Extreme with a score of 11.8 percent.
| 2-Year Treasury Note Statistics | SPECULATORS | COMMERCIALS | SMALL TRADERS |
| – Percent of Open Interest Longs: | 7.0 | 82.7 | 7.9 |
| – Percent of Open Interest Shorts: | 24.3 | 61.1 | 12.3 |
| – Net Position: | -353,686 | 443,750 | -90,064 |
| – Gross Longs: | 143,277 | 1,692,889 | 160,698 |
| – Gross Shorts: | 496,963 | 1,249,139 | 250,762 |
| – Long to Short Ratio: | 0.3 to 1 | 1.4 to 1 | 0.6 to 1 |
| NET POSITION TREND: | |||
| – Strength Index Score (3 Year Range Pct): | 10.8 | 100.0 | 11.8 |
| – Strength Index Reading (3 Year Range): | Bearish-Extreme | Bullish-Extreme | Bearish-Extreme |
| NET POSITION MOVEMENT INDEX: | |||
| – 6-Week Change in Strength Index: | -14.6 | 18.5 | -10.4 |
5-Year Treasury Note Futures:
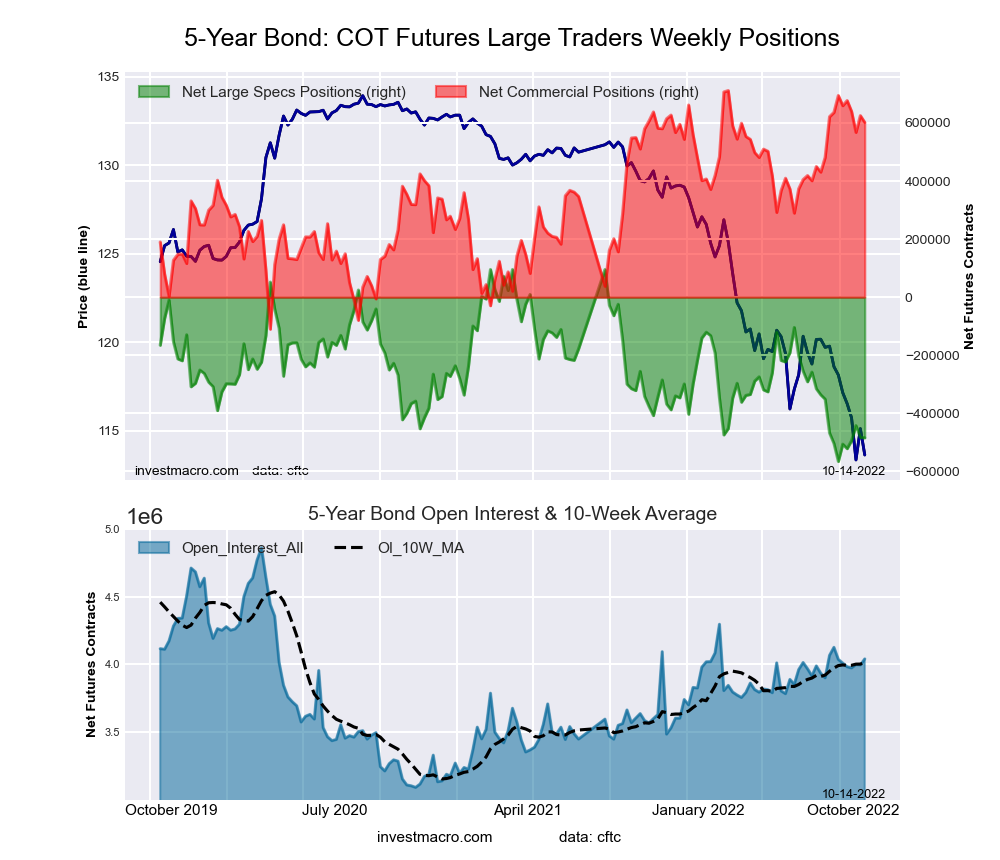 The 5-Year Treasury Note large speculator standing this week recorded a net position of -483,920 contracts in the data reported through Tuesday. This was a weekly decline of -888 contracts from the previous week which had a total of -483,032 net contracts.
This week’s current strength score (the trader positioning range over the past three years, measured from 0 to 100) shows the speculators are currently Bearish-Extreme with a score of 12.3 percent. The commercials are Bullish-Extreme with a score of 86.6 percent and the small traders (not shown in chart) are Bearish with a score of 48.6 percent.
| 5-Year Treasury Note Statistics | SPECULATORS | COMMERCIALS | SMALL TRADERS |
| – Percent of Open Interest Longs: | 6.0 | 85.5 | 7.5 |
| – Percent of Open Interest Shorts: | 18.0 | 70.6 | 10.4 |
| – Net Position: | -483,920 | 601,685 | -117,765 |
| – Gross Longs: | 243,772 | 3,456,189 | 303,741 |
| – Gross Shorts: | 727,692 | 2,854,504 | 421,506 |
| – Long to Short Ratio: | 0.3 to 1 | 1.2 to 1 | 0.7 to 1 |
| NET POSITION TREND: | |||
| – Strength Index Score (3 Year Range Pct): | 12.3 | 86.6 | 48.6 |
| – Strength Index Reading (3 Year Range): | Bearish-Extreme | Bullish-Extreme | Bearish |
| NET POSITION MOVEMENT INDEX: | |||
| – 6-Week Change in Strength Index: | 12.3 | -11.3 | 3.1 |
10-Year Treasury Note Futures:
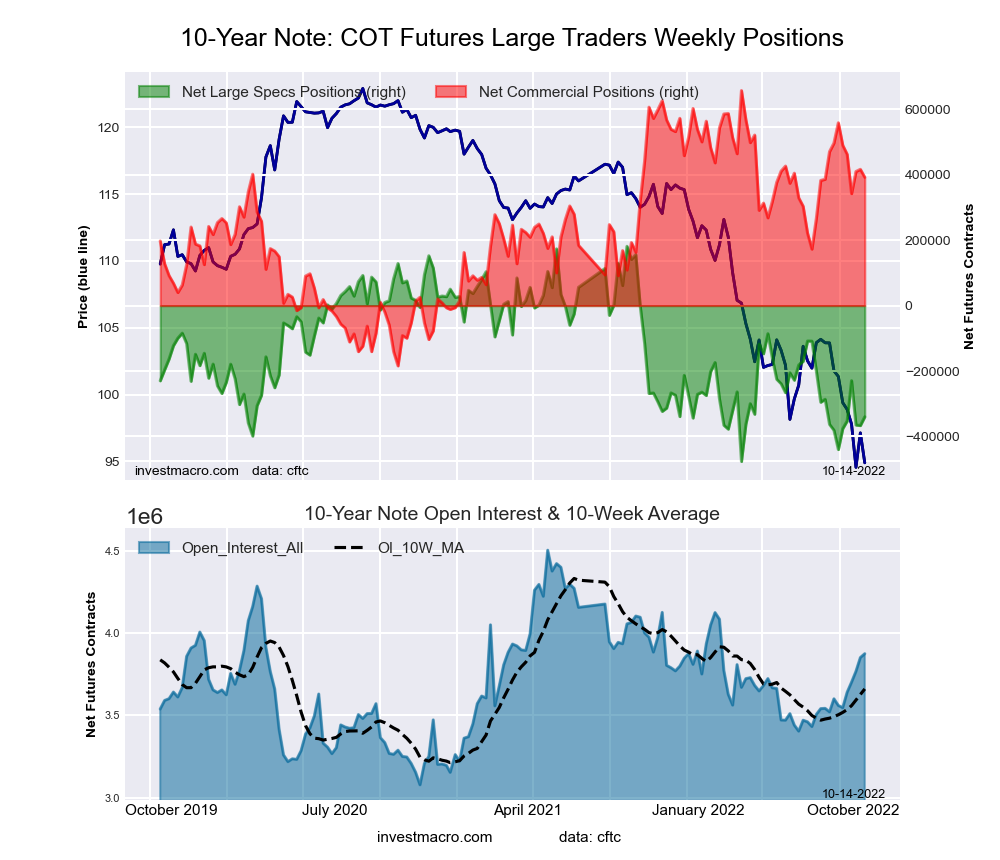 The 10-Year Treasury Note large speculator standing this week recorded a net position of -340,163 contracts in the data reported through Tuesday. This was a weekly rise of 26,709 contracts from the previous week which had a total of -366,872 net contracts.
This week’s current strength score (the trader positioning range over the past three years, measured from 0 to 100) shows the speculators are currently Bearish with a score of 20.7 percent. The commercials are Bullish with a score of 68.5 percent and the small traders (not shown in chart) are Bullish with a score of 67.7 percent.
| 10-Year Treasury Note Statistics | SPECULATORS | COMMERCIALS | SMALL TRADERS |
| – Percent of Open Interest Longs: | 9.9 | 78.5 | 8.9 |
| – Percent of Open Interest Shorts: | 18.7 | 68.3 | 10.3 |
| – Net Position: | -340,163 | 392,171 | -52,008 |
| – Gross Longs: | 382,909 | 3,039,993 | 345,964 |
| – Gross Shorts: | 723,072 | 2,647,822 | 397,972 |
| – Long to Short Ratio: | 0.5 to 1 | 1.1 to 1 | 0.9 to 1 |
| NET POSITION TREND: | |||
| – Strength Index Score (3 Year Range Pct): | 20.7 | 68.5 | 67.7 |
| – Strength Index Reading (3 Year Range): | Bearish | Bullish | Bullish |
| NET POSITION MOVEMENT INDEX: | |||
| – 6-Week Change in Strength Index: | 15.2 | -19.8 | 15.8 |
Ultra 10-Year Notes Futures:
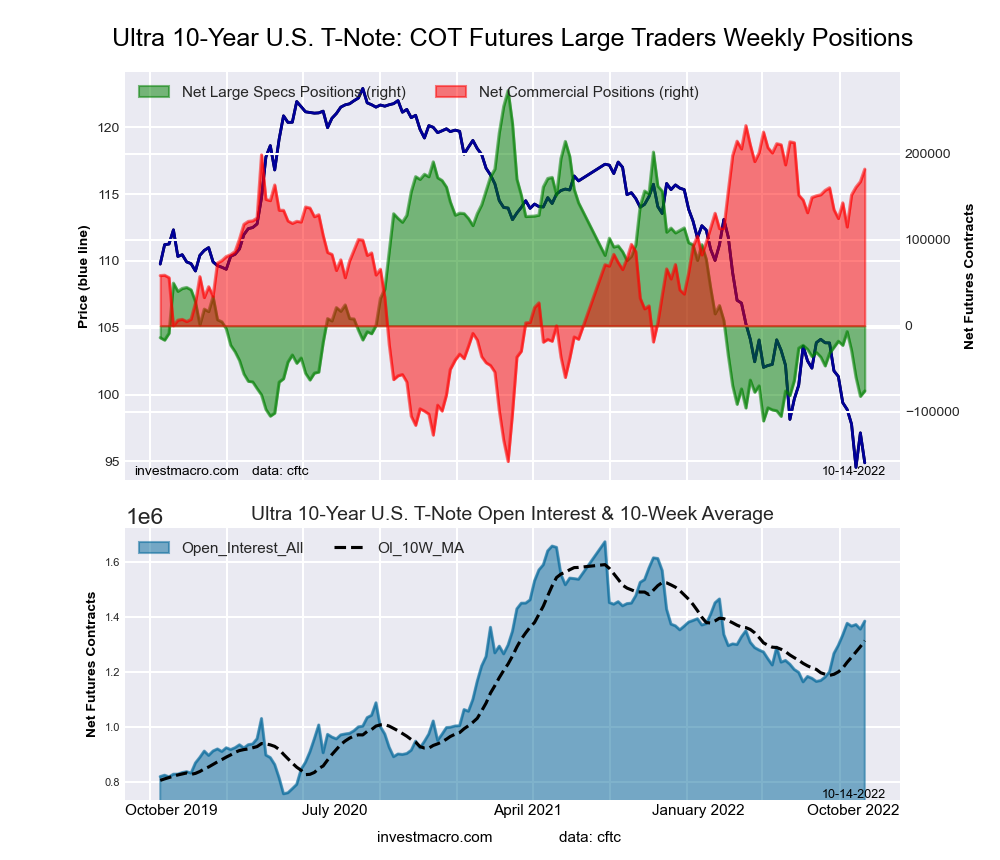 The Ultra 10-Year Notes large speculator standing this week recorded a net position of -75,771 contracts in the data reported through Tuesday. This was a weekly rise of 6,320 contracts from the previous week which had a total of -82,091 net contracts.
This week’s current strength score (the trader positioning range over the past three years, measured from 0 to 100) shows the speculators are currently Bearish-Extreme with a score of 9.1 percent. The commercials are Bullish-Extreme with a score of 87.0 percent and the small traders (not shown in chart) are Bullish with a score of 56.5 percent.
| Ultra 10-Year Notes Statistics | SPECULATORS | COMMERCIALS | SMALL TRADERS |
| – Percent of Open Interest Longs: | 7.9 | 81.4 | 10.0 |
| – Percent of Open Interest Shorts: | 13.3 | 68.3 | 17.7 |
| – Net Position: | -75,771 | 182,196 | -106,425 |
| – Gross Longs: | 109,093 | 1,127,822 | 138,379 |
| – Gross Shorts: | 184,864 | 945,626 | 244,804 |
| – Long to Short Ratio: | 0.6 to 1 | 1.2 to 1 | 0.6 to 1 |
| NET POSITION TREND: | |||
| – Strength Index Score (3 Year Range Pct): | 9.1 | 87.0 | 56.5 |
| – Strength Index Reading (3 Year Range): | Bearish-Extreme | Bullish-Extreme | Bullish |
| NET POSITION MOVEMENT INDEX: | |||
| – 6-Week Change in Strength Index: | -15.0 | 14.7 | 0.2 |
US Treasury Bonds Futures:
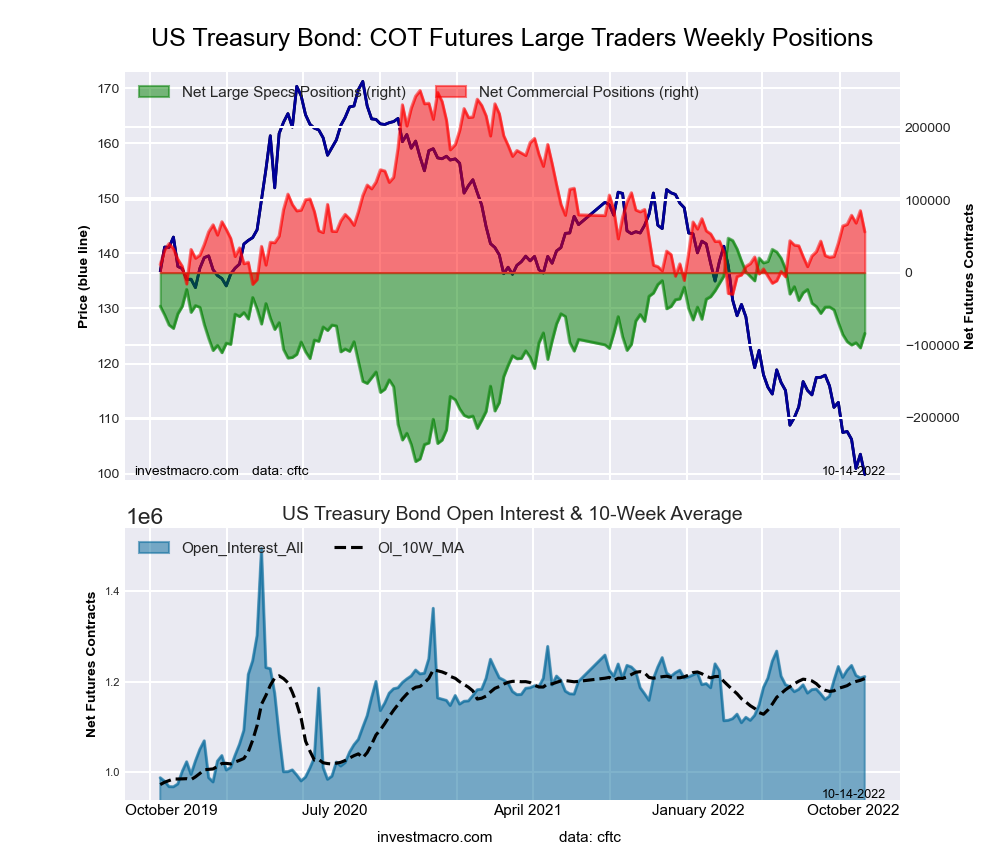 The US Treasury Bonds large speculator standing this week recorded a net position of -83,792 contracts in the data reported through Tuesday. This was a weekly rise of 19,731 contracts from the previous week which had a total of -103,523 net contracts.
This week’s current strength score (the trader positioning range over the past three years, measured from 0 to 100) shows the speculators are currently Bullish with a score of 57.3 percent. The commercials are Bearish with a score of 30.6 percent and the small traders (not shown in chart) are Bullish with a score of 74.5 percent.
| US Treasury Bonds Statistics | SPECULATORS | COMMERCIALS | SMALL TRADERS |
| – Percent of Open Interest Longs: | 6.7 | 78.5 | 13.8 |
| – Percent of Open Interest Shorts: | 13.6 | 73.9 | 11.5 |
| – Net Position: | -83,792 | 56,157 | 27,635 |
| – Gross Longs: | 81,465 | 951,230 | 166,967 |
| – Gross Shorts: | 165,257 | 895,073 | 139,332 |
| – Long to Short Ratio: | 0.5 to 1 | 1.1 to 1 | 1.2 to 1 |
| NET POSITION TREND: | |||
| – Strength Index Score (3 Year Range Pct): | 57.3 | 30.6 | 74.5 |
| – Strength Index Reading (3 Year Range): | Bullish | Bearish | Bullish |
| NET POSITION MOVEMENT INDEX: | |||
| – 6-Week Change in Strength Index: | -4.9 | 5.5 | -0.3 |
Ultra US Treasury Bonds Futures:
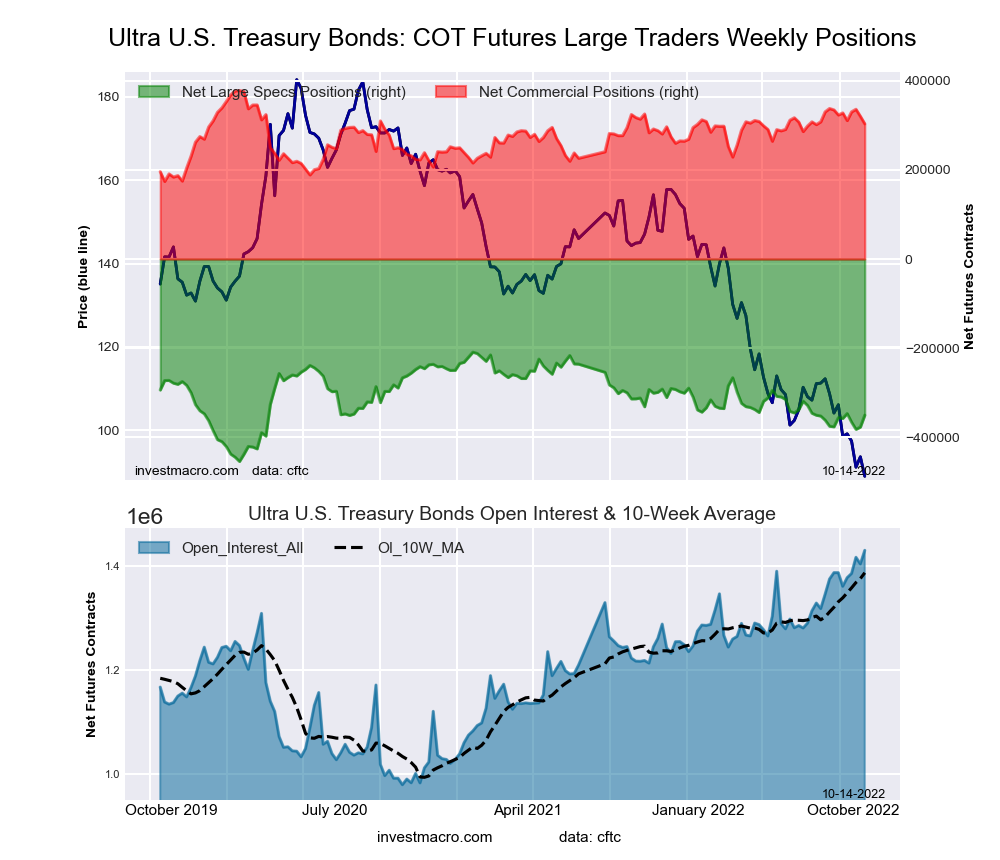 The Ultra US Treasury Bonds large speculator standing this week recorded a net position of -350,232 contracts in the data reported through Tuesday. This was a weekly advance of 26,591 contracts from the previous week which had a total of -376,823 net contracts.
This week’s current strength score (the trader positioning range over the past three years, measured from 0 to 100) shows the speculators are currently Bearish with a score of 42.3 percent. The commercials are Bullish with a score of 63.2 percent and the small traders (not shown in chart) are Bullish with a score of 62.0 percent.
| Ultra US Treasury Bonds Statistics | SPECULATORS | COMMERCIALS | SMALL TRADERS |
| – Percent of Open Interest Longs: | 6.2 | 82.0 | 11.2 |
| – Percent of Open Interest Shorts: | 30.7 | 60.7 | 7.9 |
| – Net Position: | -350,232 | 303,283 | 46,949 |
| – Gross Longs: | 88,146 | 1,171,440 | 160,022 |
| – Gross Shorts: | 438,378 | 868,157 | 113,073 |
| – Long to Short Ratio: | 0.2 to 1 | 1.3 to 1 | 1.4 to 1 |
| NET POSITION TREND: | |||
| – Strength Index Score (3 Year Range Pct): | 42.3 | 63.2 | 62.0 |
| – Strength Index Reading (3 Year Range): | Bearish | Bullish | Bullish |
| NET POSITION MOVEMENT INDEX: | |||
| – 6-Week Change in Strength Index: | 2.3 | -9.8 | 10.3 |
Article By InvestMacro – Receive our weekly COT Newsletter
*COT Report: The COT data, released weekly to the public each Friday, is updated through the most recent Tuesday (data is 3 days old) and shows a quick view of how large speculators or non-commercials (for-profit traders) were positioned in the futures markets.
The CFTC categorizes trader positions according to commercial hedgers (traders who use futures contracts for hedging as part of the business), non-commercials (large traders who speculate to realize trading profits) and nonreportable traders (usually small traders/speculators) as well as their open interest (contracts open in the market at time of reporting). See CFTC criteria here.

- The US introduces new import tariffs for 60 countries. Brent crude surpasses $100 per barrel Jul 24, 2026
- USD/JPY Breaks Records: Nothing Slows the Yen’s Decline Jul 24, 2026
- Oil prices reached a 6‑week high. The AUD strengthened on the back of a strong labor‑market report Jul 23, 2026
- EUR/USD Recovers as Dollar Weakens Jul 23, 2026
- Bitcoin rose to $66,000. The New Zealand dollar continues to strengthen Jul 22, 2026
- Inflationary pressure is easing in Canada. In New Zealand, on the contrary, inflation is rising Jul 21, 2026
- GBP/USD Falls After Cabinet Changes Jul 21, 2026
- Geopolitical and macroeconomic conditions continue to pressure market sentiment Jul 20, 2026
- USD/JPY Poised to Continue Gains as Expensive Oil and Lack of Support Weigh on Yen Jul 20, 2026
- COT Metals Charts: Weekly Speculator Bets led by Copper & Steel Jul 18, 2026