
By InvestMacro | COT | Data Tables | COT Leaders | Downloads | COT Newsletter
Here are the latest charts and statistics for the Commitment of Traders (COT) data published by the Commodities Futures Trading Commission (CFTC).
The latest COT data is updated through Tuesday May 24th and shows a quick view of how large traders (for-profit speculators and commercial entities) were positioned in the futures markets.
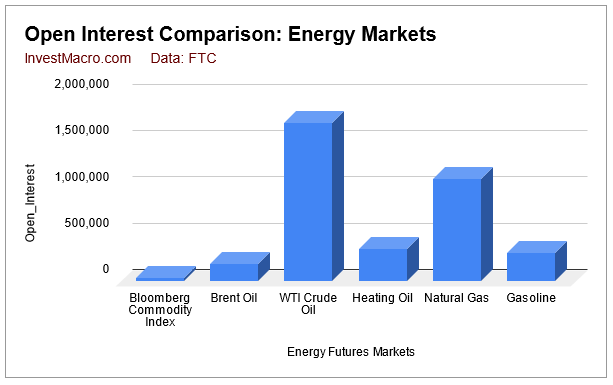
Energy market speculator bets were mixed this week as three out of the six energy markets we cover had higher positioning this week while three markets had lower contracts. Leading the gains for energy was WTI Crude Oil (9,124 contracts) and Natural Gas (3,442 contracts) with the Bloomberg Commodity Index (126 contracts) also showing a positive week. Meanwhile, leading the declines in speculator bets this week were Heating Oil (-9,228 contracts) and Brent Crude Oil (-4,422 contracts) with Gasoline (-1,373 contracts) also registering lower bets on the week.
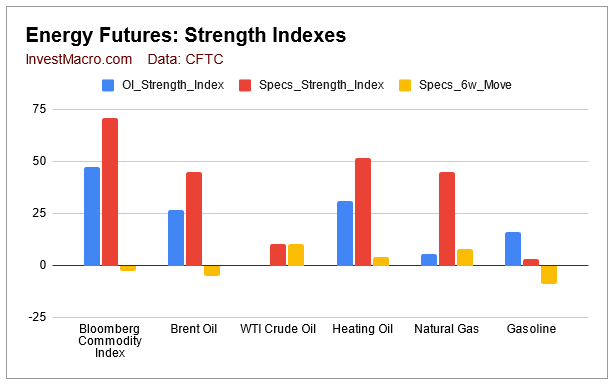 Speculator strength standings for each Commodity where strength index is current net position compared to past three years, above 80 is bullish extreme, below 20 is bearish extreme
Free Reports:
 Sign Up for Our Stock Market Newsletter – Get updated on News, Charts & Rankings of Public Companies when you join our Stocks Newsletter
 Get our Weekly Commitment of Traders Reports - See where the biggest traders (Hedge Funds and Commercial Hedgers) are positioned in the futures markets on a weekly basis.
- OI Strength = Current Open Interest level compared to last 3 years range
- Spec Strength = Current Net Speculator level compared to last 3 years range
- Strength Move = Six week change of Spec Strength
| May-24-2022 | OI | OI-Index | Spec-Net | Spec-Index | Com-Net | COM-Index | Smalls-Net | Smalls-Index |
|---|---|---|---|---|---|---|---|---|
| WTI Crude | 1,711,863 | 0 | 334,761 | 11 | -374,627 | 91 | 39,866 | 71 |
| Gold | 530,098 | 22 | 183,813 | 14 | -211,947 | 82 | 28,134 | 37 |
| Silver | 146,456 | 13 | 14,103 | 26 | -23,297 | 88 | 9,194 | 3 |
| Copper | 186,433 | 17 | -19,633 | 28 | 19,288 | 73 | 345 | 27 |
| Palladium | 7,919 | 7 | -3,472 | 2 | 3,800 | 98 | -328 | 25 |
| Platinum | 65,824 | 32 | 1,485 | 5 | -6,683 | 96 | 5,198 | 34 |
| Natural Gas | 1,107,496 | 6 | -111,570 | 45 | 63,847 | 51 | 47,723 | 93 |
| Brent | 183,629 | 27 | -39,289 | 45 | 37,488 | 56 | 1,801 | 34 |
| Heating Oil | 349,618 | 31 | 6,455 | 52 | -32,434 | 37 | 25,979 | 88 |
| Soybeans | 729,900 | 28 | 188,368 | 72 | -159,047 | 34 | -29,321 | 21 |
| Corn | 1,544,885 | 29 | 427,848 | 85 | -372,522 | 19 | -55,326 | 11 |
| Coffee | 211,266 | 5 | 37,072 | 71 | -38,484 | 34 | 1,412 | 4 |
| Sugar | 847,420 | 11 | 209,487 | 80 | -255,450 | 20 | 45,963 | 65 |
| Wheat | 326,607 | 8 | 26,344 | 53 | -24,339 | 25 | -2,005 | 100 |
WTI Crude Oil Futures:
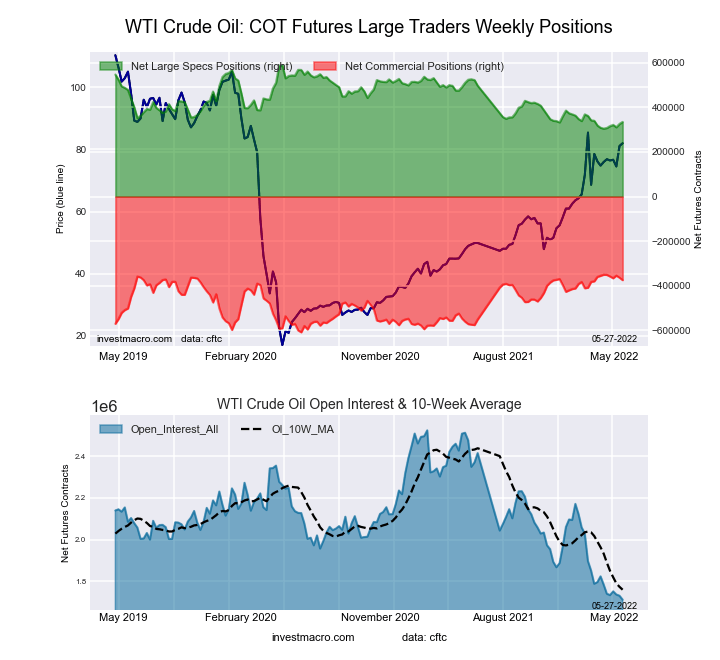 The WTI Crude Oil Futures large speculator standing this week was a net position of 334,761 contracts in the data reported through Tuesday. This was a weekly increase of 9,124 contracts from the previous week which had a total of 325,637 net contracts.
This week’s current strength score (the trader positioning range over the past three years, measured from 0 to 100) shows the speculators are currently Bearish-Extreme with a score of 10.5 percent. The commercials are Bullish-Extreme with a score of 90.7 percent and the small traders (not shown in chart) are Bullish with a score of 71.2 percent.
| WTI Crude Oil Futures Statistics | SPECULATORS | COMMERCIALS | SMALL TRADERS |
| – Percent of Open Interest Longs: | 24.7 | 34.1 | 5.0 |
| – Percent of Open Interest Shorts: | 5.1 | 56.0 | 2.7 |
| – Net Position: | 334,761 | -374,627 | 39,866 |
| – Gross Longs: | 422,541 | 584,496 | 86,091 |
| – Gross Shorts: | 87,780 | 959,123 | 46,225 |
| – Long to Short Ratio: | 4.8 to 1 | 0.6 to 1 | 1.9 to 1 |
| NET POSITION TREND: | |||
| – Strength Index Score (3 Year Range Pct): | 10.5 | 90.7 | 71.2 |
| – Strength Index Reading (3 Year Range): | Bearish-Extreme | Bullish-Extreme | Bullish |
| NET POSITION MOVEMENT INDEX: | |||
| – 6-Week Change in Strength Index: | 10.5 | -9.3 | -8.4 |
Brent Crude Oil Futures:
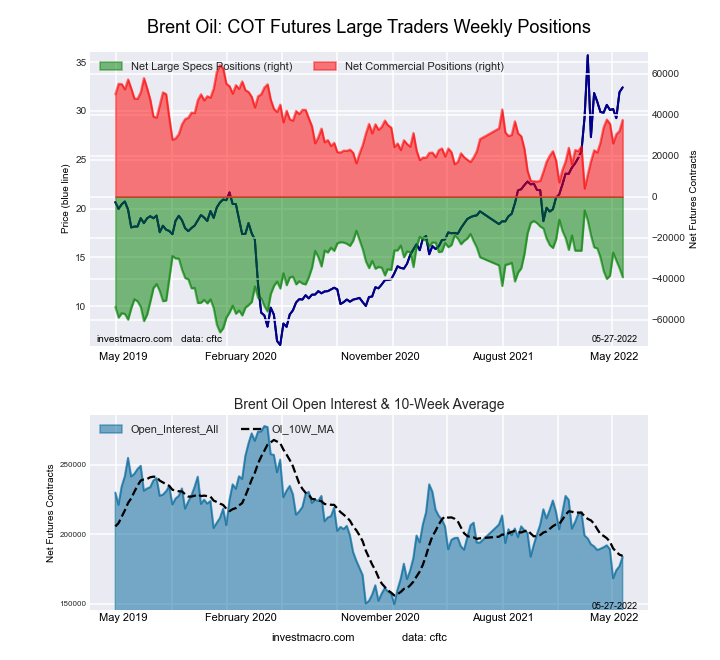 The Brent Crude Oil Futures large speculator standing this week was a net position of -39,289 contracts in the data reported through Tuesday. This was a weekly decline of -4,422 contracts from the previous week which had a total of -34,867 net contracts.
This week’s current strength score (the trader positioning range over the past three years, measured from 0 to 100) shows the speculators are currently Bearish with a score of 45.2 percent. The commercials are Bullish with a score of 55.6 percent and the small traders (not shown in chart) are Bearish with a score of 33.6 percent.
| Brent Crude Oil Futures Statistics | SPECULATORS | COMMERCIALS | SMALL TRADERS |
| – Percent of Open Interest Longs: | 14.8 | 52.6 | 3.7 |
| – Percent of Open Interest Shorts: | 36.2 | 32.2 | 2.7 |
| – Net Position: | -39,289 | 37,488 | 1,801 |
| – Gross Longs: | 27,144 | 96,551 | 6,828 |
| – Gross Shorts: | 66,433 | 59,063 | 5,027 |
| – Long to Short Ratio: | 0.4 to 1 | 1.6 to 1 | 1.4 to 1 |
| NET POSITION TREND: | |||
| – Strength Index Score (3 Year Range Pct): | 45.2 | 55.6 | 33.6 |
| – Strength Index Reading (3 Year Range): | Bearish | Bullish | Bearish |
| NET POSITION MOVEMENT INDEX: | |||
| – 6-Week Change in Strength Index: | -5.0 | 5.9 | -7.9 |
Natural Gas Futures:
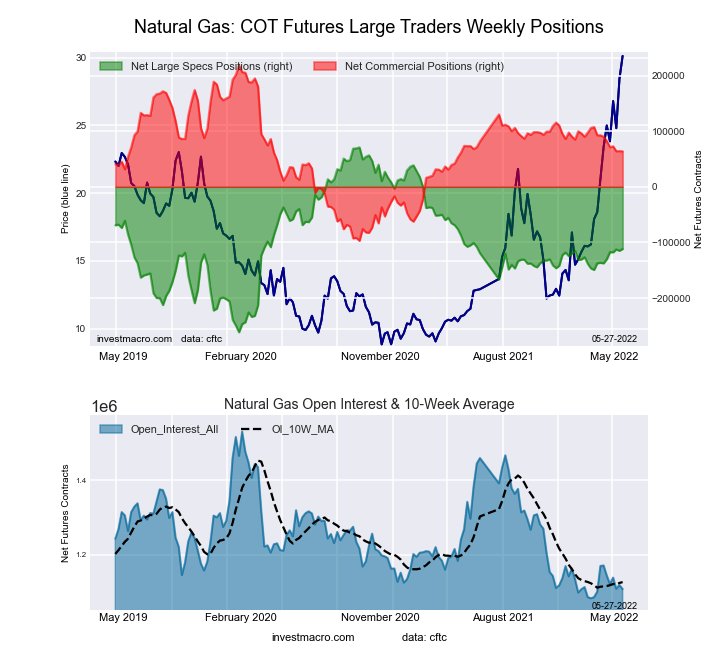 The Natural Gas Futures large speculator standing this week was a net position of -111,570 contracts in the data reported through Tuesday. This was a weekly gain of 3,442 contracts from the previous week which had a total of -115,012 net contracts.
This week’s current strength score (the trader positioning range over the past three years, measured from 0 to 100) shows the speculators are currently Bearish with a score of 45.1 percent. The commercials are Bullish with a score of 51.0 percent and the small traders (not shown in chart) are Bullish-Extreme with a score of 93.0 percent.
| Natural Gas Futures Statistics | SPECULATORS | COMMERCIALS | SMALL TRADERS |
| – Percent of Open Interest Longs: | 20.8 | 37.4 | 6.7 |
| – Percent of Open Interest Shorts: | 30.9 | 31.6 | 2.4 |
| – Net Position: | -111,570 | 63,847 | 47,723 |
| – Gross Longs: | 230,219 | 413,701 | 74,555 |
| – Gross Shorts: | 341,789 | 349,854 | 26,832 |
| – Long to Short Ratio: | 0.7 to 1 | 1.2 to 1 | 2.8 to 1 |
| NET POSITION TREND: | |||
| – Strength Index Score (3 Year Range Pct): | 45.1 | 51.0 | 93.0 |
| – Strength Index Reading (3 Year Range): | Bearish | Bullish | Bullish-Extreme |
| NET POSITION MOVEMENT INDEX: | |||
| – 6-Week Change in Strength Index: | 7.8 | -8.4 | 0.9 |
Gasoline Blendstock Futures:
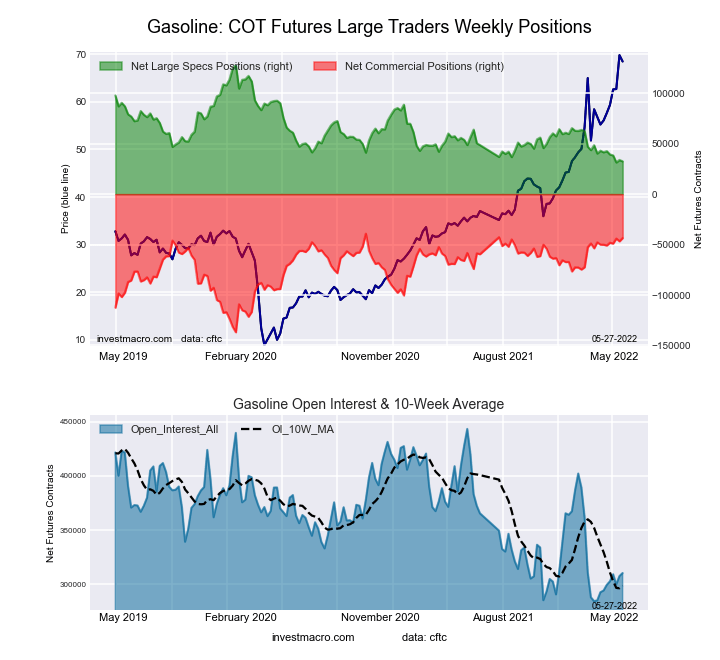 The Gasoline Blendstock Futures large speculator standing this week was a net position of 32,425 contracts in the data reported through Tuesday. This was a weekly decrease of -1,373 contracts from the previous week which had a total of 33,798 net contracts.
This week’s current strength score (the trader positioning range over the past three years, measured from 0 to 100) shows the speculators are currently Bearish-Extreme with a score of 3.1 percent. The commercials are Bullish-Extreme with a score of 93.4 percent and the small traders (not shown in chart) are Bullish-Extreme with a score of 87.1 percent.
| Nasdaq Mini Futures Statistics | SPECULATORS | COMMERCIALS | SMALL TRADERS |
| – Percent of Open Interest Longs: | 23.4 | 55.0 | 7.6 |
| – Percent of Open Interest Shorts: | 12.9 | 69.1 | 4.0 |
| – Net Position: | 32,425 | -43,599 | 11,174 |
| – Gross Longs: | 72,517 | 170,888 | 23,596 |
| – Gross Shorts: | 40,092 | 214,487 | 12,422 |
| – Long to Short Ratio: | 1.8 to 1 | 0.8 to 1 | 1.9 to 1 |
| NET POSITION TREND: | |||
| – Strength Index Score (3 Year Range Pct): | 3.1 | 93.4 | 87.1 |
| – Strength Index Reading (3 Year Range): | Bearish-Extreme | Bullish-Extreme | Bullish-Extreme |
| NET POSITION MOVEMENT INDEX: | |||
| – 6-Week Change in Strength Index: | -9.1 | 6.6 | 16.3 |
#2 Heating Oil NY-Harbor Futures:
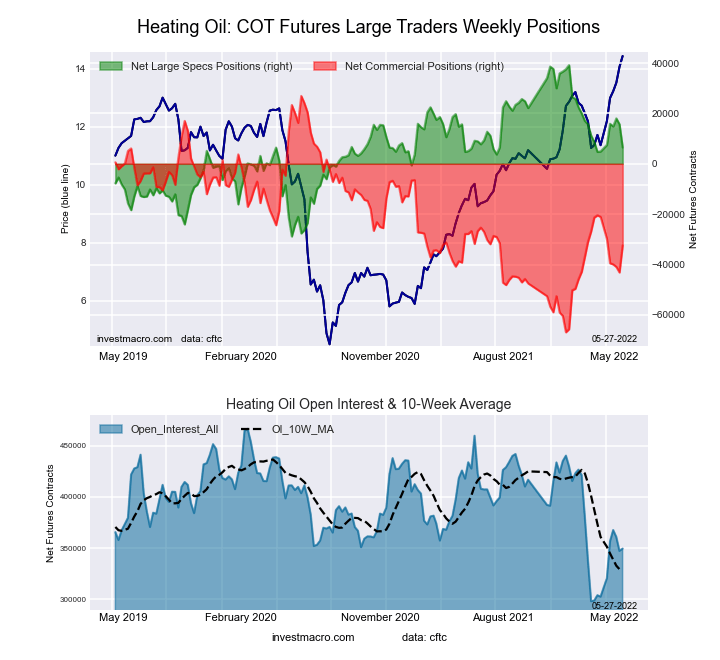 The #2 Heating Oil NY-Harbor Futures large speculator standing this week was a net position of 6,455 contracts in the data reported through Tuesday. This was a weekly lowering of -9,228 contracts from the previous week which had a total of 15,683 net contracts.
This week’s current strength score (the trader positioning range over the past three years, measured from 0 to 100) shows the speculators are currently Bullish with a score of 51.9 percent. The commercials are Bearish with a score of 36.7 percent and the small traders (not shown in chart) are Bullish-Extreme with a score of 88.4 percent.
| Heating Oil Futures Statistics | SPECULATORS | COMMERCIALS | SMALL TRADERS |
| – Percent of Open Interest Longs: | 17.0 | 50.8 | 14.4 |
| – Percent of Open Interest Shorts: | 15.1 | 60.1 | 6.9 |
| – Net Position: | 6,455 | -32,434 | 25,979 |
| – Gross Longs: | 59,340 | 177,626 | 50,210 |
| – Gross Shorts: | 52,885 | 210,060 | 24,231 |
| – Long to Short Ratio: | 1.1 to 1 | 0.8 to 1 | 2.1 to 1 |
| NET POSITION TREND: | |||
| – Strength Index Score (3 Year Range Pct): | 51.9 | 36.7 | 88.4 |
| – Strength Index Reading (3 Year Range): | Bullish | Bearish | Bullish-Extreme |
| NET POSITION MOVEMENT INDEX: | |||
| – 6-Week Change in Strength Index: | 4.2 | -10.3 | 23.6 |
Bloomberg Commodity Index Futures:
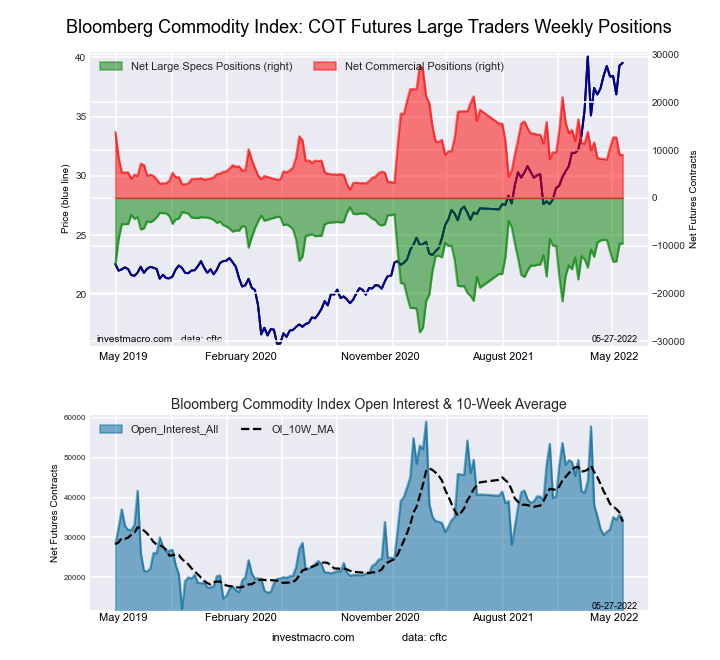 The Bloomberg Commodity Index Futures large speculator standing this week was a net position of -9,513 contracts in the data reported through Tuesday. This was a weekly gain of 126 contracts from the previous week which had a total of -9,639 net contracts.
This week’s current strength score (the trader positioning range over the past three years, measured from 0 to 100) shows the speculators are currently Bullish with a score of 71.1 percent. The commercials are Bearish with a score of 27.9 percent and the small traders (not shown in chart) are Bearish with a score of 37.4 percent.
| Bloomberg Index Futures Statistics | SPECULATORS | COMMERCIALS | SMALL TRADERS |
| – Percent of Open Interest Longs: | 65.8 | 26.2 | 1.8 |
| – Percent of Open Interest Shorts: | 93.5 | 0.0 | 0.4 |
| – Net Position: | -9,513 | 9,010 | 503 |
| – Gross Longs: | 22,645 | 9,010 | 636 |
| – Gross Shorts: | 32,158 | 0 | 133 |
| – Long to Short Ratio: | 0.7 to 1 | inf to 1 | 4.8 to 1 |
| NET POSITION TREND: | |||
| – Strength Index Score (3 Year Range Pct): | 71.1 | 27.9 | 37.4 |
| – Strength Index Reading (3 Year Range): | Bullish | Bearish | Bearish |
| NET POSITION MOVEMENT INDEX: | |||
| – 6-Week Change in Strength Index: | -2.8 | 3.4 | -5.5 |
Article By InvestMacro – Receive our weekly COT Reports by Email
*COT Report: The COT data, released weekly to the public each Friday, is updated through the most recent Tuesday (data is 3 days old) and shows a quick view of how large speculators or non-commercials (for-profit traders) were positioned in the futures markets.
The CFTC categorizes trader positions according to commercial hedgers (traders who use futures contracts for hedging as part of the business), non-commercials (large traders who speculate to realize trading profits) and nonreportable traders (usually small traders/speculators) as well as their open interest (contracts open in the market at time of reporting).See CFTC criteria here.

- Geopolitical and macroeconomic conditions continue to pressure market sentiment Jul 20, 2026
- USD/JPY Poised to Continue Gains as Expensive Oil and Lack of Support Weigh on Yen Jul 20, 2026
- COT Metals Charts: Weekly Speculator Bets led by Copper & Steel Jul 18, 2026
- COT Bonds Charts: Weekly Speculator Bets led by 2-Year, SOFR 3M & 5-Year Bonds Jul 18, 2026
- COT Energy Charts: Weekly Speculator Bets led by Brent Oil & Heating Oil Jul 18, 2026
- COT Soft Commodities Charts: Weekly Speculator Bets led by Wheat, Corn & Soybean Meal Jul 18, 2026
- The Bank of Canada kept its interest rate unchanged. Platinum prices reached a three‑week high Jul 16, 2026
- Stock indices rose after the release of US inflation data. China’s GDP slowed sharply Jul 15, 2026
- GBP/USD Awaits Political News: What Will Happen Next Jul 15, 2026
- USD/JPY Holds at Highs: Pressure Lingers on Yen Jul 14, 2026