
By InvestMacro | COT | Data Tables | COT Leaders | Downloads | COT Newsletter
Here are the latest charts and statistics for the Commitment of Traders (COT) data published by the Commodities Futures Trading Commission (CFTC).
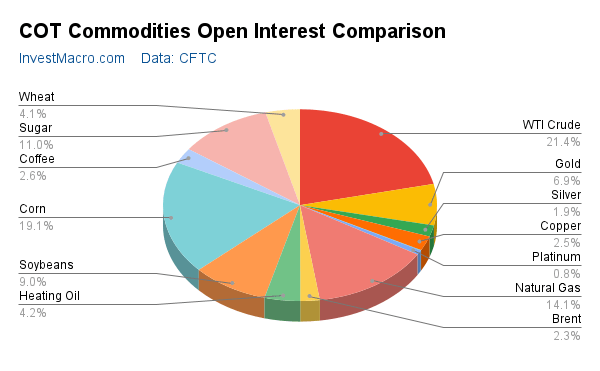
The latest COT data is updated through Tuesday April 12th and shows a quick view of how large traders (for-profit speculators and commercial entities) were positioned in the futures markets.
Highlighting the COT metals data is the recent declines in the Platinum futures bets. The speculative net position in Platinum futures has fallen for three consecutive weeks and in four out of the past five weeks. Speculator positions have dropped by a total of -19,418 contracts over those past five weeks and the current speculator standing has now decreased to the lowest level in the past thirteen weeks, dating back to November 11th. Despite a strong environment in general for commodities, Platinum speculator bets are under performing in 2022 with a weekly average of +13,284 contracts compared to weekly contract averages of +25,542 contracts in all of 2020 and +19,324 contracts in all of 2021. Overall, Platinum and Palladium (-2,033 net position this week) have been seeing weakness in their speculative positions as well as their prices compared to the other metals (Gold, Silver and Copper).
The metals markets with higher speculator bets this week were Silver (952 contracts), Gold (8,746 contracts) and Palladium (8 contracts) while the metals markets with declining speculator bets this week were Copper (-12,792 contracts) and Platinum (-4,875 contracts).
Free Reports:
 Sign Up for Our Stock Market Newsletter – Get updated on News, Charts & Rankings of Public Companies when you join our Stocks Newsletter
 Get our Weekly Commitment of Traders Reports - See where the biggest traders (Hedge Funds and Commercial Hedgers) are positioned in the futures markets on a weekly basis.
Speculator strength standings for each Commodity where strength index is current net position compared to past three years, above 80 is bullish extreme, below 20 is bearish extreme
OI Strength = Current Open Interest level compared to last 3 years range
Spec Strength = Current Net Speculator level compared to last 3 years range
Strength Move = Six week change of Spec Strength
| Apr-12-2022 | OI | OI-Index | Spec-Net | Spec-Index | Com-Net | COM-Index | Smalls-Net | Smalls-Index |
|---|---|---|---|---|---|---|---|---|
| WTI Crude | 1,783,725 | 0 | 304,778 | 0 | -350,603 | 100 | 45,825 | 80 |
| Gold | 577,639 | 40 | 254,287 | 69 | -288,093 | 30 | 33,806 | 60 |
| Silver | 158,813 | 24 | 45,986 | 68 | -63,690 | 36 | 17,704 | 46 |
| Copper | 204,825 | 30 | 23,350 | 59 | -29,249 | 39 | 5,899 | 59 |
| Palladium | 6,340 | 0 | -2,033 | 10 | 1,402 | 84 | 631 | 80 |
| Platinum | 63,363 | 27 | 6,415 | 11 | -13,233 | 90 | 6,818 | 57 |
| Natural Gas | 1,170,828 | 20 | -137,549 | 37 | 90,221 | 59 | 47,328 | 99 |
| Brent | 190,488 | 32 | -36,318 | 50 | 33,933 | 50 | 2,385 | 41 |
| Heating Oil | 349,618 | 31 | 6,455 | 52 | -32,434 | 37 | 25,979 | 88 |
| Soybeans | 752,157 | 34 | 198,295 | 79 | -170,694 | 26 | -27,601 | 24 |
| Corn | 1,589,848 | 36 | 495,581 | 93 | -443,706 | 9 | -51,875 | 13 |
| Coffee | 214,938 | 0 | 47,929 | 83 | -52,716 | 19 | 4,787 | 24 |
| Sugar | 916,130 | 23 | 239,864 | 86 | -301,628 | 11 | 61,764 | 84 |
| Wheat | 338,271 | 1 | 23,886 | 67 | -21,258 | 20 | -2,628 | 99 |
Gold Comex Futures:
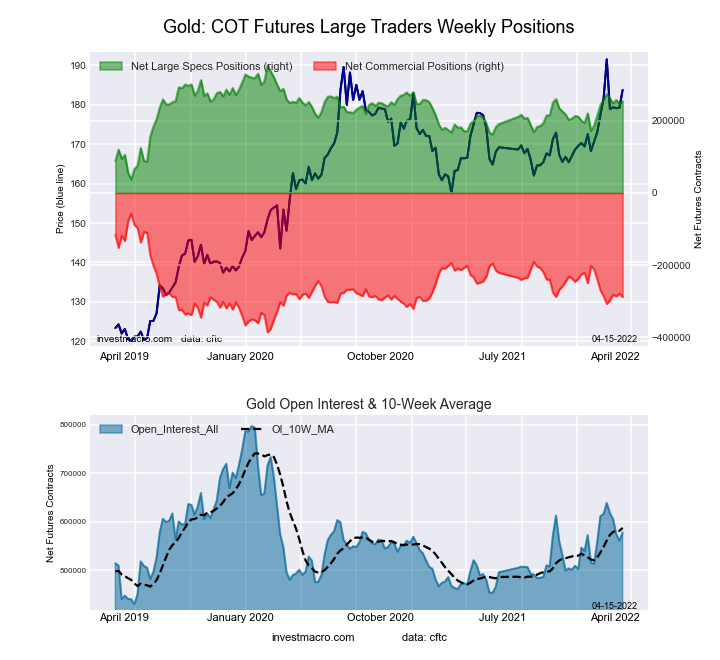 The Gold Comex Futures large speculator standing this week equaled a net position of 254,287 contracts in the data reported through Tuesday. This was a weekly lift of 8,746 contracts from the previous week which had a total of 245,541 net contracts.
This week’s current strength score (the trader positioning range over the past three years, measured from 0 to 100) shows the speculators are currently Bullish with a score of 68.6 percent. The commercials are Bearish with a score of 29.7 percent and the small traders (not shown in chart) are Bullish with a score of 60.1 percent.
| Gold Futures Statistics | SPECULATORS | COMMERCIALS | SMALL TRADERS |
| – Percent of Open Interest Longs: | 58.5 | 21.7 | 9.6 |
| – Percent of Open Interest Shorts: | 14.5 | 71.6 | 3.7 |
| – Net Position: | 254,287 | -288,093 | 33,806 |
| – Gross Longs: | 338,164 | 125,627 | 55,264 |
| – Gross Shorts: | 83,877 | 413,720 | 21,458 |
| – Long to Short Ratio: | 4.0 to 1 | 0.3 to 1 | 2.6 to 1 |
| NET POSITION TREND: | |||
| – Strength Index Score (3 Year Range Pct): | 68.6 | 29.7 | 60.1 |
| – Strength Index Reading (3 Year Range): | Bullish | Bearish | Bullish |
| NET POSITION MOVEMENT INDEX: | |||
| – 6-Week Change in Strength Index: | -1.1 | -0.7 | 16.0 |
Silver Comex Futures:
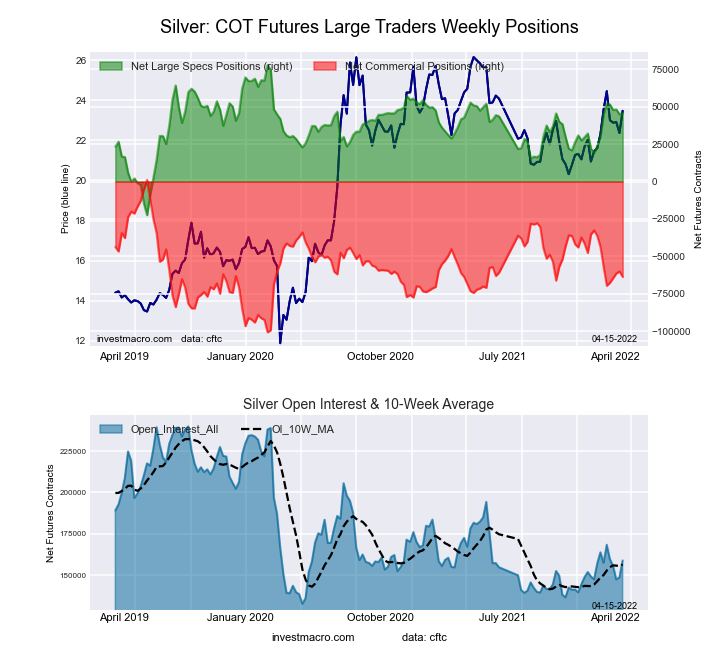 The Silver Comex Futures large speculator standing this week equaled a net position of 45,986 contracts in the data reported through Tuesday. This was a weekly lift of 952 contracts from the previous week which had a total of 45,034 net contracts.
This week’s current strength score (the trader positioning range over the past three years, measured from 0 to 100) shows the speculators are currently Bullish with a score of 68.2 percent. The commercials are Bearish with a score of 36.4 percent and the small traders (not shown in chart) are Bearish with a score of 46.0 percent.
| Silver Futures Statistics | SPECULATORS | COMMERCIALS | SMALL TRADERS |
| – Percent of Open Interest Longs: | 41.8 | 32.2 | 18.8 |
| – Percent of Open Interest Shorts: | 12.8 | 72.3 | 7.7 |
| – Net Position: | 45,986 | -63,690 | 17,704 |
| – Gross Longs: | 66,356 | 51,139 | 29,877 |
| – Gross Shorts: | 20,370 | 114,829 | 12,173 |
| – Long to Short Ratio: | 3.3 to 1 | 0.4 to 1 | 2.5 to 1 |
| NET POSITION TREND: | |||
| – Strength Index Score (3 Year Range Pct): | 68.2 | 36.4 | 46.0 |
| – Strength Index Reading (3 Year Range): | Bullish | Bearish | Bearish |
| NET POSITION MOVEMENT INDEX: | |||
| – 6-Week Change in Strength Index: | 1.0 | -6.4 | 32.0 |
Copper Grade #1 Futures:
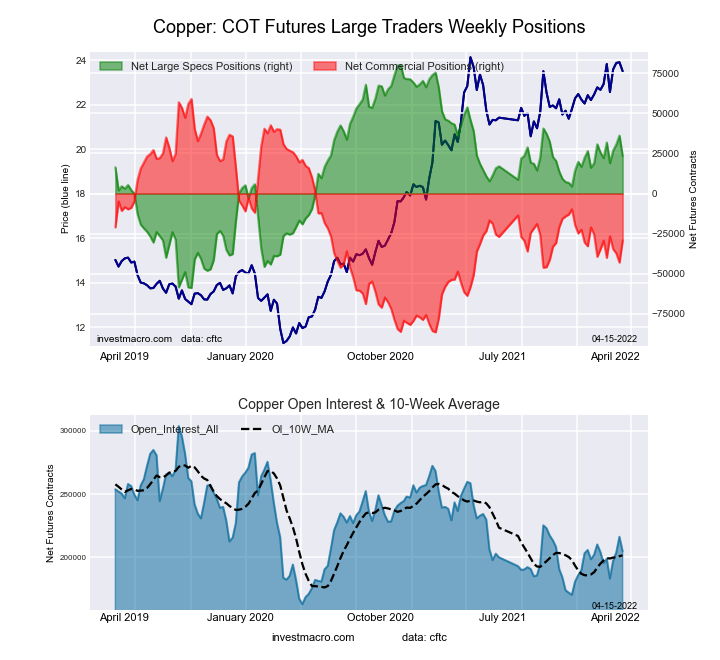 The Copper Grade #1 Futures large speculator standing this week equaled a net position of 23,350 contracts in the data reported through Tuesday. This was a weekly decline of -12,792 contracts from the previous week which had a total of 36,142 net contracts.
This week’s current strength score (the trader positioning range over the past three years, measured from 0 to 100) shows the speculators are currently Bullish with a score of 59.2 percent. The commercials are Bearish with a score of 39.4 percent and the small traders (not shown in chart) are Bullish with a score of 59.4 percent.
| Copper Futures Statistics | SPECULATORS | COMMERCIALS | SMALL TRADERS |
| – Percent of Open Interest Longs: | 40.0 | 39.8 | 8.8 |
| – Percent of Open Interest Shorts: | 28.6 | 54.1 | 5.9 |
| – Net Position: | 23,350 | -29,249 | 5,899 |
| – Gross Longs: | 81,940 | 81,559 | 17,972 |
| – Gross Shorts: | 58,590 | 110,808 | 12,073 |
| – Long to Short Ratio: | 1.4 to 1 | 0.7 to 1 | 1.5 to 1 |
| NET POSITION TREND: | |||
| – Strength Index Score (3 Year Range Pct): | 59.2 | 39.4 | 59.4 |
| – Strength Index Reading (3 Year Range): | Bullish | Bearish | Bullish |
| NET POSITION MOVEMENT INDEX: | |||
| – 6-Week Change in Strength Index: | 0.9 | 0.1 | -8.0 |
Platinum Futures:
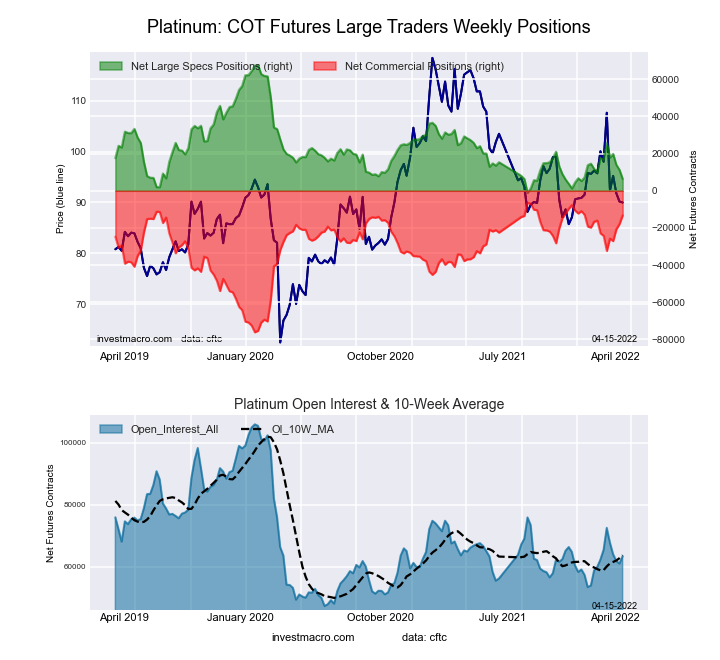 The Platinum Futures large speculator standing this week equaled a net position of 6,415 contracts in the data reported through Tuesday. This was a weekly decline of -4,875 contracts from the previous week which had a total of 11,290 net contracts.
This week’s current strength score (the trader positioning range over the past three years, measured from 0 to 100) shows the speculators are currently Bearish-Extreme with a score of 10.9 percent. The commercials are Bullish-Extreme with a score of 90.1 percent and the small traders (not shown in chart) are Bullish with a score of 57.2 percent.
| Platinum Futures Statistics | SPECULATORS | COMMERCIALS | SMALL TRADERS |
| – Percent of Open Interest Longs: | 45.0 | 34.0 | 16.5 |
| – Percent of Open Interest Shorts: | 34.9 | 54.9 | 5.7 |
| – Net Position: | 6,415 | -13,233 | 6,818 |
| – Gross Longs: | 28,544 | 21,537 | 10,461 |
| – Gross Shorts: | 22,129 | 34,770 | 3,643 |
| – Long to Short Ratio: | 1.3 to 1 | 0.6 to 1 | 2.9 to 1 |
| NET POSITION TREND: | |||
| – Strength Index Score (3 Year Range Pct): | 10.9 | 90.1 | 57.2 |
| – Strength Index Reading (3 Year Range): | Bearish-Extreme | Bullish-Extreme | Bullish |
| NET POSITION MOVEMENT INDEX: | |||
| – 6-Week Change in Strength Index: | -15.3 | 15.7 | -6.8 |
Palladium Futures:
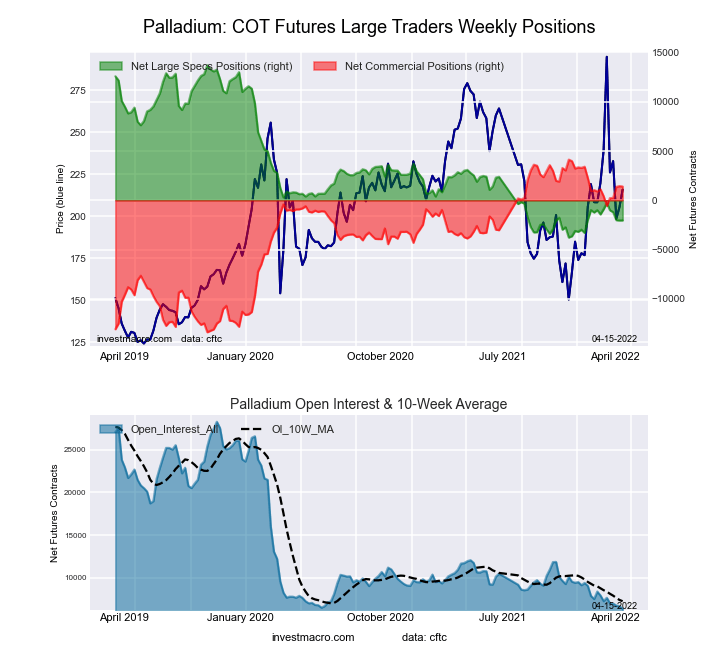 The Palladium Futures large speculator standing this week equaled a net position of -2,033 contracts in the data reported through Tuesday. This was a weekly gain of 8 contracts from the previous week which had a total of -2,041 net contracts.
This week’s current strength score (the trader positioning range over the past three years, measured from 0 to 100) shows the speculators are currently Bearish-Extreme with a score of 10.0 percent. The commercials are Bullish-Extreme with a score of 84.5 percent and the small traders (not shown in chart) are Bullish-Extreme with a score of 80.4 percent.
| Palladium Futures Statistics | SPECULATORS | COMMERCIALS | SMALL TRADERS |
| – Percent of Open Interest Longs: | 26.1 | 51.6 | 21.7 |
| – Percent of Open Interest Shorts: | 58.1 | 29.5 | 11.7 |
| – Net Position: | -2,033 | 1,402 | 631 |
| – Gross Longs: | 1,653 | 3,273 | 1,374 |
| – Gross Shorts: | 3,686 | 1,871 | 743 |
| – Long to Short Ratio: | 0.4 to 1 | 1.7 to 1 | 1.8 to 1 |
| NET POSITION TREND: | |||
| – Strength Index Score (3 Year Range Pct): | 10.0 | 84.5 | 80.4 |
| – Strength Index Reading (3 Year Range): | Bearish-Extreme | Bullish-Extreme | Bullish-Extreme |
| NET POSITION MOVEMENT INDEX: | |||
| – 6-Week Change in Strength Index: | -6.5 | 5.6 | 8.7 |
Article By InvestMacro – Receive our weekly COT Reports by Email
*COT Report: The COT data, released weekly to the public each Friday, is updated through the most recent Tuesday (data is 3 days old) and shows a quick view of how large speculators or non-commercials (for-profit traders) were positioned in the futures markets.
The CFTC categorizes trader positions according to commercial hedgers (traders who use futures contracts for hedging as part of the business), non-commercials (large traders who speculate to realize trading profits) and nonreportable traders (usually small traders/speculators) as well as their open interest (contracts open in the market at time of reporting).See CFTC criteria here.

- COT Metals Charts: Weekly Speculator Bets led by Copper & Steel Jul 18, 2026
- COT Bonds Charts: Weekly Speculator Bets led by 2-Year, SOFR 3M & 5-Year Bonds Jul 18, 2026
- COT Energy Charts: Weekly Speculator Bets led by Brent Oil & Heating Oil Jul 18, 2026
- COT Soft Commodities Charts: Weekly Speculator Bets led by Wheat, Corn & Soybean Meal Jul 18, 2026
- The Bank of Canada kept its interest rate unchanged. Platinum prices reached a three‑week high Jul 16, 2026
- Stock indices rose after the release of US inflation data. China’s GDP slowed sharply Jul 15, 2026
- GBP/USD Awaits Political News: What Will Happen Next Jul 15, 2026
- USD/JPY Holds at Highs: Pressure Lingers on Yen Jul 14, 2026
- Oil prices jumped 4% amid a new wave of escalation between the US and Iran Jul 13, 2026
- EUR/USD: US Inflation Will Determine Everything Jul 13, 2026