By Ino.com
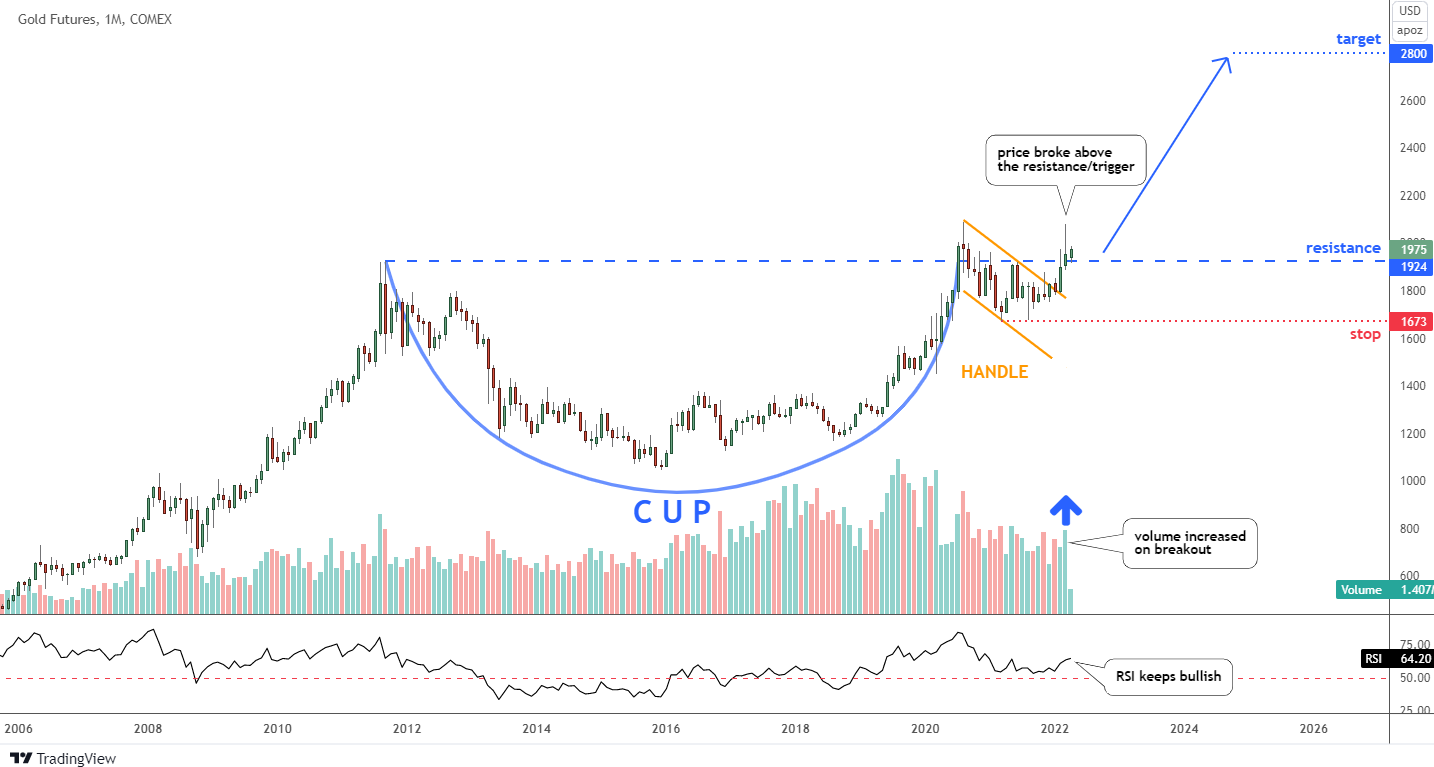
– Back in February, I shared with you an updated monthly chart of gold futures with a completed Cup & Handle pattern just ahead of a potential breakout above the preset trigger.
Most readers supported the ambitious target of $2,800 for that exact pattern. So let’s check on the chart below and see how it plays out these days.
Indeed, the bullish impulse gathered enough power to break above the resistance that acted as a trigger for this pattern. The volume increased significantly, as it was required to overcome the barrier and confirm the breakout. The RSI has supported that rally as it turned north, either.
The candle of March has a long upper shadow as the price of gold failed to crack the all-time high of $2,089 despite a strong rally. It stopped just ten dollars away at $2,079; then the price dropped like a rock losing almost two hundred bucks to $1,888. However, the metal has managed to close that month in green at $1,954, still above the trigger of $1,924.
Free Reports:
The current month of April has a bullish candle on the price chart, and the RSI keeps above the support. The odds are still in favor of bulls, and the following chart with a lower time frame supports that outlook.
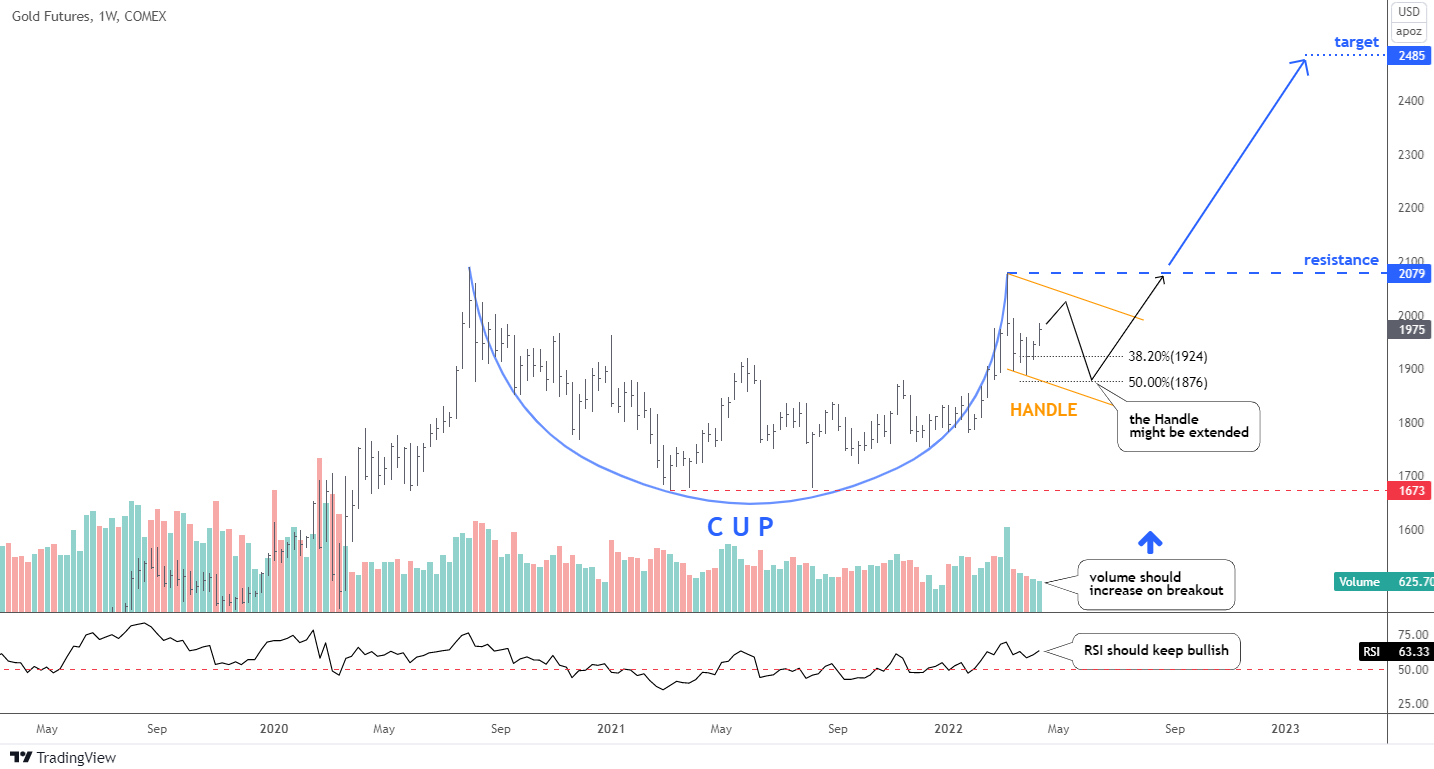
You might have thought that you have already seen this chart with the same pattern before. However, this is a brand new chart with a weekly period. One thing has been repeated for sure, the Cup & Handle bullish pattern. On the monthly chart above, this part looks smaller. It is located on the right side after the Cup.
This Cup (blue) has an almost ideal shape, as its tops are located in the same price area. The Handle (orange) has dipped to the regular Fibonacci retracement levels between 38.2 ($1,924) and 50 ($1,876) percent. This part might be extended as I highlighted it within a black zigzag. However, it should not drop too deep into the area of the Cup not to invalidate it.
The bullish trigger has been set at the most recent top of $2,079. The upside target for this smaller pattern is located closer indeed at $2,485, which is still awesome. It was calculated by adding the depth of the Cup to the breakout point (resistance).
The volume is in the valley part of the range, and it should grow significantly when the price of gold would come first for a breakout above the Handle and then to overcome the resistance.
The RSI indicator should stay above the “waterline” to support bulls.
Intelligent trades!
Aibek Burabayev
INO.com Contributor, Metals
Disclosure: This contributor has no positions in any stocks mentioned in this article. This article is the opinion of the contributor themselves. The above is a matter of opinion provided for general information purposes only and is not intended as investment advice. This contributor is not receiving compensation (other than from INO.com) for their opinion.
By Ino.com – See our Trader Blog, INO TV Free & Market Analysis Alerts
Source: Gold Has Repeated Bullish Pattern
By Analytical Department RoboForex Gold fell to 4,033 USD per ounce on Thursday, extending its…
By JustMarkets By the end of the day, the Dow Jones Index (US30) rose by…
By JustMarkets On Tuesday, the US stock indices finished the session in the green, supported…
By Analytical Department RoboForex GBP/USD rose to 1.3403 on Wednesday, with British politics taking centre…
By Analytical Department RoboForex USD/JPY ended Tuesday at 162.27, with the Japanese yen remaining near…
By JustMarkets On Friday, the Dow Jones Index (US30) rose by 0.29% (weekly: -0.36%). The…
This website uses cookies.