
By InvestMacro | COT | Data Tables | COT Leaders | Downloads | COT Newsletter
Here are the latest charts and statistics for the Commitment of Traders (COT) data published by the Commodities Futures Trading Commission (CFTC).
The latest COT data is updated through Tuesday April 5th and shows a quick view of how large traders (for-profit speculators and commercial entities) were positioned in the futures markets.
Highlighting the COT soft commodities data is the jump in this week’s Sugar futures bets. The speculative net position in the Sugar futures rose by the largest one-week amount (+26,966 contracts) over the last four weeks and bullish bets have gained for two straight weeks. Sugar positions have also risen in six out of the past seven weeks with a total gain of +113,984 contracts over that time-frame. This recent speculator strength has pushed the current net standing (+188,547 contracts) to the highest level in the last fifteen weeks, dating back to December 21st. The strength index for Sugar is not yet in an extreme bullish score with the current score at 75.4 percent but the strength score has seen a change of 23.3 percent over the past six weeks (speculator strength index is current speculator standing compared to past three years, above 80 is bullish extreme, below 20 is bearish extreme). Sugar prices have been on a renewed uptrend (after a drop under the 200-day moving average in January to early March) and closed this week at the highest level since November.
The soft commodities that saw higher bets this week were Corn (4,981 contracts), Sugar (26,966 contracts), Coffee (5,122 contracts), Soybean Oil (2,212 contracts), Soybean Meal (1,993 contracts), Cotton (150 contracts) and Wheat (6,392 contracts).
The market that had declining speculator bets were Soybeans (-7,545 contracts), Live Cattle (-3,678 contracts), Lean Hogs (-7,694 contracts) and Cocoa (-3,040 contracts).
Free Reports:
 Download Our Metatrader 4 Indicators – Put Our Free MetaTrader 4 Custom Indicators on your charts when you join our Weekly Newsletter
 Get our Weekly Commitment of Traders Reports - See where the biggest traders (Hedge Funds and Commercial Hedgers) are positioned in the futures markets on a weekly basis.
| Apr-05-2022 | OI | OI-Index | Spec-Net | Spec-Index | Com-Net | COM-Index | Smalls-Net | Smalls-Index |
|---|---|---|---|---|---|---|---|---|
| WTI Crude | 1,823,366 | 5 | 308,594 | 0 | -355,435 | 100 | 46,841 | 81 |
| Gold | 560,666 | 36 | 245,541 | 66 | -278,758 | 33 | 33,217 | 58 |
| Silver | 148,526 | 15 | 45,034 | 67 | -60,036 | 40 | 15,002 | 30 |
| Copper | 216,157 | 38 | 36,142 | 68 | -43,039 | 30 | 6,897 | 65 |
| Palladium | 6,642 | 1 | -2,041 | 10 | 1,443 | 85 | 598 | 78 |
| Platinum | 60,983 | 23 | 11,290 | 18 | -17,905 | 83 | 6,615 | 54 |
| Natural Gas | 1,169,620 | 19 | -136,611 | 38 | 92,647 | 60 | 43,964 | 90 |
| Brent | 189,394 | 31 | -29,712 | 61 | 26,537 | 37 | 3,175 | 52 |
| Heating Oil | 349,618 | 31 | 6,455 | 52 | -32,434 | 37 | 25,979 | 88 |
| Soybeans | 756,785 | 35 | 198,924 | 79 | -170,882 | 26 | -28,042 | 24 |
| Corn | 1,556,206 | 30 | 487,073 | 92 | -424,154 | 12 | -62,919 | 7 |
| Coffee | 226,730 | 5 | 43,811 | 80 | -48,758 | 22 | 4,947 | 23 |
| Sugar | 859,871 | 10 | 188,547 | 75 | -240,107 | 23 | 51,560 | 72 |
| Wheat | 344,615 | 5 | 19,951 | 64 | -15,332 | 26 | -4,619 | 89 |
CORN Futures:
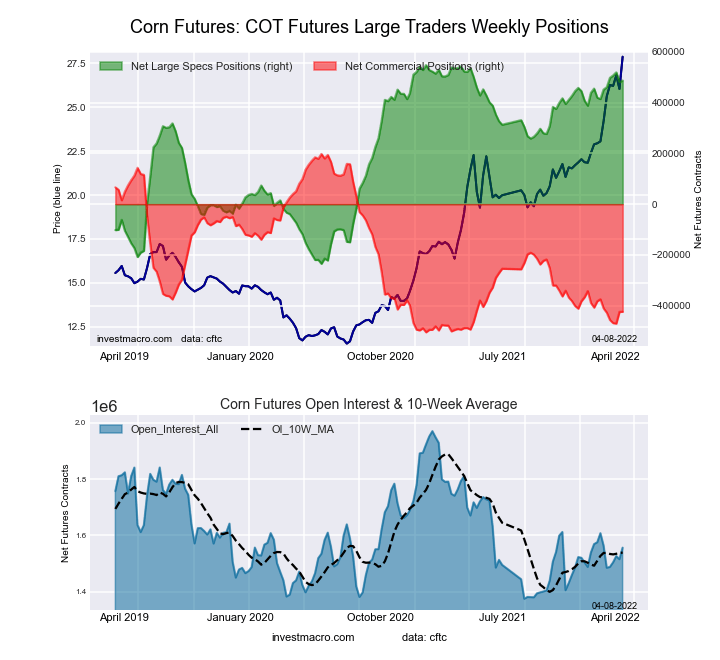 The CORN large speculator standing this week reached a net position of 487,073 contracts in the data reported through Tuesday. This was a weekly rise of 4,981 contracts from the previous week which had a total of 482,092 net contracts.
This week’s current strength score (the trader positioning range over the past three years, measured from 0 to 100) shows the speculators are currently Bullish-Extreme with a score of 92.3 percent. The commercials are Bearish-Extreme with a score of 11.5 percent and the small traders (not shown in chart) are Bearish-Extreme with a score of 6.8 percent.
| CORN Futures Statistics | SPECULATORS | COMMERCIALS | SMALL TRADERS |
| – Percent of Open Interest Longs: | 35.9 | 45.4 | 9.0 |
| – Percent of Open Interest Shorts: | 4.6 | 72.7 | 13.0 |
| – Net Position: | 487,073 | -424,154 | -62,919 |
| – Gross Longs: | 558,043 | 706,995 | 139,773 |
| – Gross Shorts: | 70,970 | 1,131,149 | 202,692 |
| – Long to Short Ratio: | 7.9 to 1 | 0.6 to 1 | 0.7 to 1 |
| NET POSITION TREND: | |||
| – Strength Index Score (3 Year Range Pct): | 92.3 | 11.5 | 6.8 |
| – Strength Index Reading (3 Year Range): | Bullish-Extreme | Bearish-Extreme | Bearish-Extreme |
| NET POSITION MOVEMENT INDEX: | |||
| – 6-Week Change in Strength Index: | 4.5 | -1.9 | -12.7 |
SUGAR Futures:
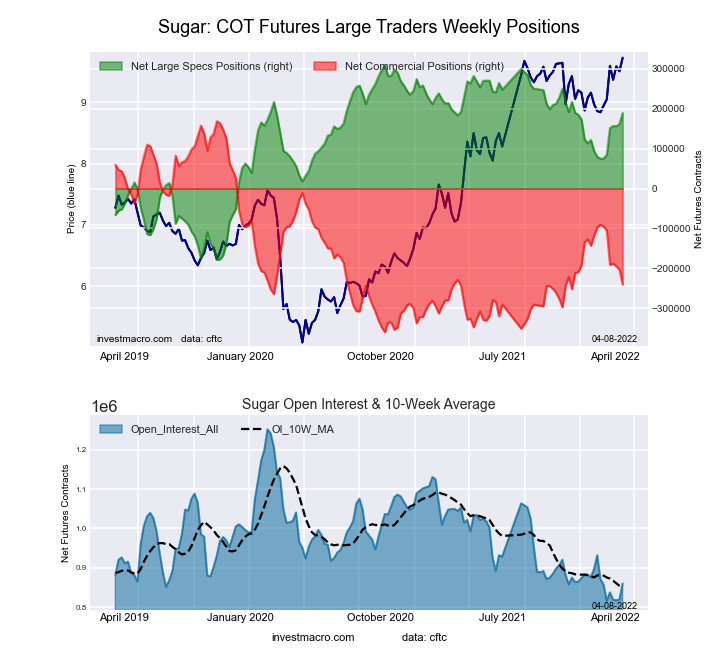 The SUGAR large speculator standing this week reached a net position of 188,547 contracts in the data reported through Tuesday. This was a weekly gain of 26,966 contracts from the previous week which had a total of 161,581 net contracts.
This week’s current strength score (the trader positioning range over the past three years, measured from 0 to 100) shows the speculators are currently Bullish with a score of 75.4 percent. The commercials are Bearish with a score of 22.6 percent and the small traders (not shown in chart) are Bullish with a score of 71.6 percent.
| SUGAR Futures Statistics | SPECULATORS | COMMERCIALS | SMALL TRADERS |
| – Percent of Open Interest Longs: | 28.3 | 47.1 | 12.1 |
| – Percent of Open Interest Shorts: | 6.3 | 75.0 | 6.1 |
| – Net Position: | 188,547 | -240,107 | 51,560 |
| – Gross Longs: | 243,133 | 404,728 | 103,751 |
| – Gross Shorts: | 54,586 | 644,835 | 52,191 |
| – Long to Short Ratio: | 4.5 to 1 | 0.6 to 1 | 2.0 to 1 |
| NET POSITION TREND: | |||
| – Strength Index Score (3 Year Range Pct): | 75.4 | 22.6 | 71.6 |
| – Strength Index Reading (3 Year Range): | Bullish | Bearish | Bullish |
| NET POSITION MOVEMENT INDEX: | |||
| – 6-Week Change in Strength Index: | 23.3 | -27.4 | 38.9 |
COFFEE Futures:
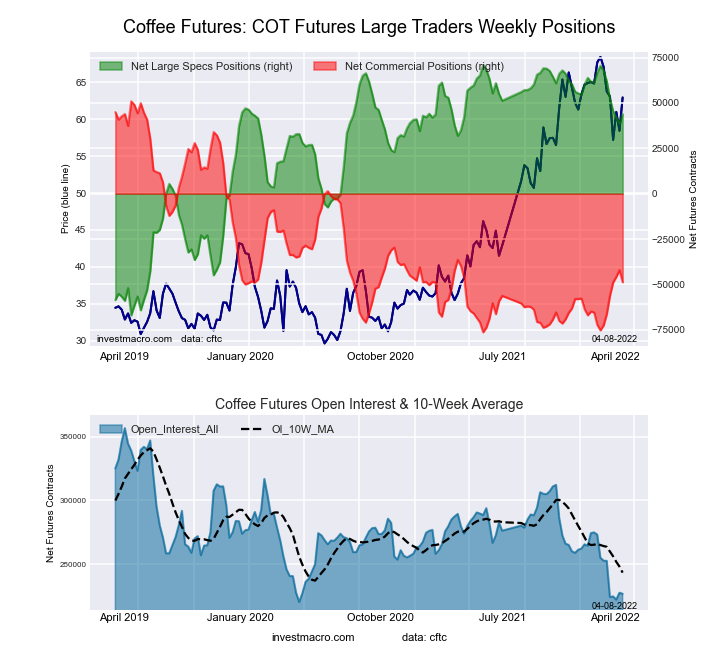 The COFFEE large speculator standing this week reached a net position of 43,811 contracts in the data reported through Tuesday. This was a weekly boost of 5,122 contracts from the previous week which had a total of 38,689 net contracts.
This week’s current strength score (the trader positioning range over the past three years, measured from 0 to 100) shows the speculators are currently Bullish-Extreme with a score of 80.4 percent. The commercials are Bearish with a score of 21.7 percent and the small traders (not shown in chart) are Bearish with a score of 22.6 percent.
| COFFEE Futures Statistics | SPECULATORS | COMMERCIALS | SMALL TRADERS |
| – Percent of Open Interest Longs: | 23.3 | 51.3 | 4.7 |
| – Percent of Open Interest Shorts: | 4.0 | 72.9 | 2.5 |
| – Net Position: | 43,811 | -48,758 | 4,947 |
| – Gross Longs: | 52,923 | 116,418 | 10,552 |
| – Gross Shorts: | 9,112 | 165,176 | 5,605 |
| – Long to Short Ratio: | 5.8 to 1 | 0.7 to 1 | 1.9 to 1 |
| NET POSITION TREND: | |||
| – Strength Index Score (3 Year Range Pct): | 80.4 | 21.7 | 22.6 |
| – Strength Index Reading (3 Year Range): | Bullish-Extreme | Bearish | Bearish |
| NET POSITION MOVEMENT INDEX: | |||
| – 6-Week Change in Strength Index: | -17.4 | 18.7 | 1.6 |
SOYBEANS Futures:
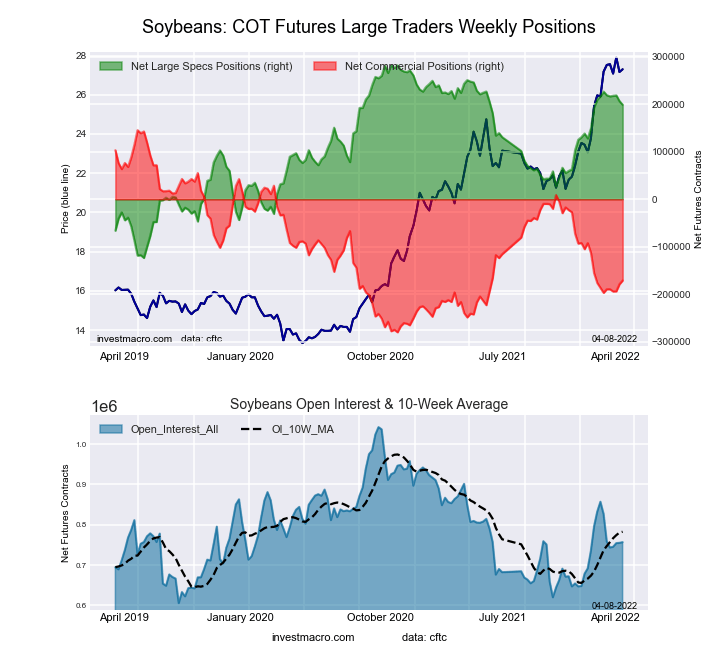 The SOYBEANS large speculator standing this week reached a net position of 198,924 contracts in the data reported through Tuesday. This was a weekly lowering of -7,545 contracts from the previous week which had a total of 206,469 net contracts.
This week’s current strength score (the trader positioning range over the past three years, measured from 0 to 100) shows the speculators are currently Bullish with a score of 79.5 percent. The commercials are Bearish with a score of 25.6 percent and the small traders (not shown in chart) are Bearish with a score of 23.7 percent.
| SOYBEANS Futures Statistics | SPECULATORS | COMMERCIALS | SMALL TRADERS |
| – Percent of Open Interest Longs: | 32.2 | 46.4 | 7.1 |
| – Percent of Open Interest Shorts: | 5.9 | 69.0 | 10.8 |
| – Net Position: | 198,924 | -170,882 | -28,042 |
| – Gross Longs: | 243,805 | 351,388 | 53,363 |
| – Gross Shorts: | 44,881 | 522,270 | 81,405 |
| – Long to Short Ratio: | 5.4 to 1 | 0.7 to 1 | 0.7 to 1 |
| NET POSITION TREND: | |||
| – Strength Index Score (3 Year Range Pct): | 79.5 | 25.6 | 23.7 |
| – Strength Index Reading (3 Year Range): | Bullish | Bearish | Bearish |
| NET POSITION MOVEMENT INDEX: | |||
| – 6-Week Change in Strength Index: | -6.8 | 6.1 | 2.8 |
SOYBEAN OIL Futures:
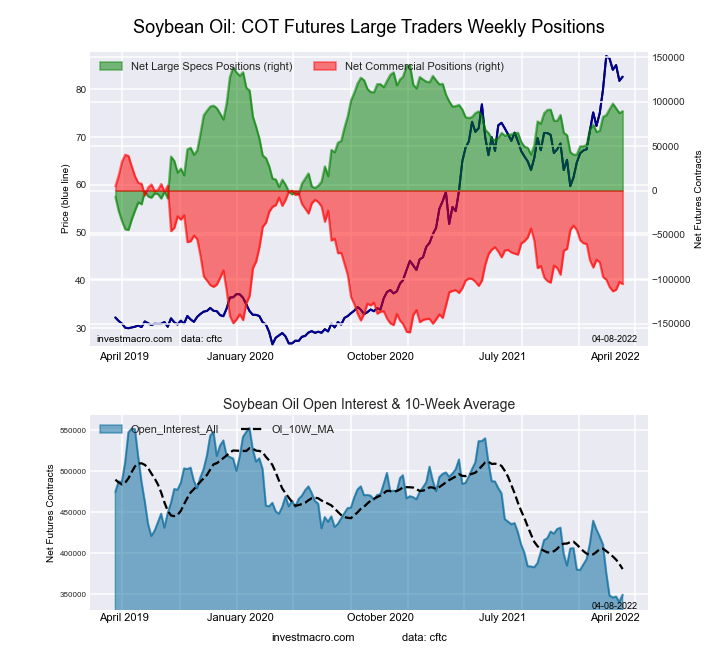 The SOYBEAN OIL large speculator standing this week reached a net position of 89,496 contracts in the data reported through Tuesday. This was a weekly rise of 2,212 contracts from the previous week which had a total of 87,284 net contracts.
This week’s current strength score (the trader positioning range over the past three years, measured from 0 to 100) shows the speculators are currently Bullish with a score of 72.1 percent. The commercials are Bearish with a score of 27.2 percent and the small traders (not shown in chart) are Bullish with a score of 72.0 percent.
| SOYBEAN OIL Futures Statistics | SPECULATORS | COMMERCIALS | SMALL TRADERS |
| – Percent of Open Interest Longs: | 30.5 | 48.0 | 9.8 |
| – Percent of Open Interest Shorts: | 4.9 | 78.1 | 5.3 |
| – Net Position: | 89,496 | -105,183 | 15,687 |
| – Gross Longs: | 106,458 | 167,920 | 34,352 |
| – Gross Shorts: | 16,962 | 273,103 | 18,665 |
| – Long to Short Ratio: | 6.3 to 1 | 0.6 to 1 | 1.8 to 1 |
| NET POSITION TREND: | |||
| – Strength Index Score (3 Year Range Pct): | 72.1 | 27.2 | 72.0 |
| – Strength Index Reading (3 Year Range): | Bullish | Bearish | Bullish |
| NET POSITION MOVEMENT INDEX: | |||
| – 6-Week Change in Strength Index: | 3.5 | -4.0 | 5.6 |
SOYBEAN MEAL Futures:
 The SOYBEAN MEAL large speculator standing this week reached a net position of 123,778 contracts in the data reported through Tuesday. This was a weekly gain of 1,993 contracts from the previous week which had a total of 121,785 net contracts.
This week’s current strength score (the trader positioning range over the past three years, measured from 0 to 100) shows the speculators are currently Bullish-Extreme with a score of 96.4 percent. The commercials are Bearish-Extreme with a score of 2.9 percent and the small traders (not shown in chart) are Bullish-Extreme with a score of 91.4 percent.
| SOYBEAN MEAL Futures Statistics | SPECULATORS | COMMERCIALS | SMALL TRADERS |
| – Percent of Open Interest Longs: | 34.0 | 41.1 | 12.4 |
| – Percent of Open Interest Shorts: | 3.0 | 79.7 | 4.8 |
| – Net Position: | 123,778 | -154,006 | 30,228 |
| – Gross Longs: | 135,750 | 164,226 | 49,339 |
| – Gross Shorts: | 11,972 | 318,232 | 19,111 |
| – Long to Short Ratio: | 11.3 to 1 | 0.5 to 1 | 2.6 to 1 |
| NET POSITION TREND: | |||
| – Strength Index Score (3 Year Range Pct): | 96.4 | 2.9 | 91.4 |
| – Strength Index Reading (3 Year Range): | Bullish-Extreme | Bearish-Extreme | Bullish-Extreme |
| NET POSITION MOVEMENT INDEX: | |||
| – 6-Week Change in Strength Index: | 6.5 | -8.1 | 16.1 |
LIVE CATTLE Futures:
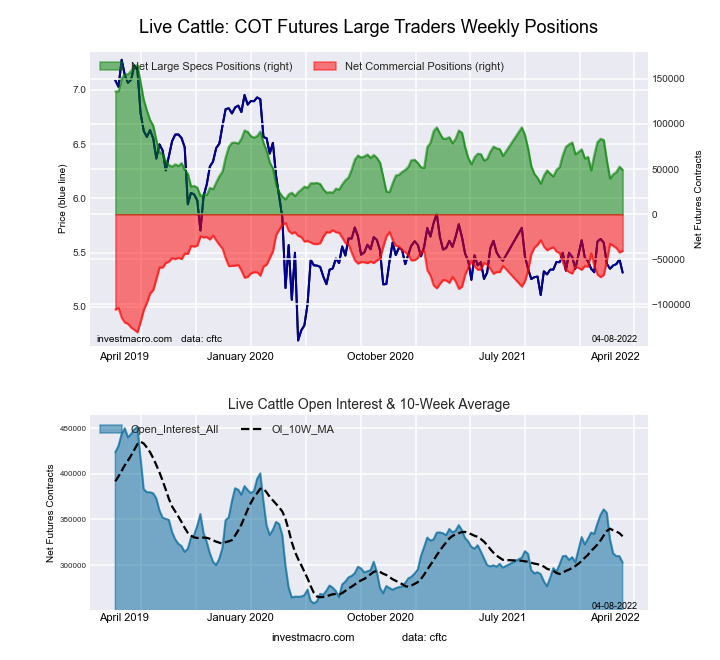 The LIVE CATTLE large speculator standing this week reached a net position of 49,067 contracts in the data reported through Tuesday. This was a weekly decrease of -3,678 contracts from the previous week which had a total of 52,745 net contracts.
This week’s current strength score (the trader positioning range over the past three years, measured from 0 to 100) shows the speculators are currently Bearish with a score of 21.9 percent. The commercials are Bullish with a score of 74.5 percent and the small traders (not shown in chart) are Bullish with a score of 66.6 percent.
| LIVE CATTLE Futures Statistics | SPECULATORS | COMMERCIALS | SMALL TRADERS |
| – Percent of Open Interest Longs: | 35.2 | 42.5 | 10.5 |
| – Percent of Open Interest Shorts: | 19.0 | 56.0 | 13.3 |
| – Net Position: | 49,067 | -40,653 | -8,414 |
| – Gross Longs: | 106,515 | 128,739 | 31,770 |
| – Gross Shorts: | 57,448 | 169,392 | 40,184 |
| – Long to Short Ratio: | 1.9 to 1 | 0.8 to 1 | 0.8 to 1 |
| NET POSITION TREND: | |||
| – Strength Index Score (3 Year Range Pct): | 21.9 | 74.5 | 66.6 |
| – Strength Index Reading (3 Year Range): | Bearish | Bullish | Bullish |
| NET POSITION MOVEMENT INDEX: | |||
| – 6-Week Change in Strength Index: | -22.3 | 22.0 | 16.0 |
LEAN HOGS Futures:
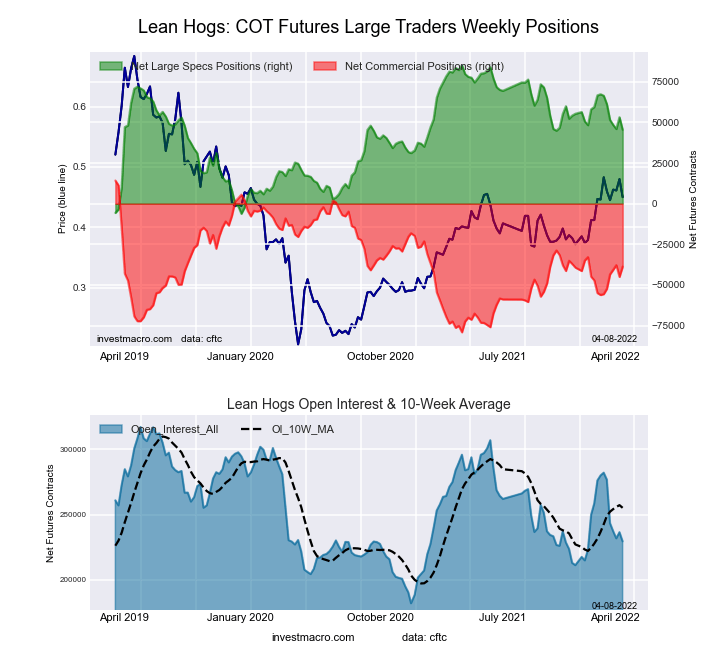 The LEAN HOGS large speculator standing this week reached a net position of 45,500 contracts in the data reported through Tuesday. This was a weekly lowering of -7,694 contracts from the previous week which had a total of 53,194 net contracts.
This week’s current strength score (the trader positioning range over the past three years, measured from 0 to 100) shows the speculators are currently Bullish with a score of 56.3 percent. The commercials are Bearish with a score of 47.7 percent and the small traders (not shown in chart) are Bullish with a score of 59.6 percent.
| LEAN HOGS Futures Statistics | SPECULATORS | COMMERCIALS | SMALL TRADERS |
| – Percent of Open Interest Longs: | 38.1 | 34.8 | 9.8 |
| – Percent of Open Interest Shorts: | 18.2 | 51.7 | 12.8 |
| – Net Position: | 45,500 | -38,745 | -6,755 |
| – Gross Longs: | 87,387 | 80,016 | 22,547 |
| – Gross Shorts: | 41,887 | 118,761 | 29,302 |
| – Long to Short Ratio: | 2.1 to 1 | 0.7 to 1 | 0.8 to 1 |
| NET POSITION TREND: | |||
| – Strength Index Score (3 Year Range Pct): | 56.3 | 47.7 | 59.6 |
| – Strength Index Reading (3 Year Range): | Bullish | Bearish | Bullish |
| NET POSITION MOVEMENT INDEX: | |||
| – 6-Week Change in Strength Index: | -22.8 | 20.0 | 20.4 |
COTTON Futures:
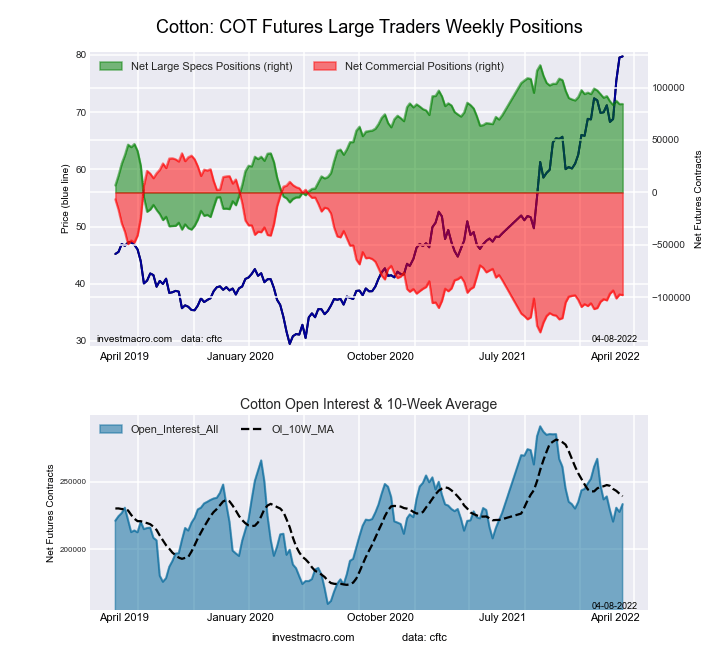 The COTTON large speculator standing this week reached a net position of 84,310 contracts in the data reported through Tuesday. This was a weekly gain of 150 contracts from the previous week which had a total of 84,160 net contracts.
This week’s current strength score (the trader positioning range over the past three years, measured from 0 to 100) shows the speculators are currently Bullish with a score of 76.4 percent. The commercials are Bearish with a score of 20.8 percent and the small traders (not shown in chart) are Bullish-Extreme with a score of 97.6 percent.
| COTTON Futures Statistics | SPECULATORS | COMMERCIALS | SMALL TRADERS |
| – Percent of Open Interest Longs: | 42.5 | 34.9 | 9.0 |
| – Percent of Open Interest Shorts: | 6.4 | 76.9 | 3.2 |
| – Net Position: | 84,310 | -97,775 | 13,465 |
| – Gross Longs: | 99,230 | 81,510 | 20,990 |
| – Gross Shorts: | 14,920 | 179,285 | 7,525 |
| – Long to Short Ratio: | 6.7 to 1 | 0.5 to 1 | 2.8 to 1 |
| NET POSITION TREND: | |||
| – Strength Index Score (3 Year Range Pct): | 76.4 | 20.8 | 97.6 |
| – Strength Index Reading (3 Year Range): | Bullish | Bearish | Bullish-Extreme |
| NET POSITION MOVEMENT INDEX: | |||
| – 6-Week Change in Strength Index: | -3.8 | 2.3 | 12.7 |
COCOA Futures:
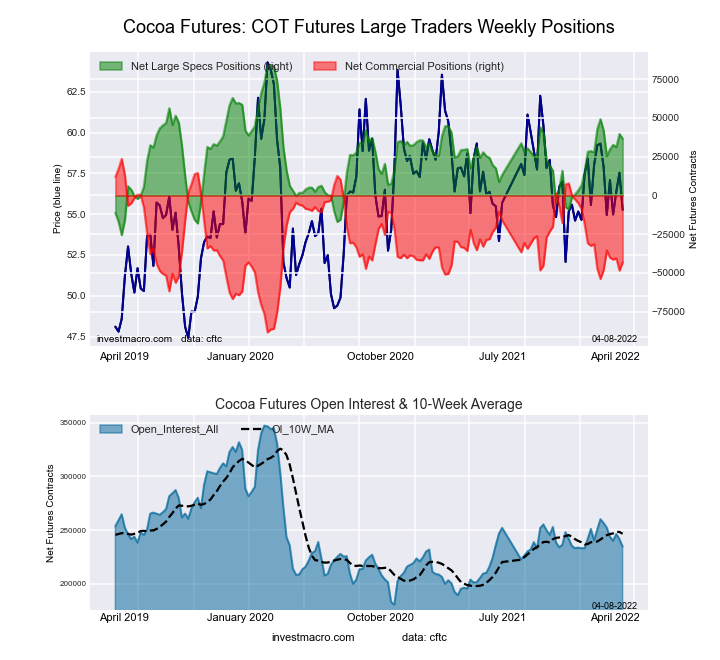 The COCOA large speculator standing this week reached a net position of 36,634 contracts in the data reported through Tuesday. This was a weekly reduction of -3,040 contracts from the previous week which had a total of 39,674 net contracts.
This week’s current strength score (the trader positioning range over the past three years, measured from 0 to 100) shows the speculators are currently Bullish with a score of 53.5 percent. The commercials are Bearish with a score of 43.9 percent and the small traders (not shown in chart) are Bullish with a score of 63.4 percent.
| COCOA Futures Statistics | SPECULATORS | COMMERCIALS | SMALL TRADERS |
| – Percent of Open Interest Longs: | 30.6 | 47.1 | 6.7 |
| – Percent of Open Interest Shorts: | 15.0 | 65.5 | 3.9 |
| – Net Position: | 36,634 | -43,201 | 6,567 |
| – Gross Longs: | 71,790 | 110,528 | 15,763 |
| – Gross Shorts: | 35,156 | 153,729 | 9,196 |
| – Long to Short Ratio: | 2.0 to 1 | 0.7 to 1 | 1.7 to 1 |
| NET POSITION TREND: | |||
| – Strength Index Score (3 Year Range Pct): | 53.5 | 43.9 | 63.4 |
| – Strength Index Reading (3 Year Range): | Bullish | Bearish | Bullish |
| NET POSITION MOVEMENT INDEX: | |||
| – 6-Week Change in Strength Index: | -5.2 | 4.7 | 4.0 |
WHEAT Futures:
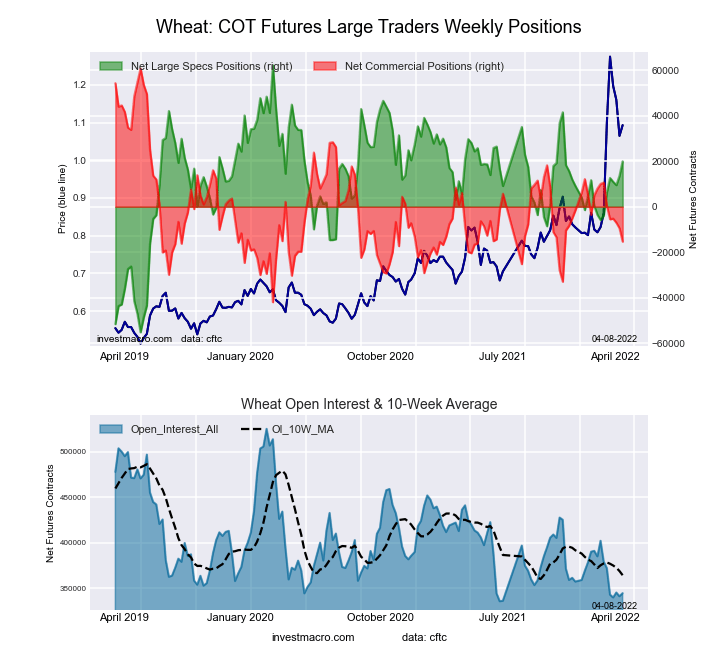 The WHEAT large speculator standing this week reached a net position of 19,951 contracts in the data reported through Tuesday. This was a weekly lift of 6,392 contracts from the previous week which had a total of 13,559 net contracts.
This week’s current strength score (the trader positioning range over the past three years, measured from 0 to 100) shows the speculators are currently Bullish with a score of 64.0 percent. The commercials are Bearish with a score of 25.9 percent and the small traders (not shown in chart) are Bullish-Extreme with a score of 88.5 percent.
| WHEAT Futures Statistics | SPECULATORS | COMMERCIALS | SMALL TRADERS |
| – Percent of Open Interest Longs: | 33.2 | 38.2 | 9.3 |
| – Percent of Open Interest Shorts: | 27.4 | 42.6 | 10.6 |
| – Net Position: | 19,951 | -15,332 | -4,619 |
| – Gross Longs: | 114,287 | 131,605 | 31,901 |
| – Gross Shorts: | 94,336 | 146,937 | 36,520 |
| – Long to Short Ratio: | 1.2 to 1 | 0.9 to 1 | 0.9 to 1 |
| NET POSITION TREND: | |||
| – Strength Index Score (3 Year Range Pct): | 64.0 | 25.9 | 88.5 |
| – Strength Index Reading (3 Year Range): | Bullish | Bearish | Bullish-Extreme |
| NET POSITION MOVEMENT INDEX: | |||
| – 6-Week Change in Strength Index: | 20.3 | -25.3 | 11.2 |
Article By InvestMacro – Receive our weekly COT Reports by Email
*COT Report: The COT data, released weekly to the public each Friday, is updated through the most recent Tuesday (data is 3 days old) and shows a quick view of how large speculators or non-commercials (for-profit traders) were positioned in the futures markets.
The CFTC categorizes trader positions according to commercial hedgers (traders who use futures contracts for hedging as part of the business), non-commercials (large traders who speculate to realize trading profits) and nonreportable traders (usually small traders/speculators) as well as their open interest (contracts open in the market at time of reporting).See CFTC criteria here.

- The US introduces new import tariffs for 60 countries. Brent crude surpasses $100 per barrel Jul 24, 2026
- USD/JPY Breaks Records: Nothing Slows the Yen’s Decline Jul 24, 2026
- Oil prices reached a 6‑week high. The AUD strengthened on the back of a strong labor‑market report Jul 23, 2026
- EUR/USD Recovers as Dollar Weakens Jul 23, 2026
- Bitcoin rose to $66,000. The New Zealand dollar continues to strengthen Jul 22, 2026
- Inflationary pressure is easing in Canada. In New Zealand, on the contrary, inflation is rising Jul 21, 2026
- GBP/USD Falls After Cabinet Changes Jul 21, 2026
- Geopolitical and macroeconomic conditions continue to pressure market sentiment Jul 20, 2026
- USD/JPY Poised to Continue Gains as Expensive Oil and Lack of Support Weigh on Yen Jul 20, 2026
- COT Metals Charts: Weekly Speculator Bets led by Copper & Steel Jul 18, 2026