
By InvestMacro | COT | Data Tables | COT Leaders | Downloads | COT Newsletter
Here are the latest charts and statistics for the Commitment of Traders (COT) data published by the Commodities Futures Trading Commission (CFTC).
The latest COT data is updated through Tuesday March 15th and shows a quick view of how large traders (for-profit speculators and commercial entities) were positioned in the futures markets.
Highlighting the COT soft commodities data is the continued surge in Soybean Meal futures bets. The speculative net position in the Soybean Meal futures has gained for seven consecutive weeks with a total rise of +51,237 contracts over that time-frame. This has pushed the current net standing to over +130,000 net contracts and to the most bullish level in the past one hundred and ninety-seven weeks, dating all the way back to June 5th of 2018. The positive speculator sentiment has now boosted the speculator strength index to the top of its range with a 100 percent score and a bullish-extreme reading (strength index is current speculator standing compared to past three years, above 80 is bullish extreme, below 20 is bearish extreme).
The soft commodities that saw higher bets this week were Corn (9,173 contracts), Sugar (5,504 contracts), Soybeans (1,022 contracts), Soybean Oil (6,245 contracts), Soybean Meal (8,651 contracts), Live Cattle (4,689 contracts) and Cocoa (2,929 contracts).
The soft commodities that saw lower bets this week were Coffee (-6,613 contracts), Lean Hogs (-3,035 contracts), Cotton (-3,510 contracts) and Wheat (-1,695 contracts).
Free Reports:
 Download Our Metatrader 4 Indicators – Put Our Free MetaTrader 4 Custom Indicators on your charts when you join our Weekly Newsletter
 Get our Weekly Commitment of Traders Reports - See where the biggest traders (Hedge Funds and Commercial Hedgers) are positioned in the futures markets on a weekly basis.
| Mar-15-2022 | OI | OI-Index | Spec-Net | Spec-Index | Com-Net | COM-Index | Smalls-Net | Smalls-Index |
|---|---|---|---|---|---|---|---|---|
| WTI Crude | 1,850,794 | 0 | 341,815 | 4 | -382,602 | 90 | 40,787 | 72 |
| Gold | 617,605 | 51 | 261,788 | 71 | -297,441 | 27 | 35,653 | 65 |
| Silver | 159,571 | 25 | 51,554 | 74 | -67,579 | 33 | 16,025 | 36 |
| Copper | 183,170 | 14 | 19,030 | 56 | -26,717 | 41 | 7,687 | 70 |
| Palladium | 6,992 | 2 | -1,009 | 16 | 220 | 78 | 789 | 91 |
| Platinum | 67,727 | 35 | 17,932 | 28 | -25,692 | 72 | 7,760 | 70 |
| Natural Gas | 1,082,746 | 0 | -146,560 | 35 | 105,856 | 64 | 40,704 | 82 |
| Brent | 192,679 | 34 | -18,961 | 79 | 17,343 | 22 | 1,618 | 31 |
| Heating Oil | 349,618 | 31 | 6,455 | 52 | -32,434 | 37 | 25,979 | 88 |
| Soybeans | 745,345 | 32 | 217,599 | 84 | -193,958 | 20 | -23,641 | 31 |
| Corn | 1,504,159 | 22 | 507,206 | 95 | -468,758 | 5 | -38,448 | 21 |
| Coffee | 224,693 | 3 | 45,500 | 82 | -48,838 | 22 | 3,338 | 11 |
| Sugar | 818,877 | 1 | 156,580 | 69 | -188,036 | 33 | 31,456 | 47 |
| Wheat | 339,904 | 2 | 10,930 | 56 | -5,252 | 36 | -5,678 | 91 |
CORN Futures:
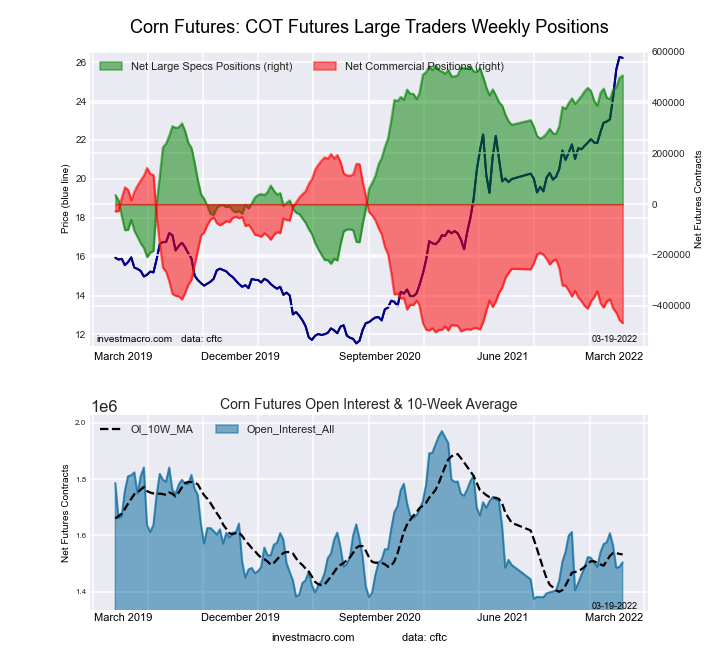 The CORN large speculator standing this week reached a net position of 507,206 contracts in the data reported through Tuesday. This was a weekly advance of 9,173 contracts from the previous week which had a total of 498,033 net contracts.
This week’s current strength score (the trader positioning range over the past three years, measured from 0 to 100) shows the speculators are currently Bullish-Extreme with a score of 94.8 percent. The commercials are Bearish-Extreme with a score of 5.2 percent and the small traders (not shown in chart) are Bearish with a score of 20.9 percent.
| CORN Futures Statistics | SPECULATORS | COMMERCIALS | SMALL TRADERS |
| – Percent of Open Interest Longs: | 38.0 | 44.8 | 8.8 |
| – Percent of Open Interest Shorts: | 4.3 | 76.0 | 11.3 |
| – Net Position: | 507,206 | -468,758 | -38,448 |
| – Gross Longs: | 571,419 | 673,921 | 132,114 |
| – Gross Shorts: | 64,213 | 1,142,679 | 170,562 |
| – Long to Short Ratio: | 8.9 to 1 | 0.6 to 1 | 0.8 to 1 |
| NET POSITION TREND: | |||
| – Strength Index Score (3 Year Range Pct): | 94.8 | 5.2 | 20.9 |
| – Strength Index Reading (3 Year Range): | Bullish-Extreme | Bearish-Extreme | Bearish |
| NET POSITION MOVEMENT INDEX: | |||
| – 6-Week Change in Strength Index: | 6.6 | -8.7 | 5.2 |
SUGAR Futures:
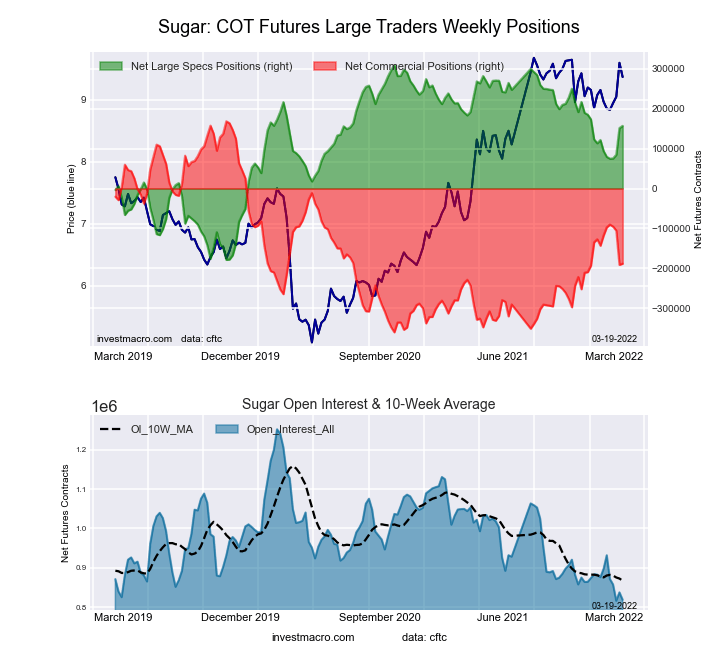 The SUGAR large speculator standing this week reached a net position of 156,580 contracts in the data reported through Tuesday. This was a weekly rise of 5,504 contracts from the previous week which had a total of 151,076 net contracts.
This week’s current strength score (the trader positioning range over the past three years, measured from 0 to 100) shows the speculators are currently Bullish with a score of 68.8 percent. The commercials are Bearish with a score of 32.5 percent and the small traders (not shown in chart) are Bearish with a score of 46.7 percent.
| SUGAR Futures Statistics | SPECULATORS | COMMERCIALS | SMALL TRADERS |
| – Percent of Open Interest Longs: | 25.6 | 51.5 | 10.7 |
| – Percent of Open Interest Shorts: | 6.5 | 74.5 | 6.9 |
| – Net Position: | 156,580 | -188,036 | 31,456 |
| – Gross Longs: | 209,848 | 422,056 | 87,859 |
| – Gross Shorts: | 53,268 | 610,092 | 56,403 |
| – Long to Short Ratio: | 3.9 to 1 | 0.7 to 1 | 1.6 to 1 |
| NET POSITION TREND: | |||
| – Strength Index Score (3 Year Range Pct): | 68.8 | 32.5 | 46.7 |
| – Strength Index Reading (3 Year Range): | Bullish | Bearish | Bearish |
| NET POSITION MOVEMENT INDEX: | |||
| – 6-Week Change in Strength Index: | 12.9 | -13.4 | 9.3 |
COFFEE Futures:
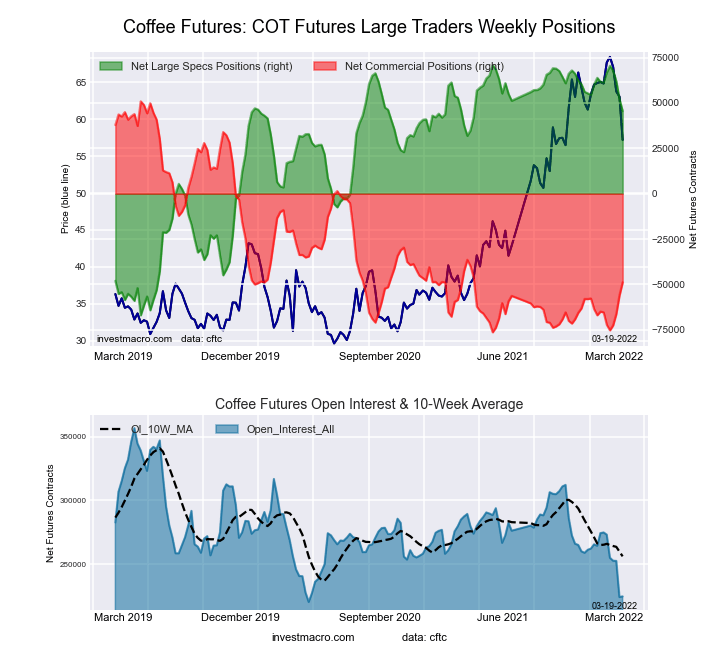 The COFFEE large speculator standing this week reached a net position of 45,500 contracts in the data reported through Tuesday. This was a weekly fall of -6,613 contracts from the previous week which had a total of 52,113 net contracts.
This week’s current strength score (the trader positioning range over the past three years, measured from 0 to 100) shows the speculators are currently Bullish-Extreme with a score of 81.7 percent. The commercials are Bearish with a score of 21.6 percent and the small traders (not shown in chart) are Bearish-Extreme with a score of 11.4 percent.
| COFFEE Futures Statistics | SPECULATORS | COMMERCIALS | SMALL TRADERS |
| – Percent of Open Interest Longs: | 25.8 | 51.9 | 4.6 |
| – Percent of Open Interest Shorts: | 5.6 | 73.6 | 3.1 |
| – Net Position: | 45,500 | -48,838 | 3,338 |
| – Gross Longs: | 58,040 | 116,559 | 10,359 |
| – Gross Shorts: | 12,540 | 165,397 | 7,021 |
| – Long to Short Ratio: | 4.6 to 1 | 0.7 to 1 | 1.5 to 1 |
| NET POSITION TREND: | |||
| – Strength Index Score (3 Year Range Pct): | 81.7 | 21.6 | 11.4 |
| – Strength Index Reading (3 Year Range): | Bullish-Extreme | Bearish | Bearish-Extreme |
| NET POSITION MOVEMENT INDEX: | |||
| – 6-Week Change in Strength Index: | -11.5 | 13.0 | -4.5 |
SOYBEANS Futures:
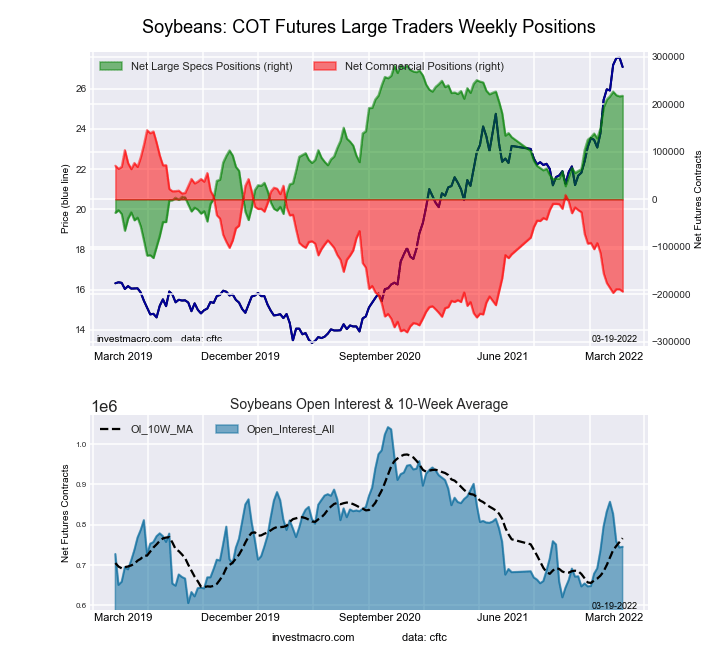 The SOYBEANS large speculator standing this week reached a net position of 217,599 contracts in the data reported through Tuesday. This was a weekly rise of 1,022 contracts from the previous week which had a total of 216,577 net contracts.
This week’s current strength score (the trader positioning range over the past three years, measured from 0 to 100) shows the speculators are currently Bullish-Extreme with a score of 84.1 percent. The commercials are Bearish with a score of 20.2 percent and the small traders (not shown in chart) are Bearish with a score of 31.1 percent.
| SOYBEANS Futures Statistics | SPECULATORS | COMMERCIALS | SMALL TRADERS |
| – Percent of Open Interest Longs: | 35.7 | 44.1 | 6.9 |
| – Percent of Open Interest Shorts: | 6.5 | 70.1 | 10.1 |
| – Net Position: | 217,599 | -193,958 | -23,641 |
| – Gross Longs: | 265,949 | 328,524 | 51,470 |
| – Gross Shorts: | 48,350 | 522,482 | 75,111 |
| – Long to Short Ratio: | 5.5 to 1 | 0.6 to 1 | 0.7 to 1 |
| NET POSITION TREND: | |||
| – Strength Index Score (3 Year Range Pct): | 84.1 | 20.2 | 31.1 |
| – Strength Index Reading (3 Year Range): | Bullish-Extreme | Bearish | Bearish |
| NET POSITION MOVEMENT INDEX: | |||
| – 6-Week Change in Strength Index: | 6.0 | -9.0 | 24.0 |
SOYBEAN OIL Futures:
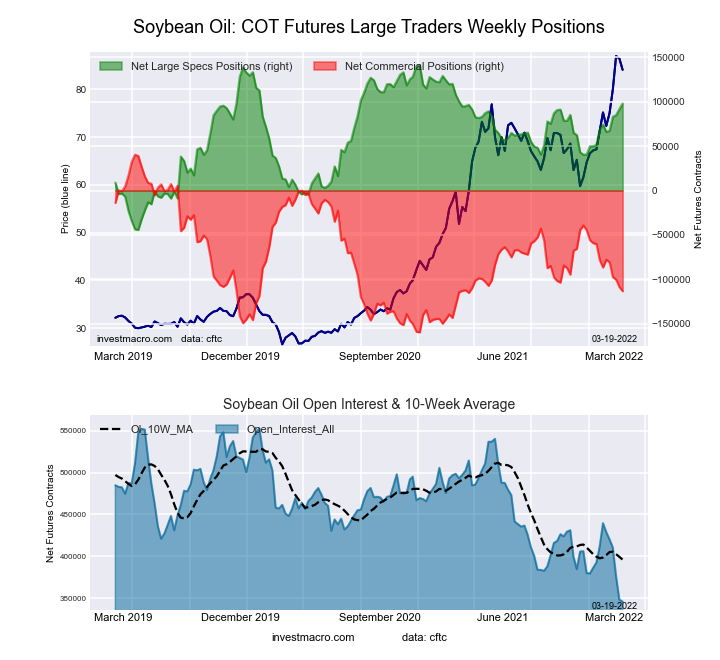 The SOYBEAN OIL large speculator standing this week reached a net position of 97,927 contracts in the data reported through Tuesday. This was a weekly gain of 6,245 contracts from the previous week which had a total of 91,682 net contracts.
This week’s current strength score (the trader positioning range over the past three years, measured from 0 to 100) shows the speculators are currently Bullish with a score of 76.7 percent. The commercials are Bearish with a score of 23.1 percent and the small traders (not shown in chart) are Bullish with a score of 70.8 percent.
| SOYBEAN OIL Futures Statistics | SPECULATORS | COMMERCIALS | SMALL TRADERS |
| – Percent of Open Interest Longs: | 33.0 | 49.0 | 9.6 |
| – Percent of Open Interest Shorts: | 4.7 | 81.7 | 5.2 |
| – Net Position: | 97,927 | -113,307 | 15,380 |
| – Gross Longs: | 114,193 | 169,475 | 33,229 |
| – Gross Shorts: | 16,266 | 282,782 | 17,849 |
| – Long to Short Ratio: | 7.0 to 1 | 0.6 to 1 | 1.9 to 1 |
| NET POSITION TREND: | |||
| – Strength Index Score (3 Year Range Pct): | 76.7 | 23.1 | 70.8 |
| – Strength Index Reading (3 Year Range): | Bullish | Bearish | Bullish |
| NET POSITION MOVEMENT INDEX: | |||
| – 6-Week Change in Strength Index: | 12.7 | -13.4 | 11.9 |
SOYBEAN MEAL Futures:
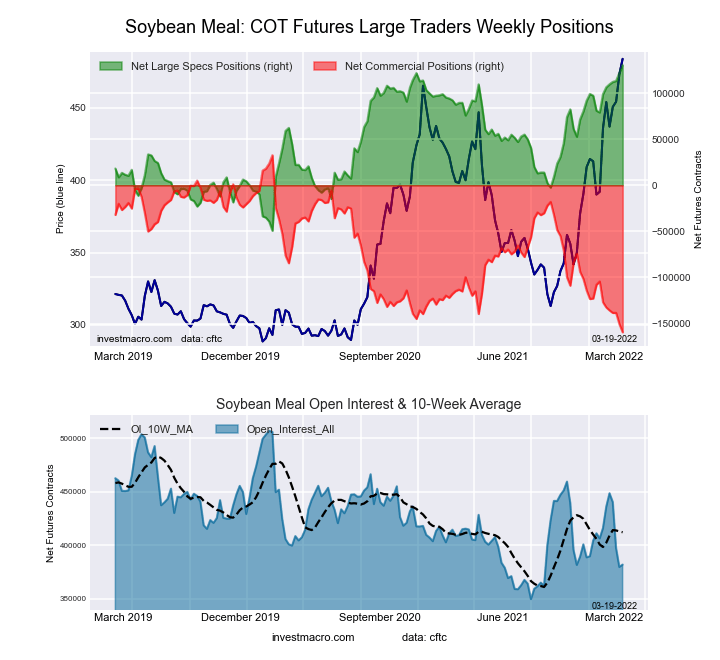 The SOYBEAN MEAL large speculator standing this week reached a net position of 130,255 contracts in the data reported through Tuesday. This was a weekly increase of 8,651 contracts from the previous week which had a total of 121,604 net contracts.
This week’s current strength score (the trader positioning range over the past three years, measured from 0 to 100) shows the speculators are currently Bullish-Extreme with a score of 100.0 percent. The commercials are Bearish-Extreme with a score of 0.0 percent and the small traders (not shown in chart) are Bullish-Extreme with a score of 87.2 percent.
| SOYBEAN MEAL Futures Statistics | SPECULATORS | COMMERCIALS | SMALL TRADERS |
| – Percent of Open Interest Longs: | 36.7 | 42.2 | 12.4 |
| – Percent of Open Interest Shorts: | 2.6 | 83.9 | 4.8 |
| – Net Position: | 130,255 | -159,488 | 29,233 |
| – Gross Longs: | 140,002 | 161,042 | 47,423 |
| – Gross Shorts: | 9,747 | 320,530 | 18,190 |
| – Long to Short Ratio: | 14.4 to 1 | 0.5 to 1 | 2.6 to 1 |
| NET POSITION TREND: | |||
| – Strength Index Score (3 Year Range Pct): | 100.0 | 0.0 | 87.2 |
| – Strength Index Reading (3 Year Range): | Bullish-Extreme | Bearish-Extreme | Bullish-Extreme |
| NET POSITION MOVEMENT INDEX: | |||
| – 6-Week Change in Strength Index: | 17.5 | -16.9 | 4.7 |
LIVE CATTLE Futures:
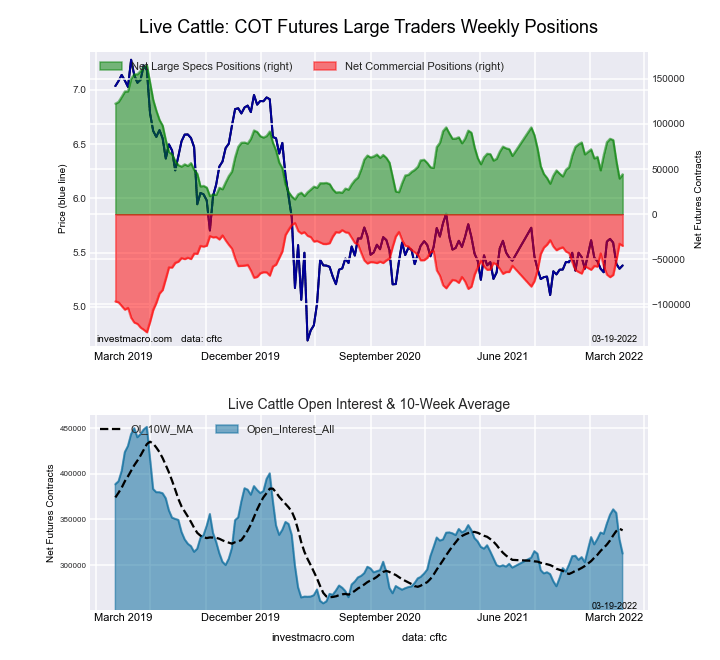 The LIVE CATTLE large speculator standing this week reached a net position of 44,256 contracts in the data reported through Tuesday. This was a weekly rise of 4,689 contracts from the previous week which had a total of 39,567 net contracts.
This week’s current strength score (the trader positioning range over the past three years, measured from 0 to 100) shows the speculators are currently Bearish-Extreme with a score of 18.7 percent. The commercials are Bullish with a score of 79.1 percent and the small traders (not shown in chart) are Bullish with a score of 64.7 percent.
| LIVE CATTLE Futures Statistics | SPECULATORS | COMMERCIALS | SMALL TRADERS |
| – Percent of Open Interest Longs: | 34.7 | 42.5 | 9.8 |
| – Percent of Open Interest Shorts: | 20.6 | 53.7 | 12.8 |
| – Net Position: | 44,256 | -35,043 | -9,213 |
| – Gross Longs: | 108,642 | 132,992 | 30,710 |
| – Gross Shorts: | 64,386 | 168,035 | 39,923 |
| – Long to Short Ratio: | 1.7 to 1 | 0.8 to 1 | 0.8 to 1 |
| NET POSITION TREND: | |||
| – Strength Index Score (3 Year Range Pct): | 18.7 | 79.1 | 64.7 |
| – Strength Index Reading (3 Year Range): | Bearish-Extreme | Bullish | Bullish |
| NET POSITION MOVEMENT INDEX: | |||
| – 6-Week Change in Strength Index: | -14.3 | 18.6 | -3.0 |
LEAN HOGS Futures:
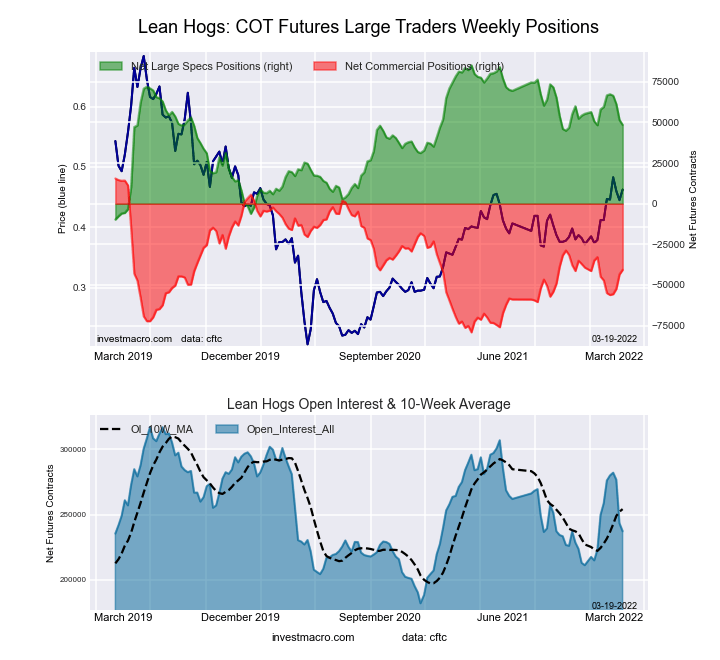 The LEAN HOGS large speculator standing this week reached a net position of 48,490 contracts in the data reported through Tuesday. This was a weekly reduction of -3,035 contracts from the previous week which had a total of 51,525 net contracts.
This week’s current strength score (the trader positioning range over the past three years, measured from 0 to 100) shows the speculators are currently Bullish with a score of 59.6 percent. The commercials are Bearish with a score of 45.4 percent and the small traders (not shown in chart) are Bullish with a score of 54.4 percent.
| LEAN HOGS Futures Statistics | SPECULATORS | COMMERCIALS | SMALL TRADERS |
| – Percent of Open Interest Longs: | 36.9 | 35.7 | 9.2 |
| – Percent of Open Interest Shorts: | 16.5 | 52.9 | 12.5 |
| – Net Position: | 48,490 | -40,705 | -7,785 |
| – Gross Longs: | 87,555 | 84,755 | 21,909 |
| – Gross Shorts: | 39,065 | 125,460 | 29,694 |
| – Long to Short Ratio: | 2.2 to 1 | 0.7 to 1 | 0.7 to 1 |
| NET POSITION TREND: | |||
| – Strength Index Score (3 Year Range Pct): | 59.6 | 45.4 | 54.4 |
| – Strength Index Reading (3 Year Range): | Bullish | Bearish | Bullish |
| NET POSITION MOVEMENT INDEX: | |||
| – 6-Week Change in Strength Index: | -12.0 | 7.6 | 23.1 |
COTTON Futures:
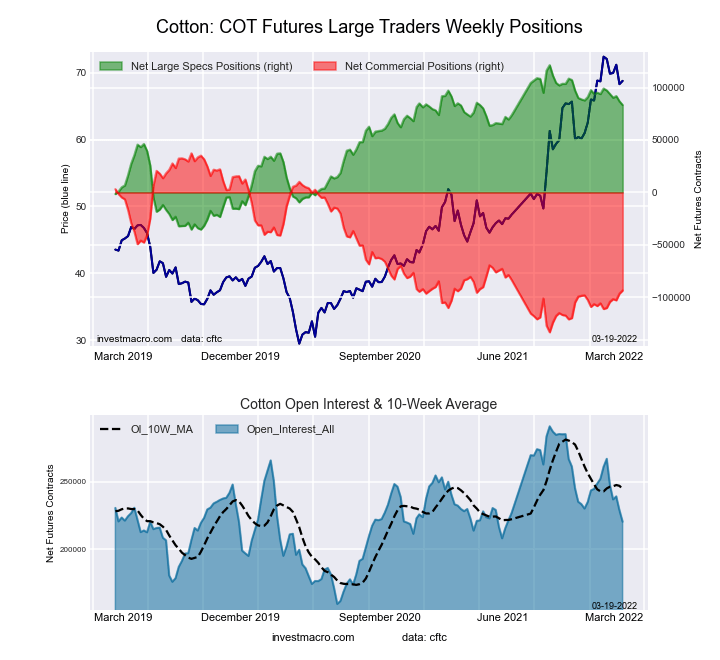 The COTTON large speculator standing this week reached a net position of 83,321 contracts in the data reported through Tuesday. This was a weekly reduction of -3,510 contracts from the previous week which had a total of 86,831 net contracts.
This week’s current strength score (the trader positioning range over the past three years, measured from 0 to 100) shows the speculators are currently Bullish with a score of 75.8 percent. The commercials are Bearish with a score of 23.4 percent and the small traders (not shown in chart) are Bullish with a score of 76.8 percent.
| COTTON Futures Statistics | SPECULATORS | COMMERCIALS | SMALL TRADERS |
| – Percent of Open Interest Longs: | 43.6 | 40.4 | 7.9 |
| – Percent of Open Interest Shorts: | 5.8 | 82.9 | 3.3 |
| – Net Position: | 83,321 | -93,450 | 10,129 |
| – Gross Longs: | 96,108 | 89,048 | 17,343 |
| – Gross Shorts: | 12,787 | 182,498 | 7,214 |
| – Long to Short Ratio: | 7.5 to 1 | 0.5 to 1 | 2.4 to 1 |
| NET POSITION TREND: | |||
| – Strength Index Score (3 Year Range Pct): | 75.8 | 23.4 | 76.8 |
| – Strength Index Reading (3 Year Range): | Bullish | Bearish | Bullish |
| NET POSITION MOVEMENT INDEX: | |||
| – 6-Week Change in Strength Index: | -10.0 | 10.3 | -12.3 |
COCOA Futures:
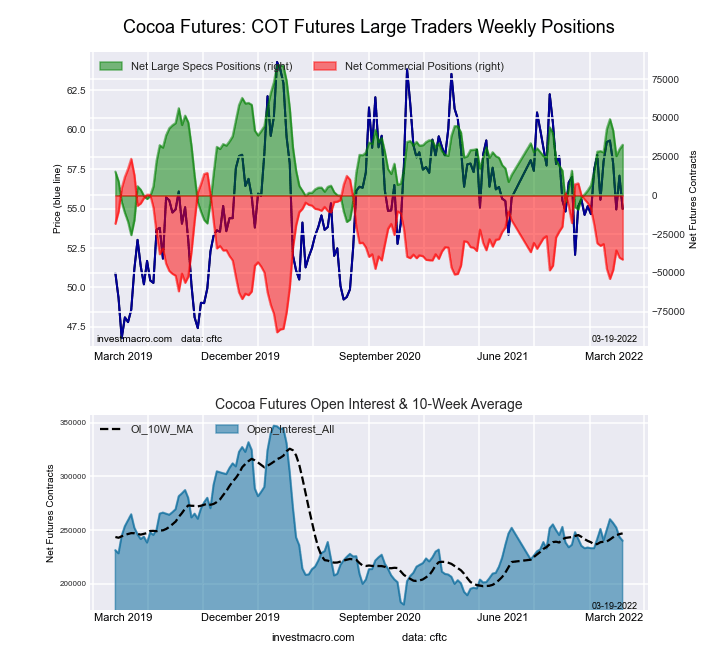 The COCOA large speculator standing this week reached a net position of 32,691 contracts in the data reported through Tuesday. This was a weekly increase of 2,929 contracts from the previous week which had a total of 29,762 net contracts.
This week’s current strength score (the trader positioning range over the past three years, measured from 0 to 100) shows the speculators are currently Bullish with a score of 53.1 percent. The commercials are Bearish with a score of 42.0 percent and the small traders (not shown in chart) are Bullish-Extreme with a score of 83.6 percent.
| COCOA Futures Statistics | SPECULATORS | COMMERCIALS | SMALL TRADERS |
| – Percent of Open Interest Longs: | 29.9 | 49.1 | 6.9 |
| – Percent of Open Interest Shorts: | 16.3 | 66.3 | 3.3 |
| – Net Position: | 32,691 | -41,335 | 8,644 |
| – Gross Longs: | 71,870 | 117,753 | 16,620 |
| – Gross Shorts: | 39,179 | 159,088 | 7,976 |
| – Long to Short Ratio: | 1.8 to 1 | 0.7 to 1 | 2.1 to 1 |
| NET POSITION TREND: | |||
| – Strength Index Score (3 Year Range Pct): | 53.1 | 42.0 | 83.6 |
| – Strength Index Reading (3 Year Range): | Bullish | Bearish | Bullish-Extreme |
| NET POSITION MOVEMENT INDEX: | |||
| – 6-Week Change in Strength Index: | 4.5 | -8.9 | 49.2 |
WHEAT Futures:
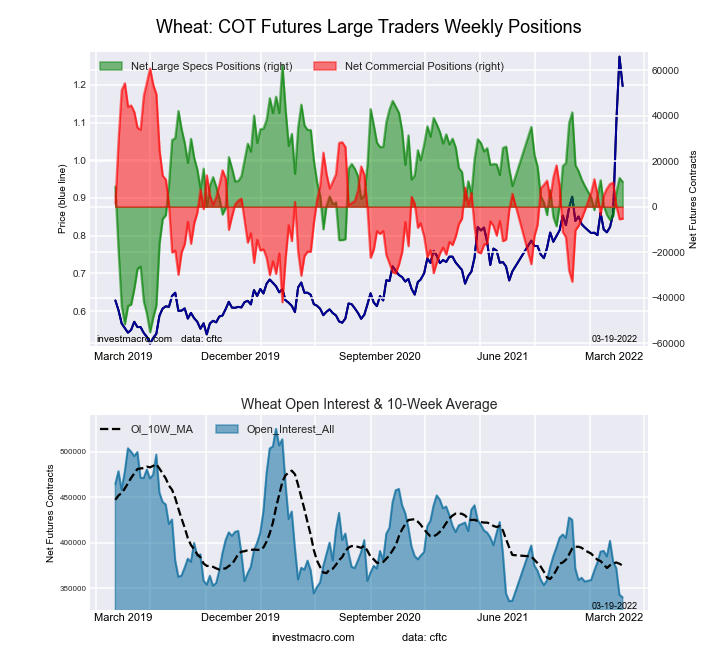 The WHEAT large speculator standing this week reached a net position of 10,930 contracts in the data reported through Tuesday. This was a weekly decline of -1,695 contracts from the previous week which had a total of 12,625 net contracts.
This week’s current strength score (the trader positioning range over the past three years, measured from 0 to 100) shows the speculators are currently Bullish with a score of 56.3 percent. The commercials are Bearish with a score of 35.7 percent and the small traders (not shown in chart) are Bullish-Extreme with a score of 91.2 percent.
| WHEAT Futures Statistics | SPECULATORS | COMMERCIALS | SMALL TRADERS |
| – Percent of Open Interest Longs: | 32.5 | 43.4 | 9.0 |
| – Percent of Open Interest Shorts: | 29.3 | 44.9 | 10.7 |
| – Net Position: | 10,930 | -5,252 | -5,678 |
| – Gross Longs: | 110,614 | 147,417 | 30,713 |
| – Gross Shorts: | 99,684 | 152,669 | 36,391 |
| – Long to Short Ratio: | 1.1 to 1 | 1.0 to 1 | 0.8 to 1 |
| NET POSITION TREND: | |||
| – Strength Index Score (3 Year Range Pct): | 56.3 | 35.7 | 91.2 |
| – Strength Index Reading (3 Year Range): | Bullish | Bearish | Bullish-Extreme |
| NET POSITION MOVEMENT INDEX: | |||
| – 6-Week Change in Strength Index: | 9.0 | -10.1 | -1.3 |
Article By InvestMacro – Receive our weekly COT Reports by Email
*COT Report: The COT data, released weekly to the public each Friday, is updated through the most recent Tuesday (data is 3 days old) and shows a quick view of how large speculators or non-commercials (for-profit traders) were positioned in the futures markets.
The CFTC categorizes trader positions according to commercial hedgers (traders who use futures contracts for hedging as part of the business), non-commercials (large traders who speculate to realize trading profits) and nonreportable traders (usually small traders/speculators) as well as their open interest (contracts open in the market at time of reporting).See CFTC criteria here.

- Inflationary pressure is easing in Canada. In New Zealand, on the contrary, inflation is rising Jul 21, 2026
- GBP/USD Falls After Cabinet Changes Jul 21, 2026
- Geopolitical and macroeconomic conditions continue to pressure market sentiment Jul 20, 2026
- USD/JPY Poised to Continue Gains as Expensive Oil and Lack of Support Weigh on Yen Jul 20, 2026
- COT Metals Charts: Weekly Speculator Bets led by Copper & Steel Jul 18, 2026
- COT Bonds Charts: Weekly Speculator Bets led by 2-Year, SOFR 3M & 5-Year Bonds Jul 18, 2026
- COT Energy Charts: Weekly Speculator Bets led by Brent Oil & Heating Oil Jul 18, 2026
- COT Soft Commodities Charts: Weekly Speculator Bets led by Wheat, Corn & Soybean Meal Jul 18, 2026
- The Bank of Canada kept its interest rate unchanged. Platinum prices reached a three‑week high Jul 16, 2026
- Stock indices rose after the release of US inflation data. China’s GDP slowed sharply Jul 15, 2026