
By InvestMacro | COT | Data Tables | COT Leaders | Downloads | COT Newsletter
Here are the latest charts and statistics for the Commitment of Traders (COT) data published by the Commodities Futures Trading Commission (CFTC).
The latest COT data is updated through Tuesday March 1st and shows a quick view of how large traders (for-profit speculators and commercial entities) were positioned in the futures markets.
Highlighting the COT metals data is the rising speculator sentiment in the Silver futures bets. The speculative net position in the Silver futures rose this week for the third consecutive week and for the seventh time out of the past ten weeks. Silver speculator bets have now gained by a total of +25,649 contracts over these past three weeks and this week’s rise by +14,646 contracts marked the largest one-week gain in the past one hundred and fourteen weeks, dating all the way back to December of 2019. The current speculator contract standing has reached the highest level of the past fifteen weeks with a total of +44,948 contracts. The Silver price has been on the upswing with prices reaching the best levels since August and above the $25.75 per ounce level.
Joining Silver (14,646 contracts) with higher speculator bets this week were Gold (14,474 contracts) and Palladium (525 contracts) while Copper (-3,482 contracts) and Platinum (-650 contracts) saw lower speculator positions for the week.
| Mar-01-2022 | OI | OI-Index | Spec-Net | Spec-Index | Com-Net | COM-Index | Smalls-Net | Smalls-Index |
|---|---|---|---|---|---|---|---|---|
| WTI Crude | 2,028,476 | 25 | 368,663 | 14 | -410,955 | 79 | 42,292 | 75 |
| Gold | 615,600 | 51 | 257,622 | 70 | -285,809 | 30 | 28,187 | 44 |
| Silver | 157,391 | 23 | 44,948 | 67 | -57,150 | 43 | 12,202 | 14 |
| Copper | 195,398 | 23 | 22,093 | 58 | -29,380 | 39 | 7,287 | 67 |
| Palladium | 7,242 | 4 | -904 | 16 | 423 | 79 | 481 | 73 |
| Platinum | 65,383 | 31 | 16,890 | 26 | -24,196 | 74 | 7,306 | 64 |
| Natural Gas | 1,112,832 | 3 | -126,409 | 41 | 90,088 | 59 | 36,321 | 71 |
| Brent | 198,920 | 39 | -6,707 | 100 | 4,004 | 0 | 2,703 | 46 |
| Heating Oil | 349,618 | 31 | 6,455 | 52 | -32,434 | 37 | 25,979 | 88 |
| Soybeans | 758,796 | 35 | 218,907 | 84 | -189,233 | 21 | -29,674 | 21 |
| Corn | 1,484,670 | 18 | 460,938 | 89 | -427,812 | 11 | -33,126 | 24 |
| Coffee | 252,545 | 24 | 61,906 | 94 | -66,290 | 8 | 4,384 | 19 |
| Sugar | 816,211 | 0 | 84,539 | 54 | -105,323 | 48 | 20,784 | 34 |
| Wheat | 372,124 | 19 | 6,443 | 52 | 303 | 41 | -6,746 | 69 |
Free Reports:
 Sign Up for Our Stock Market Newsletter – Get updated on News, Charts & Rankings of Public Companies when you join our Stocks Newsletter
 Get our Weekly Commitment of Traders Reports - See where the biggest traders (Hedge Funds and Commercial Hedgers) are positioned in the futures markets on a weekly basis.
Gold Comex Futures:
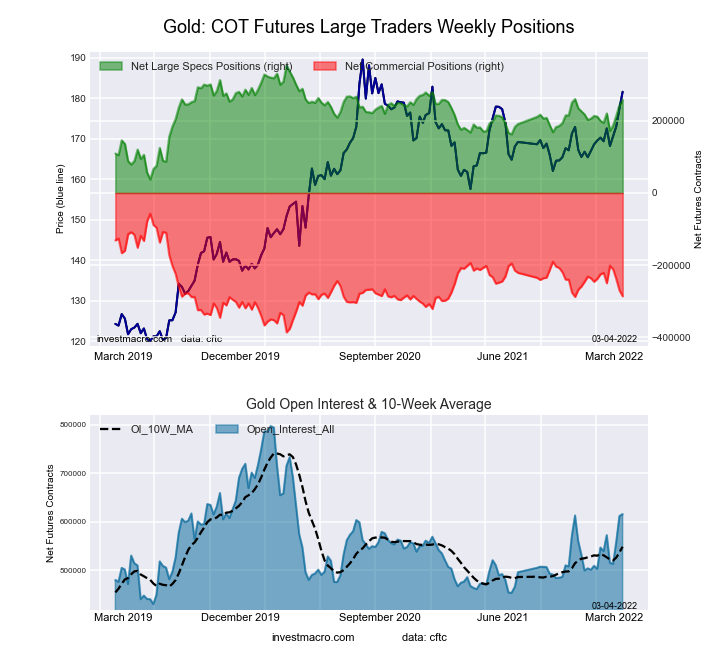 The Gold Comex Futures large speculator standing this week equaled a net position of 257,622 contracts in the data reported through Tuesday. This was a weekly lift of 14,474 contracts from the previous week which had a total of 243,148 net contracts.
This week’s current strength score (the trader positioning range over the past three years, measured from 0 to 100) shows the speculators are currently Bullish with a score of 69.6 percent. The commercials are Bearish with a score of 30.4 percent and the small traders (not shown in chart) are Bearish with a score of 44.2 percent.
| Gold Futures Statistics | SPECULATORS | COMMERCIALS | SMALL TRADERS |
| – Percent of Open Interest Longs: | 57.5 | 20.7 | 8.2 |
| – Percent of Open Interest Shorts: | 15.7 | 67.1 | 3.6 |
| – Net Position: | 257,622 | -285,809 | 28,187 |
| – Gross Longs: | 354,177 | 127,231 | 50,266 |
| – Gross Shorts: | 96,555 | 413,040 | 22,079 |
| – Long to Short Ratio: | 3.7 to 1 | 0.3 to 1 | 2.3 to 1 |
| NET POSITION TREND: | |||
| – Strength Index Score (3 Year Range Pct): | 69.6 | 30.4 | 44.2 |
| – Strength Index Reading (3 Year Range): | Bullish | Bearish | Bearish |
| NET POSITION MOVEMENT INDEX: | |||
| – 6-Week Change in Strength Index: | 20.1 | -19.7 | 3.8 |
Silver Comex Futures:
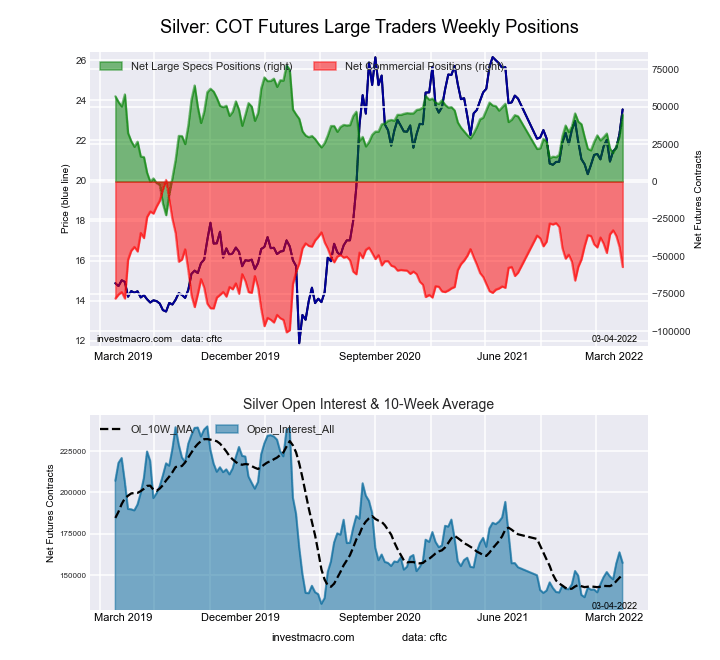 The Silver Comex Futures large speculator standing this week equaled a net position of 44,948 contracts in the data reported through Tuesday. This was a weekly increase of 14,646 contracts from the previous week which had a total of 30,302 net contracts.
This week’s current strength score (the trader positioning range over the past three years, measured from 0 to 100) shows the speculators are currently Bullish with a score of 67.2 percent. The commercials are Bearish with a score of 42.8 percent and the small traders (not shown in chart) are Bearish-Extreme with a score of 13.9 percent.
| Silver Futures Statistics | SPECULATORS | COMMERCIALS | SMALL TRADERS |
| – Percent of Open Interest Longs: | 45.3 | 32.7 | 16.0 |
| – Percent of Open Interest Shorts: | 16.7 | 69.0 | 8.3 |
| – Net Position: | 44,948 | -57,150 | 12,202 |
| – Gross Longs: | 71,235 | 51,440 | 25,234 |
| – Gross Shorts: | 26,287 | 108,590 | 13,032 |
| – Long to Short Ratio: | 2.7 to 1 | 0.5 to 1 | 1.9 to 1 |
| NET POSITION TREND: | |||
| – Strength Index Score (3 Year Range Pct): | 67.2 | 42.8 | 13.9 |
| – Strength Index Reading (3 Year Range): | Bullish | Bearish | Bearish-Extreme |
| NET POSITION MOVEMENT INDEX: | |||
| – 6-Week Change in Strength Index: | 15.2 | -15.3 | 2.1 |
Copper Grade #1 Futures:
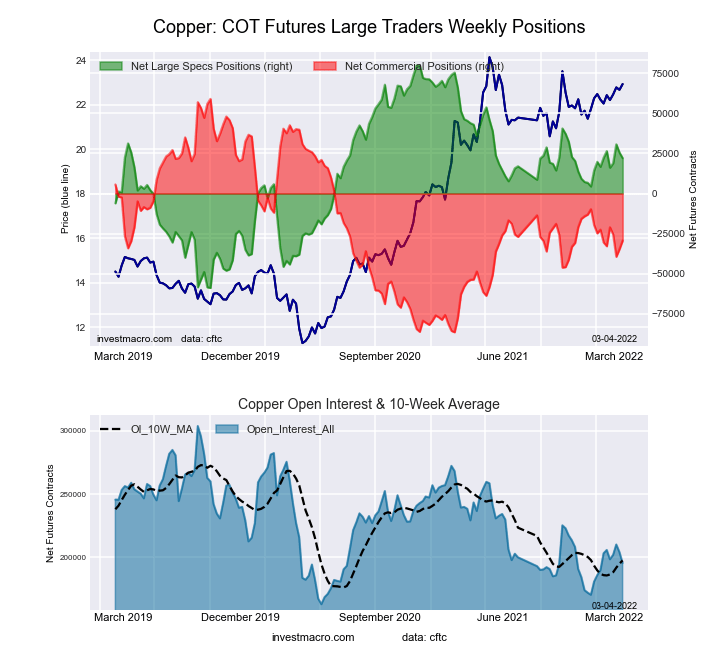 The Copper Grade #1 Futures large speculator standing this week equaled a net position of 22,093 contracts in the data reported through Tuesday. This was a weekly lowering of -3,482 contracts from the previous week which had a total of 25,575 net contracts.
This week’s current strength score (the trader positioning range over the past three years, measured from 0 to 100) shows the speculators are currently Bullish with a score of 58.3 percent. The commercials are Bearish with a score of 39.3 percent and the small traders (not shown in chart) are Bullish with a score of 67.4 percent.
| Copper Futures Statistics | SPECULATORS | COMMERCIALS | SMALL TRADERS |
| – Percent of Open Interest Longs: | 38.7 | 38.5 | 9.7 |
| – Percent of Open Interest Shorts: | 27.3 | 53.5 | 5.9 |
| – Net Position: | 22,093 | -29,380 | 7,287 |
| – Gross Longs: | 75,526 | 75,232 | 18,908 |
| – Gross Shorts: | 53,433 | 104,612 | 11,621 |
| – Long to Short Ratio: | 1.4 to 1 | 0.7 to 1 | 1.6 to 1 |
| NET POSITION TREND: | |||
| – Strength Index Score (3 Year Range Pct): | 58.3 | 39.3 | 67.4 |
| – Strength Index Reading (3 Year Range): | Bullish | Bearish | Bullish |
| NET POSITION MOVEMENT INDEX: | |||
| – 6-Week Change in Strength Index: | -0.2 | 0.8 | -5.4 |
Platinum Futures:
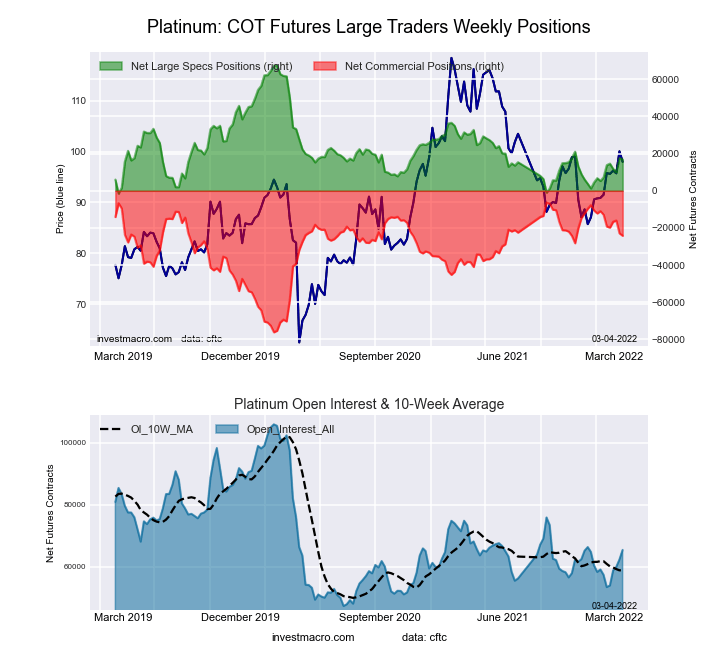 The Platinum Futures large speculator standing this week equaled a net position of 16,890 contracts in the data reported through Tuesday. This was a weekly decline of -650 contracts from the previous week which had a total of 17,540 net contracts.
This week’s current strength score (the trader positioning range over the past three years, measured from 0 to 100) shows the speculators are currently Bearish with a score of 26.2 percent. The commercials are Bullish with a score of 74.4 percent and the small traders (not shown in chart) are Bullish with a score of 64.0 percent.
| Platinum Futures Statistics | SPECULATORS | COMMERCIALS | SMALL TRADERS |
| – Percent of Open Interest Longs: | 51.9 | 29.6 | 14.7 |
| – Percent of Open Interest Shorts: | 26.0 | 66.6 | 3.6 |
| – Net Position: | 16,890 | -24,196 | 7,306 |
| – Gross Longs: | 33,902 | 19,330 | 9,637 |
| – Gross Shorts: | 17,012 | 43,526 | 2,331 |
| – Long to Short Ratio: | 2.0 to 1 | 0.4 to 1 | 4.1 to 1 |
| NET POSITION TREND: | |||
| – Strength Index Score (3 Year Range Pct): | 26.2 | 74.4 | 64.0 |
| – Strength Index Reading (3 Year Range): | Bearish | Bullish | Bullish |
| NET POSITION MOVEMENT INDEX: | |||
| – 6-Week Change in Strength Index: | 14.1 | -16.2 | 22.7 |
Palladium Futures:
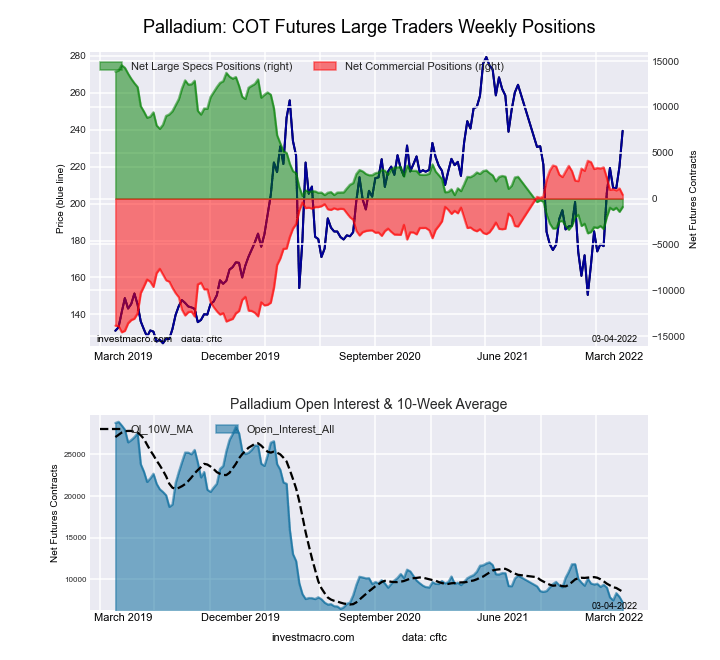 The Palladium Futures large speculator standing this week equaled a net position of -904 contracts in the data reported through Tuesday. This was a weekly boost of 525 contracts from the previous week which had a total of -1,429 net contracts.
This week’s current strength score (the trader positioning range over the past three years, measured from 0 to 100) shows the speculators are currently Bearish-Extreme with a score of 16.4 percent. The commercials are Bullish with a score of 78.9 percent and the small traders (not shown in chart) are Bullish with a score of 73.0 percent.
| Palladium Futures Statistics | SPECULATORS | COMMERCIALS | SMALL TRADERS |
| – Percent of Open Interest Longs: | 33.3 | 44.8 | 20.5 |
| – Percent of Open Interest Shorts: | 45.8 | 39.0 | 13.9 |
| – Net Position: | -904 | 423 | 481 |
| – Gross Longs: | 2,412 | 3,248 | 1,488 |
| – Gross Shorts: | 3,316 | 2,825 | 1,007 |
| – Long to Short Ratio: | 0.7 to 1 | 1.1 to 1 | 1.5 to 1 |
| NET POSITION TREND: | |||
| – Strength Index Score (3 Year Range Pct): | 16.4 | 78.9 | 73.0 |
| – Strength Index Reading (3 Year Range): | Bearish-Extreme | Bullish | Bullish |
| NET POSITION MOVEMENT INDEX: | |||
| – 6-Week Change in Strength Index: | 13.8 | -17.1 | 34.2 |
Article By InvestMacro – Receive our weekly COT Reports by Email
*COT Report: The COT data, released weekly to the public each Friday, is updated through the most recent Tuesday (data is 3 days old) and shows a quick view of how large speculators or non-commercials (for-profit traders) were positioned in the futures markets.
The CFTC categorizes trader positions according to commercial hedgers (traders who use futures contracts for hedging as part of the business), non-commercials (large traders who speculate to realize trading profits) and nonreportable traders (usually small traders/speculators) as well as their open interest (contracts open in the market at time of reporting).See CFTC criteria here.

- Bitcoin rose to $66,000. The New Zealand dollar continues to strengthen Jul 22, 2026
- Inflationary pressure is easing in Canada. In New Zealand, on the contrary, inflation is rising Jul 21, 2026
- GBP/USD Falls After Cabinet Changes Jul 21, 2026
- Geopolitical and macroeconomic conditions continue to pressure market sentiment Jul 20, 2026
- USD/JPY Poised to Continue Gains as Expensive Oil and Lack of Support Weigh on Yen Jul 20, 2026
- COT Metals Charts: Weekly Speculator Bets led by Copper & Steel Jul 18, 2026
- COT Bonds Charts: Weekly Speculator Bets led by 2-Year, SOFR 3M & 5-Year Bonds Jul 18, 2026
- COT Energy Charts: Weekly Speculator Bets led by Brent Oil & Heating Oil Jul 18, 2026
- COT Soft Commodities Charts: Weekly Speculator Bets led by Wheat, Corn & Soybean Meal Jul 18, 2026
- The Bank of Canada kept its interest rate unchanged. Platinum prices reached a three‑week high Jul 16, 2026