
By InvestMacro | COT | Data Tables | COT Leaders | Downloads | COT Newsletter
Here are the latest charts and statistics for the Commitment of Traders (COT) data published by the Commodities Futures Trading Commission (CFTC).
The latest COT data is updated through Tuesday January 4th 2022 and shows a quick view of how large traders (for-profit speculators and commercial entities) were positioned in the futures markets.
Highlighting the COT soft commodities data is the strong gains in the Soybean Meal futures bets. Speculative positions have risen for four consecutive weeks and by a total of 46,386 contracts over that time-frame. This bullishness has pushed the speculator positions to the highest level of the past thirty-four weeks, dating back to May 11th of 2021. The current strength level (spec level compared to its past 3-year range) is at 86.8 percent, which is a bullish-extreme reading and means that speculators are at the top of their range in terms of bullish sentiment.
The soft commodities that saw higher bets this week were Soybeans (5,271 contracts), Soybean Oil (9,115 contracts), Soybean Meal (7,285 contracts), Live Cattle (6,276 contracts), Cotton (6,602 contracts) and Cocoa (3,219 contracts).
Markets with lower bets this week were Corn (-12,695 contracts), Sugar (-11,699 contracts), Coffee (-700 contracts), Lean Hogs (-1,350 contracts) and Wheat (-1,855 contracts).
Free Reports:
 Get our Weekly Commitment of Traders Reports - See where the biggest traders (Hedge Funds and Commercial Hedgers) are positioned in the futures markets on a weekly basis.
 Download Our Metatrader 4 Indicators – Put Our Free MetaTrader 4 Custom Indicators on your charts when you join our Weekly Newsletter
| Jan-04-2022 | OI | OI-Index | Spec-Net | Spec-Index | Com-Net | COM-Index | Smalls-Net | Smalls-Index |
|---|---|---|---|---|---|---|---|---|
| WTI Crude | 1,887,131 | 3 | 332,825 | 15 | -369,956 | 77 | 37,131 | 67 |
| Gold | 502,717 | 20 | 211,355 | 55 | -237,458 | 45 | 26,103 | 38 |
| Silver | 139,521 | 6 | 30,919 | 53 | -43,973 | 56 | 13,054 | 16 |
| Copper | 185,905 | 16 | 19,759 | 57 | -24,845 | 42 | 5,086 | 55 |
| Palladium | 9,480 | 13 | -3,192 | 3 | 3,344 | 96 | -152 | 36 |
| Platinum | 58,275 | 19 | 6,762 | 12 | -12,185 | 92 | 5,423 | 38 |
| Natural Gas | 1,117,606 | 2 | -141,907 | 36 | 110,122 | 66 | 31,785 | 59 |
| Brent | 203,528 | 42 | -11,255 | 100 | 6,990 | 0 | 4,265 | 67 |
| Heating Oil | 320,686 | 14 | 7,492 | 53 | -29,819 | 40 | 22,327 | 76 |
| Soybeans | 648,148 | 10 | 130,556 | 63 | -91,893 | 44 | -38,663 | 8 |
| Corn | 1,520,233 | 24 | 445,481 | 87 | -382,800 | 17 | -62,681 | 7 |
| Coffee | 262,231 | 31 | 54,565 | 88 | -57,751 | 15 | 3,186 | 10 |
| Sugar | 873,918 | 11 | 172,987 | 72 | -192,794 | 32 | 19,807 | 32 |
| Wheat | 359,139 | 12 | 4,080 | 50 | 6,236 | 47 | -10,316 | 52 |
CORN Futures:
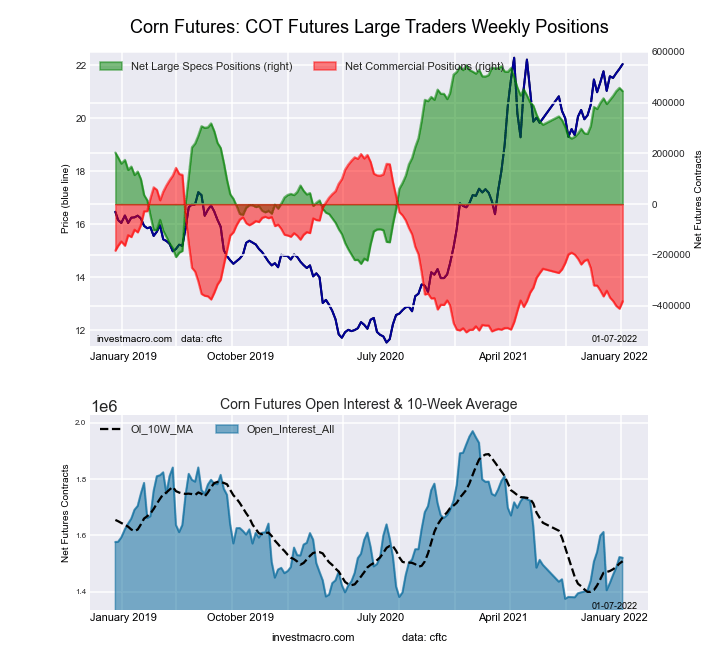 The CORN large speculator standing this week was a net position of 445,481 contracts in the data reported through Tuesday. This was a weekly lowering of -12,695 contracts from the previous week which had a total of 458,176 net contracts.
This week’s current strength score (the trader positioning range over the past three years, measured from 0 to 100) shows the speculators are currently Bullish-Extreme with a score of 86.9 percent. The commercials are Bearish-Extreme with a score of 17.4 percent and the small traders (not shown in chart) are Bearish-Extreme with a score of 7.0 percent.
| CORN Futures Statistics | SPECULATORS | COMMERCIALS | SMALL TRADERS |
| – Percent of Open Interest Longs: | 34.7 | 43.8 | 9.1 |
| – Percent of Open Interest Shorts: | 5.4 | 69.0 | 13.2 |
| – Net Position: | 445,481 | -382,800 | -62,681 |
| – Gross Longs: | 526,997 | 665,410 | 138,025 |
| – Gross Shorts: | 81,516 | 1,048,210 | 200,706 |
| – Long to Short Ratio: | 6.5 to 1 | 0.6 to 1 | 0.7 to 1 |
| NET POSITION TREND: | |||
| – Strength Index Score (3 Year Range Pct): | 86.9 | 17.4 | 7.0 |
| – Strength Index Reading (3 Year Range): | Bullish-Extreme | Bearish-Extreme | Bearish-Extreme |
| NET POSITION MOVEMENT INDEX: | |||
| – 6-Week Change in Strength Index: | 3.6 | -2.7 | -5.3 |
SUGAR Futures:
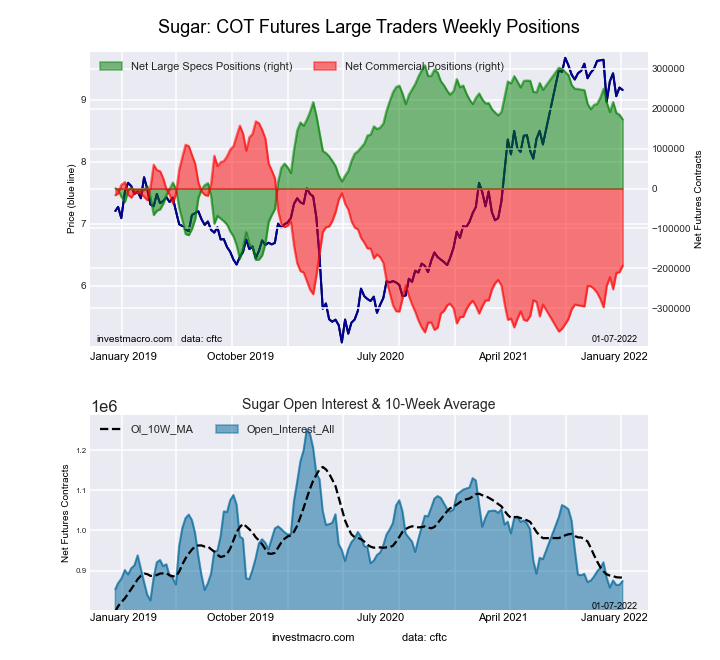 The SUGAR large speculator standing this week was a net position of 172,987 contracts in the data reported through Tuesday. This was a weekly fall of -11,699 contracts from the previous week which had a total of 184,686 net contracts.
This week’s current strength score (the trader positioning range over the past three years, measured from 0 to 100) shows the speculators are currently Bullish with a score of 72.2 percent. The commercials are Bearish with a score of 31.6 percent and the small traders (not shown in chart) are Bearish with a score of 32.3 percent.
| SUGAR Futures Statistics | SPECULATORS | COMMERCIALS | SMALL TRADERS |
| – Percent of Open Interest Longs: | 26.2 | 50.3 | 8.7 |
| – Percent of Open Interest Shorts: | 6.4 | 72.4 | 6.5 |
| – Net Position: | 172,987 | -192,794 | 19,807 |
| – Gross Longs: | 228,567 | 439,824 | 76,229 |
| – Gross Shorts: | 55,580 | 632,618 | 56,422 |
| – Long to Short Ratio: | 4.1 to 1 | 0.7 to 1 | 1.4 to 1 |
| NET POSITION TREND: | |||
| – Strength Index Score (3 Year Range Pct): | 72.2 | 31.6 | 32.3 |
| – Strength Index Reading (3 Year Range): | Bullish | Bearish | Bearish |
| NET POSITION MOVEMENT INDEX: | |||
| – 6-Week Change in Strength Index: | -15.7 | 19.7 | -34.0 |
COFFEE Futures:
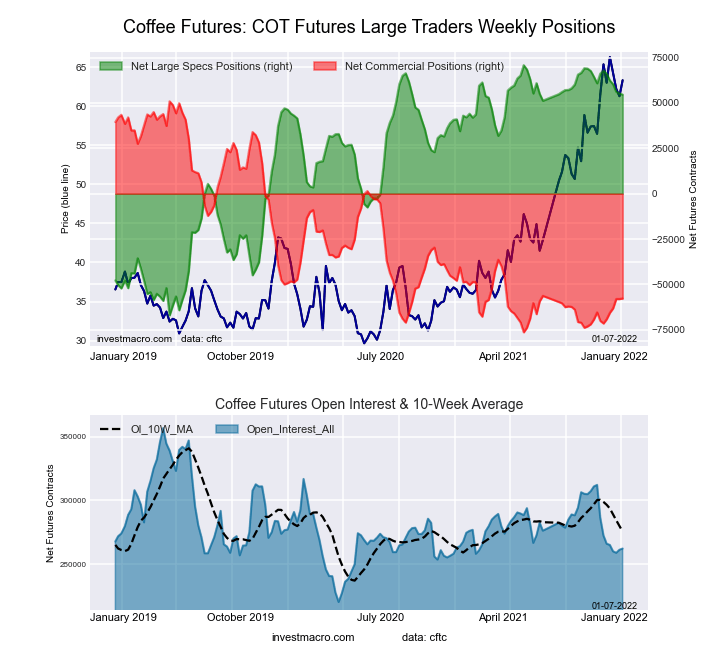 The COFFEE large speculator standing this week was a net position of 54,565 contracts in the data reported through Tuesday. This was a weekly decline of -700 contracts from the previous week which had a total of 55,265 net contracts.
This week’s current strength score (the trader positioning range over the past three years, measured from 0 to 100) shows the speculators are currently Bullish-Extreme with a score of 88.2 percent. The commercials are Bearish-Extreme with a score of 14.6 percent and the small traders (not shown in chart) are Bearish-Extreme with a score of 10.4 percent.
| COFFEE Futures Statistics | SPECULATORS | COMMERCIALS | SMALL TRADERS |
| – Percent of Open Interest Longs: | 26.1 | 47.4 | 3.7 |
| – Percent of Open Interest Shorts: | 5.3 | 69.4 | 2.5 |
| – Net Position: | 54,565 | -57,751 | 3,186 |
| – Gross Longs: | 68,421 | 124,348 | 9,757 |
| – Gross Shorts: | 13,856 | 182,099 | 6,571 |
| – Long to Short Ratio: | 4.9 to 1 | 0.7 to 1 | 1.5 to 1 |
| NET POSITION TREND: | |||
| – Strength Index Score (3 Year Range Pct): | 88.2 | 14.6 | 10.4 |
| – Strength Index Reading (3 Year Range): | Bullish-Extreme | Bearish-Extreme | Bearish-Extreme |
| NET POSITION MOVEMENT INDEX: | |||
| – 6-Week Change in Strength Index: | -9.7 | 10.8 | -2.8 |
SOYBEANS Futures:
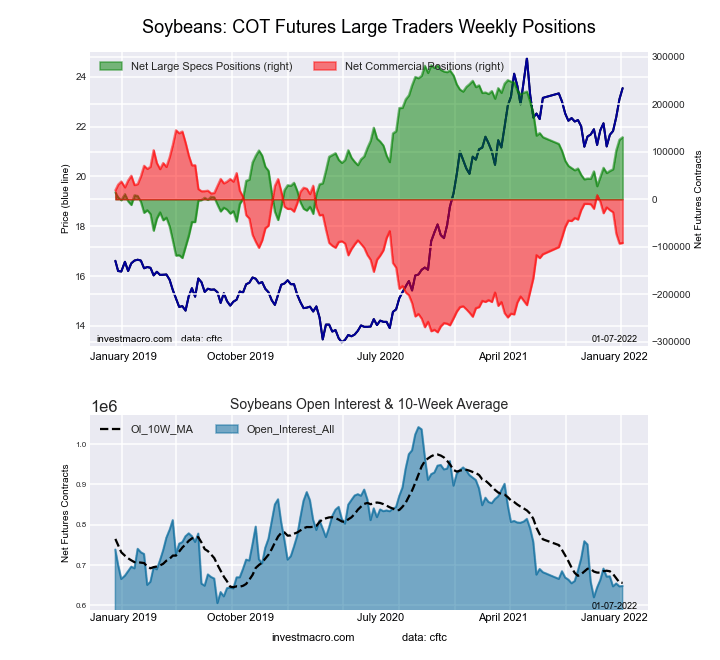 The SOYBEANS large speculator standing this week was a net position of 130,556 contracts in the data reported through Tuesday. This was a weekly advance of 5,271 contracts from the previous week which had a total of 125,285 net contracts.
This week’s current strength score (the trader positioning range over the past three years, measured from 0 to 100) shows the speculators are currently Bullish with a score of 62.6 percent. The commercials are Bearish with a score of 44.2 percent and the small traders (not shown in chart) are Bearish-Extreme with a score of 7.5 percent.
| SOYBEANS Futures Statistics | SPECULATORS | COMMERCIALS | SMALL TRADERS |
| – Percent of Open Interest Longs: | 26.7 | 53.2 | 7.3 |
| – Percent of Open Interest Shorts: | 6.6 | 67.4 | 13.3 |
| – Net Position: | 130,556 | -91,893 | -38,663 |
| – Gross Longs: | 173,162 | 344,990 | 47,288 |
| – Gross Shorts: | 42,606 | 436,883 | 85,951 |
| – Long to Short Ratio: | 4.1 to 1 | 0.8 to 1 | 0.6 to 1 |
| NET POSITION TREND: | |||
| – Strength Index Score (3 Year Range Pct): | 62.6 | 44.2 | 7.5 |
| – Strength Index Reading (3 Year Range): | Bullish | Bearish | Bearish-Extreme |
| NET POSITION MOVEMENT INDEX: | |||
| – 6-Week Change in Strength Index: | 15.9 | -14.8 | -2.7 |
SOYBEAN MEAL Futures:
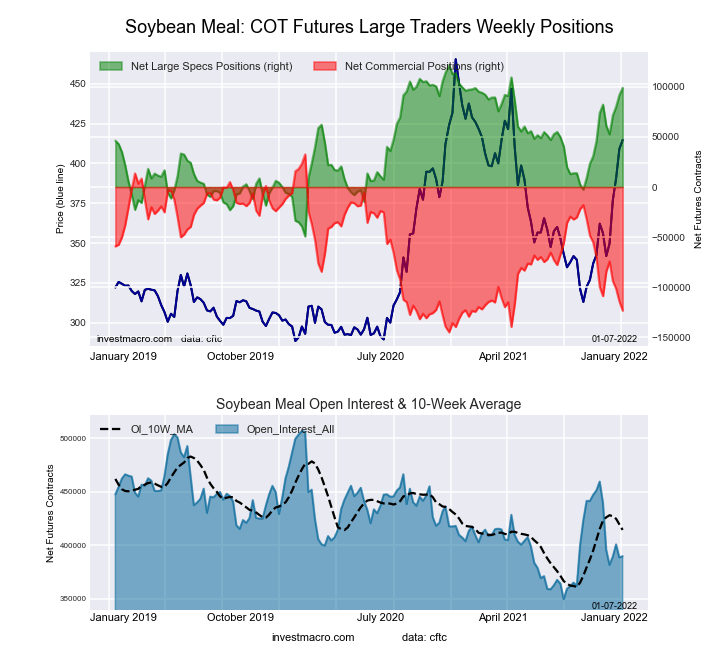 The SOYBEAN MEAL large speculator standing this week was a net position of 99,029 contracts in the data reported through Tuesday. This was a weekly advance of 7,285 contracts from the previous week which had a total of 91,744 net contracts.
This week’s current strength score (the trader positioning range over the past three years, measured from 0 to 100) shows the speculators are currently Bullish-Extreme with a score of 86.8 percent. The commercials are Bearish-Extreme with a score of 12.2 percent and the small traders (not shown in chart) are Bullish with a score of 68.3 percent.
| SOYBEAN MEAL Futures Statistics | SPECULATORS | COMMERCIALS | SMALL TRADERS |
| – Percent of Open Interest Longs: | 30.5 | 46.0 | 11.7 |
| – Percent of Open Interest Shorts: | 5.1 | 77.7 | 5.5 |
| – Net Position: | 99,029 | -123,394 | 24,365 |
| – Gross Longs: | 119,027 | 179,465 | 45,616 |
| – Gross Shorts: | 19,998 | 302,859 | 21,251 |
| – Long to Short Ratio: | 6.0 to 1 | 0.6 to 1 | 2.1 to 1 |
| NET POSITION TREND: | |||
| – Strength Index Score (3 Year Range Pct): | 86.8 | 12.2 | 68.3 |
| – Strength Index Reading (3 Year Range): | Bullish-Extreme | Bearish-Extreme | Bullish |
| NET POSITION MOVEMENT INDEX: | |||
| – 6-Week Change in Strength Index: | 9.8 | -8.2 | -9.2 |
LIVE CATTLE Futures:
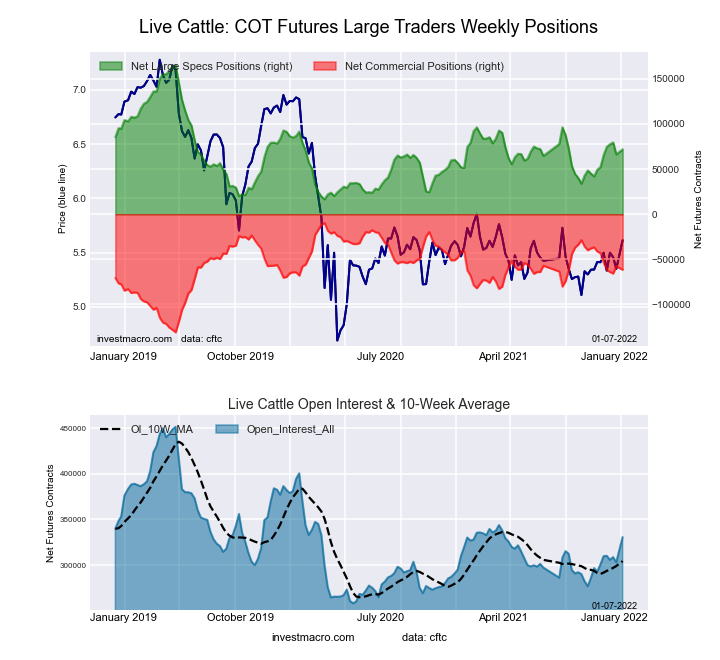 The LIVE CATTLE large speculator standing this week was a net position of 71,879 contracts in the data reported through Tuesday. This was a weekly rise of 6,276 contracts from the previous week which had a total of 66,356 net contracts.
This week’s current strength score (the trader positioning range over the past three years, measured from 0 to 100) shows the speculators are currently Bearish with a score of 37.3 percent. The commercials are Bullish with a score of 57.2 percent and the small traders (not shown in chart) are Bullish with a score of 61.9 percent.
| LIVE CATTLE Futures Statistics | SPECULATORS | COMMERCIALS | SMALL TRADERS |
| – Percent of Open Interest Longs: | 35.3 | 35.1 | 9.4 |
| – Percent of Open Interest Shorts: | 13.5 | 53.7 | 12.5 |
| – Net Position: | 71,879 | -61,531 | -10,348 |
| – Gross Longs: | 116,678 | 116,043 | 31,098 |
| – Gross Shorts: | 44,799 | 177,574 | 41,446 |
| – Long to Short Ratio: | 2.6 to 1 | 0.7 to 1 | 0.8 to 1 |
| NET POSITION TREND: | |||
| – Strength Index Score (3 Year Range Pct): | 37.3 | 57.2 | 61.9 |
| – Strength Index Reading (3 Year Range): | Bearish | Bullish | Bullish |
| NET POSITION MOVEMENT INDEX: | |||
| – 6-Week Change in Strength Index: | 4.3 | -6.7 | 4.2 |
LEAN HOGS Futures:
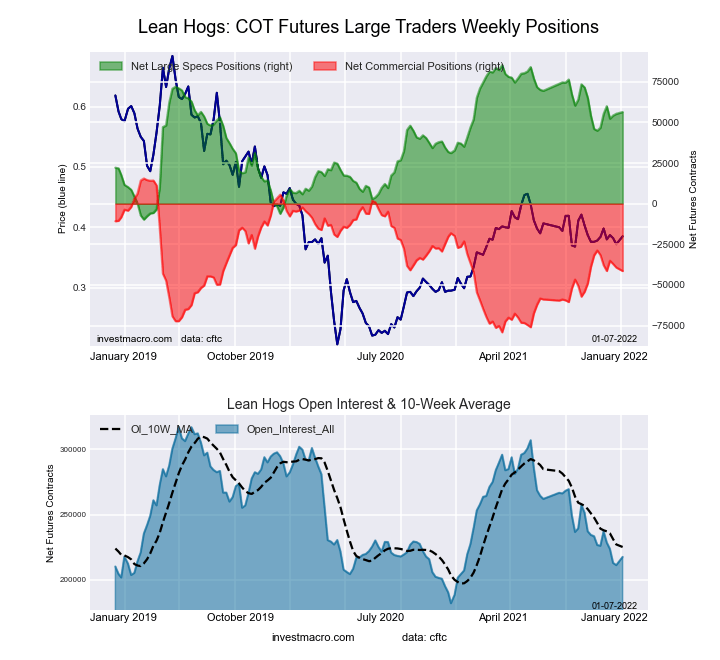 The LEAN HOGS large speculator standing this week was a net position of 56,389 contracts in the data reported through Tuesday. This was a weekly decline of -1,350 contracts from the previous week which had a total of 55,296 net contracts.
This week’s current strength score (the trader positioning range over the past three years, measured from 0 to 100) shows the speculators are currently Bullish with a score of 69.4 percent. The commercials are Bearish with a score of 39.9 percent and the small traders (not shown in chart) are Bearish-Extreme with a score of 15.4 percent.
| LEAN HOGS Futures Statistics | SPECULATORS | COMMERCIALS | SMALL TRADERS |
| – Percent of Open Interest Longs: | 39.5 | 36.2 | 7.6 |
| – Percent of Open Interest Shorts: | 13.6 | 55.2 | 14.5 |
| – Net Position: | 56,389 | -41,396 | -14,993 |
| – Gross Longs: | 85,903 | 78,722 | 16,461 |
| – Gross Shorts: | 29,514 | 120,118 | 31,454 |
| – Long to Short Ratio: | 2.9 to 1 | 0.7 to 1 | 0.5 to 1 |
| NET POSITION TREND: | |||
| – Strength Index Score (3 Year Range Pct): | 69.4 | 39.9 | 15.4 |
| – Strength Index Reading (3 Year Range): | Bullish | Bearish | Bearish-Extreme |
| NET POSITION MOVEMENT INDEX: | |||
| – 6-Week Change in Strength Index: | 1.3 | -3.8 | 10.3 |
COTTON Futures:
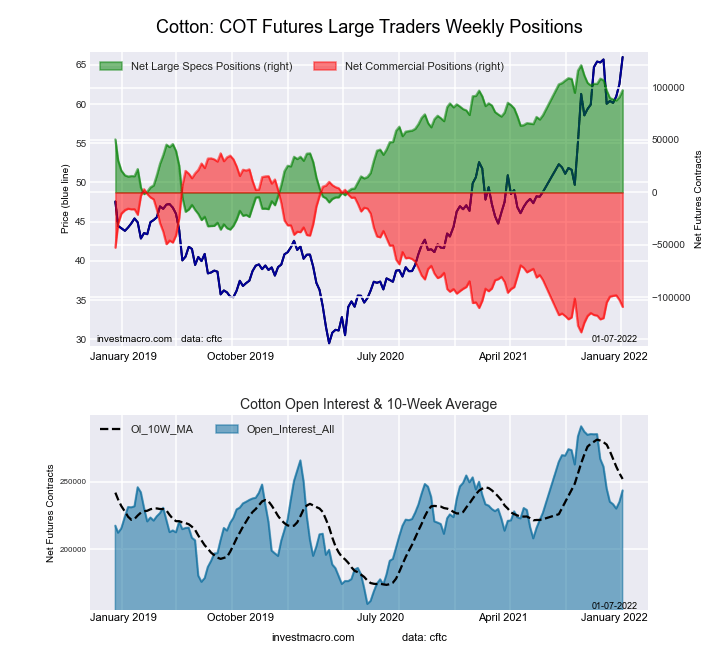 The COTTON large speculator standing this week was a net position of 97,491 contracts in the data reported through Tuesday. This was a weekly boost of 6,602 contracts from the previous week which had a total of 90,889 net contracts.
This week’s current strength score (the trader positioning range over the past three years, measured from 0 to 100) shows the speculators are currently Bullish-Extreme with a score of 84.8 percent. The commercials are Bearish-Extreme with a score of 14.2 percent and the small traders (not shown in chart) are Bullish-Extreme with a score of 85.9 percent.
| COTTON Futures Statistics | SPECULATORS | COMMERCIALS | SMALL TRADERS |
| – Percent of Open Interest Longs: | 45.0 | 33.9 | 7.9 |
| – Percent of Open Interest Shorts: | 4.9 | 78.7 | 3.1 |
| – Net Position: | 97,491 | -109,084 | 11,593 |
| – Gross Longs: | 109,464 | 82,584 | 19,240 |
| – Gross Shorts: | 11,973 | 191,668 | 7,647 |
| – Long to Short Ratio: | 9.1 to 1 | 0.4 to 1 | 2.5 to 1 |
| NET POSITION TREND: | |||
| – Strength Index Score (3 Year Range Pct): | 84.8 | 14.2 | 85.9 |
| – Strength Index Reading (3 Year Range): | Bullish-Extreme | Bearish-Extreme | Bullish-Extreme |
| NET POSITION MOVEMENT INDEX: | |||
| – 6-Week Change in Strength Index: | -6.1 | 6.3 | -6.5 |
COCOA Futures:
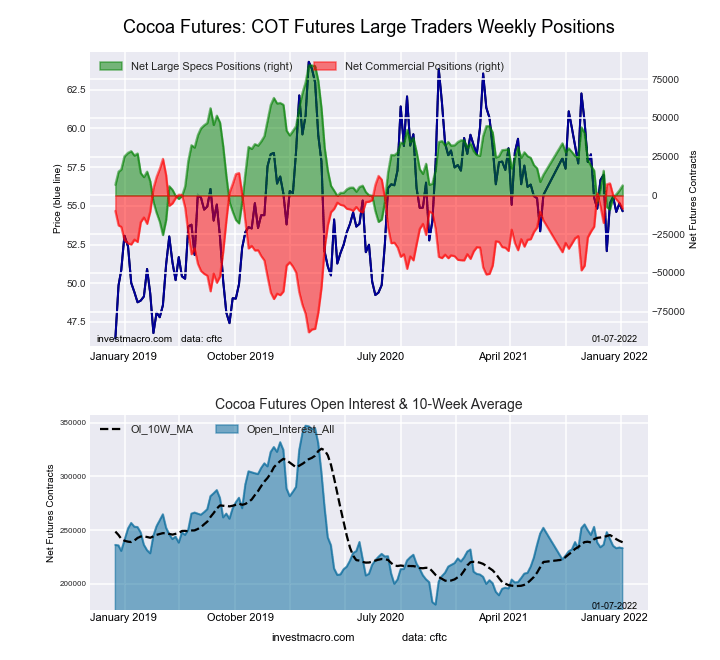 The COCOA large speculator standing this week was a net position of 6,469 contracts in the data reported through Tuesday. This was a weekly rise of 3,219 contracts from the previous week which had a total of 3,250 net contracts.
This week’s current strength score (the trader positioning range over the past three years, measured from 0 to 100) shows the speculators are currently Bearish with a score of 29.2 percent. The commercials are Bullish with a score of 71.2 percent and the small traders (not shown in chart) are Bearish with a score of 32.7 percent.
| COCOA Futures Statistics | SPECULATORS | COMMERCIALS | SMALL TRADERS |
| – Percent of Open Interest Longs: | 24.9 | 52.5 | 5.2 |
| – Percent of Open Interest Shorts: | 22.1 | 56.2 | 4.3 |
| – Net Position: | 6,469 | -8,599 | 2,130 |
| – Gross Longs: | 58,024 | 122,449 | 12,205 |
| – Gross Shorts: | 51,555 | 131,048 | 10,075 |
| – Long to Short Ratio: | 1.1 to 1 | 0.9 to 1 | 1.2 to 1 |
| NET POSITION TREND: | |||
| – Strength Index Score (3 Year Range Pct): | 29.2 | 71.2 | 32.7 |
| – Strength Index Reading (3 Year Range): | Bearish | Bullish | Bearish |
| NET POSITION MOVEMENT INDEX: | |||
| – 6-Week Change in Strength Index: | -8.6 | 8.1 | 3.9 |
WHEAT Futures:
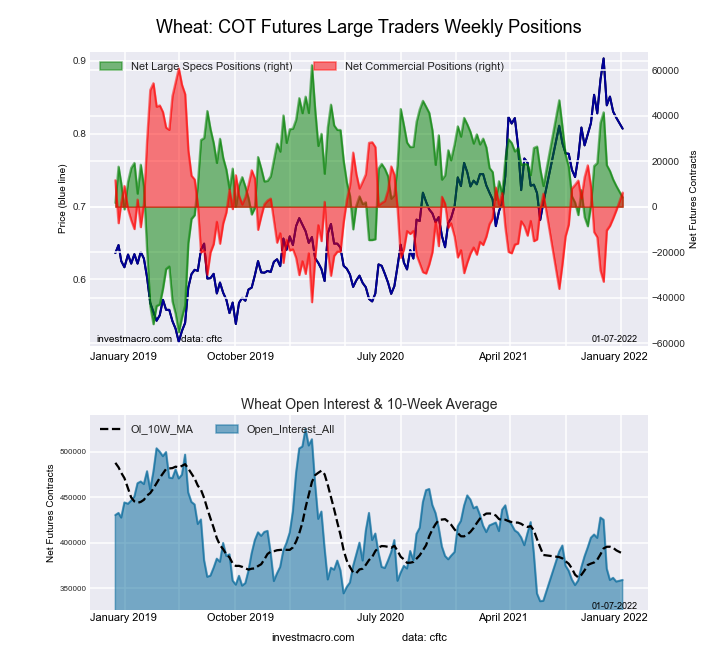 The WHEAT large speculator standing this week was a net position of 4,080 contracts in the data reported through Tuesday. This was a weekly reduction of -1,855 contracts from the previous week which had a total of 9,132 net contracts.
This week’s current strength score (the trader positioning range over the past three years, measured from 0 to 100) shows the speculators are currently Bullish with a score of 50.5 percent. The commercials are Bearish with a score of 46.9 percent and the small traders (not shown in chart) are Bullish with a score of 52.3 percent.
| WHEAT Futures Statistics | SPECULATORS | COMMERCIALS | SMALL TRADERS |
| – Percent of Open Interest Longs: | 28.6 | 39.6 | 8.4 |
| – Percent of Open Interest Shorts: | 27.4 | 37.8 | 11.3 |
| – Net Position: | 4,080 | 6,236 | -10,316 |
| – Gross Longs: | 102,552 | 142,158 | 30,223 |
| – Gross Shorts: | 98,472 | 135,922 | 40,539 |
| – Long to Short Ratio: | 1.0 to 1 | 1.0 to 1 | 0.7 to 1 |
| NET POSITION TREND: | |||
| – Strength Index Score (3 Year Range Pct): | 50.5 | 46.9 | 52.3 |
| – Strength Index Reading (3 Year Range): | Bullish | Bearish | Bullish |
| NET POSITION MOVEMENT INDEX: | |||
| – 6-Week Change in Strength Index: | -31.9 | 38.1 | -8.4 |
Article By InvestMacro – Receive our weekly COT Reports by Email
*COT Report: The COT data, released weekly to the public each Friday, is updated through the most recent Tuesday (data is 3 days old) and shows a quick view of how large speculators or non-commercials (for-profit traders) were positioned in the futures markets.
The CFTC categorizes trader positions according to commercial hedgers (traders who use futures contracts for hedging as part of the business), non-commercials (large traders who speculate to realize trading profits) and nonreportable traders (usually small traders/speculators) as well as their open interest (contracts open in the market at time of reporting).See CFTC criteria here.

- The US introduces new import tariffs for 60 countries. Brent crude surpasses $100 per barrel Jul 24, 2026
- USD/JPY Breaks Records: Nothing Slows the Yen’s Decline Jul 24, 2026
- Oil prices reached a 6‑week high. The AUD strengthened on the back of a strong labor‑market report Jul 23, 2026
- EUR/USD Recovers as Dollar Weakens Jul 23, 2026
- Bitcoin rose to $66,000. The New Zealand dollar continues to strengthen Jul 22, 2026
- Inflationary pressure is easing in Canada. In New Zealand, on the contrary, inflation is rising Jul 21, 2026
- GBP/USD Falls After Cabinet Changes Jul 21, 2026
- Geopolitical and macroeconomic conditions continue to pressure market sentiment Jul 20, 2026
- USD/JPY Poised to Continue Gains as Expensive Oil and Lack of Support Weigh on Yen Jul 20, 2026
- COT Metals Charts: Weekly Speculator Bets led by Copper & Steel Jul 18, 2026