
By InvestMacro | COT | Data Tables | COT Leaders | Downloads | COT Newsletter
Here are the latest charts and statistics for the Commitment of Traders (COT) data published by the Commodities Futures Trading Commission (CFTC) on Monday due to the Thanksgiving holiday last week.
The latest COT data is updated through Tuesday November 23rd 2021 and shows a quick view of how large traders (for-profit speculators and commercial entities) were positioned in the futures markets.
| Nov-23-2021 | OI | OI-Index | Spec-Net | Spec-Index | Com-Net | COM-Index | Smalls-Net | Smalls-Index |
|---|---|---|---|---|---|---|---|---|
| WTI Crude | 2,028,573 | 13 | 407,657 | 42 | -454,965 | 46 | 47,308 | 82 |
| Gold | 559,823 | 40 | 234,411 | 62 | -267,834 | 36 | 33,423 | 63 |
| Silver | 149,642 | 16 | 40,105 | 62 | -56,998 | 43 | 16,893 | 39 |
| Copper | 190,681 | 20 | 13,722 | 52 | -20,941 | 45 | 7,219 | 67 |
| Palladium | 10,078 | 16 | -1,766 | 9 | 1,913 | 91 | -147 | 36 |
| Platinum | 61,553 | 24 | 13,135 | 21 | -20,272 | 80 | 7,137 | 62 |
| Natural Gas | 1,280,907 | 38 | -137,255 | 37 | 97,333 | 62 | 39,922 | 80 |
| Brent | 206,668 | 45 | -14,522 | 95 | 7,811 | 1 | 6,711 | 100 |
| Heating Oil | 338,034 | 0 | 15,631 | 65 | -30,997 | 38 | 15,366 | 52 |
| Soybeans | 691,303 | 20 | 66,214 | 47 | -29,173 | 59 | -37,041 | 10 |
| Corn | 1,611,856 | 40 | 417,089 | 83 | -363,662 | 20 | -53,427 | 12 |
| Coffee | 272,527 | 38 | 67,904 | 98 | -71,494 | 4 | 3,590 | 13 |
| Sugar | 920,493 | 24 | 249,626 | 88 | -296,922 | 12 | 47,296 | 66 |
| Wheat | 425,301 | 47 | 41,489 | 82 | -32,939 | 9 | -8,550 | 61 |
CORN Futures:
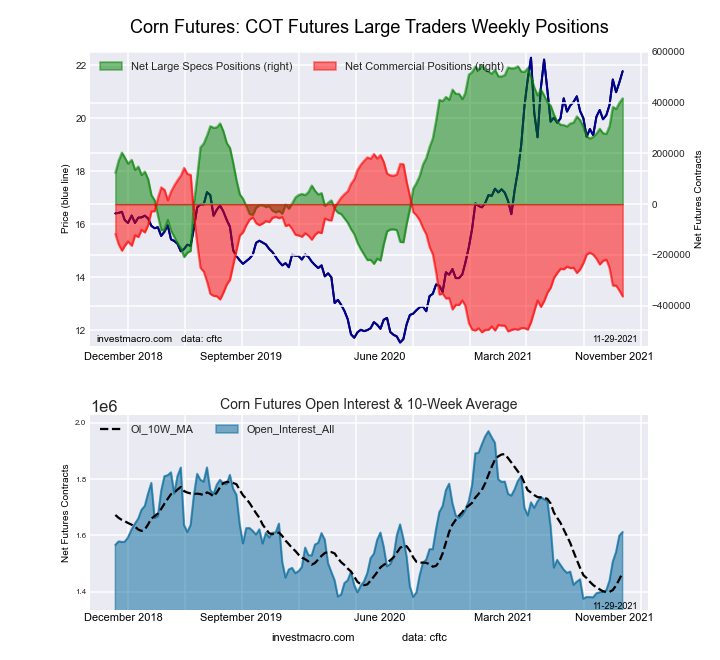 The CORN large speculator standing this week equaled a net position of 417,089 contracts in the data reported through Tuesday. This was a weekly advance of 17,903 contracts from the previous week which had a total of 399,186 net contracts.
This week’s current strength score (the trader positioning range over the past three years, measured from 0 to 100) shows the speculators are currently Bullish-Extreme with a score of 83.3 percent. The commercials are Bearish with a score of 20.1 percent and the small traders (not shown in chart) are Bearish-Extreme with a score of 12.3 percent.
Free Reports:
 Sign Up for Our Stock Market Newsletter – Get updated on News, Charts & Rankings of Public Companies when you join our Stocks Newsletter
 Get our Weekly Commitment of Traders Reports - See where the biggest traders (Hedge Funds and Commercial Hedgers) are positioned in the futures markets on a weekly basis.
| CORN Futures Statistics | SPECULATORS | COMMERCIALS | SMALL TRADERS |
| – Percent of Open Interest Longs: | 32.7 | 44.9 | 8.4 |
| – Percent of Open Interest Shorts: | 6.8 | 67.4 | 11.7 |
| – Net Position: | 417,089 | -363,662 | -53,427 |
| – Gross Longs: | 526,890 | 723,154 | 135,102 |
| – Gross Shorts: | 109,801 | 1,086,816 | 188,529 |
| – Long to Short Ratio: | 4.8 to 1 | 0.7 to 1 | 0.7 to 1 |
| NET POSITION TREND: | |||
| – COT Index Score (3 Year Range Pct): | 83.3 | 20.1 | 12.3 |
| – COT Index Reading (3 Year Range): | Bullish-Extreme | Bearish | Bearish-Extreme |
| NET POSITION MOVEMENT INDEX: | |||
| – 6-Week Change in Strength Index: | 17.6 | -20.0 | 1.4 |
SUGAR Futures:
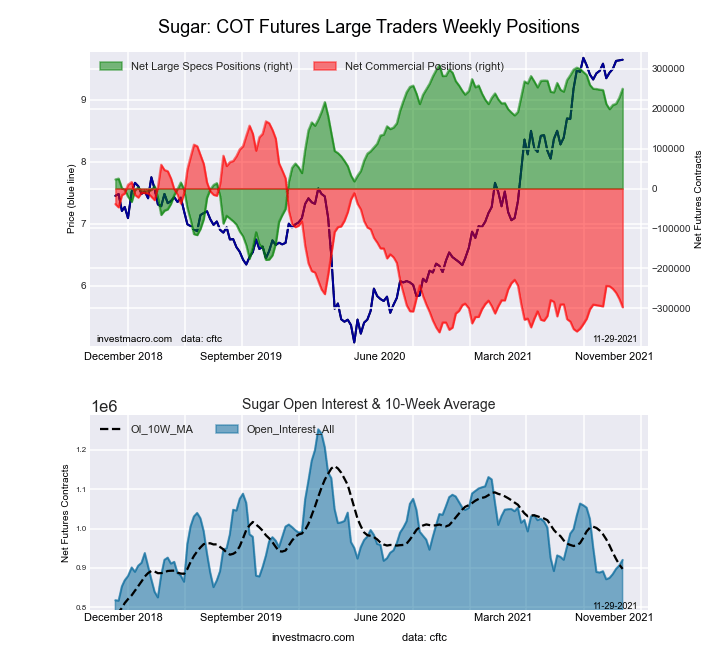 The SUGAR large speculator standing this week equaled a net position of 249,626 contracts in the data reported through Tuesday. This was a weekly boost of 22,237 contracts from the previous week which had a total of 227,389 net contracts.
This week’s current strength score (the trader positioning range over the past three years, measured from 0 to 100) shows the speculators are currently Bullish-Extreme with a score of 87.9 percent. The commercials are Bearish-Extreme with a score of 11.9 percent and the small traders (not shown in chart) are Bullish with a score of 66.3 percent.
| SUGAR Futures Statistics | SPECULATORS | COMMERCIALS | SMALL TRADERS |
| – Percent of Open Interest Longs: | 32.3 | 42.7 | 10.4 |
| – Percent of Open Interest Shorts: | 5.2 | 74.9 | 5.3 |
| – Net Position: | 249,626 | -296,922 | 47,296 |
| – Gross Longs: | 297,379 | 392,868 | 96,088 |
| – Gross Shorts: | 47,753 | 689,790 | 48,792 |
| – Long to Short Ratio: | 6.2 to 1 | 0.6 to 1 | 2.0 to 1 |
| NET POSITION TREND: | |||
| – COT Index Score (3 Year Range Pct): | 87.9 | 11.9 | 66.3 |
| – COT Index Reading (3 Year Range): | Bullish-Extreme | Bearish-Extreme | Bullish |
| NET POSITION MOVEMENT INDEX: | |||
| – 6-Week Change in Strength Index: | 0.7 | -0.4 | -1.5 |
COFFEE Futures:
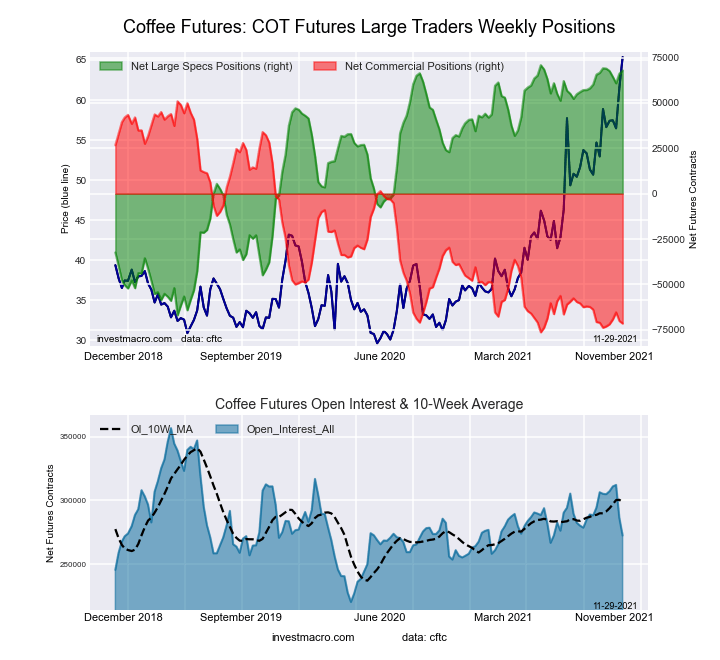 The COFFEE large speculator standing this week equaled a net position of 67,904 contracts in the data reported through Tuesday. This was a weekly increase of 1,823 contracts from the previous week which had a total of 66,081 net contracts.
This week’s current strength score (the trader positioning range over the past three years, measured from 0 to 100) shows the speculators are currently Bullish-Extreme with a score of 97.9 percent. The commercials are Bearish-Extreme with a score of 3.8 percent and the small traders (not shown in chart) are Bearish-Extreme with a score of 13.2 percent.
| COFFEE Futures Statistics | SPECULATORS | COMMERCIALS | SMALL TRADERS |
| – Percent of Open Interest Longs: | 29.9 | 42.9 | 3.8 |
| – Percent of Open Interest Shorts: | 5.0 | 69.1 | 2.5 |
| – Net Position: | 67,904 | -71,494 | 3,590 |
| – Gross Longs: | 81,471 | 116,803 | 10,294 |
| – Gross Shorts: | 13,567 | 188,297 | 6,704 |
| – Long to Short Ratio: | 6.0 to 1 | 0.6 to 1 | 1.5 to 1 |
| NET POSITION TREND: | |||
| – COT Index Score (3 Year Range Pct): | 97.9 | 3.8 | 13.2 |
| – COT Index Reading (3 Year Range): | Bullish-Extreme | Bearish-Extreme | Bearish-Extreme |
| NET POSITION MOVEMENT INDEX: | |||
| – 6-Week Change in Strength Index: | -0.9 | 1.8 | -7.9 |
SOYBEANS Futures:
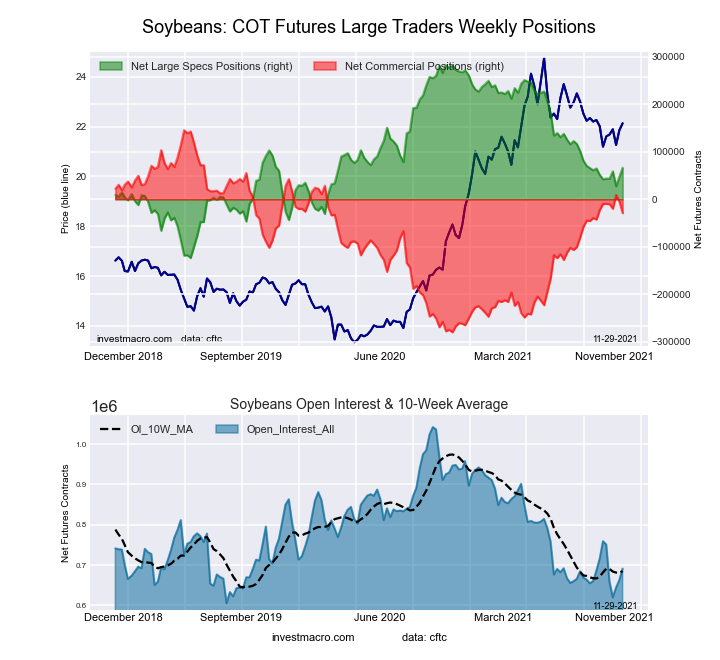 The SOYBEANS large speculator standing this week equaled a net position of 66,214 contracts in the data reported through Tuesday. This was a weekly lift of 19,297 contracts from the previous week which had a total of 46,917 net contracts.
This week’s current strength score (the trader positioning range over the past three years, measured from 0 to 100) shows the speculators are currently Bearish with a score of 46.8 percent. The commercials are Bullish with a score of 59.0 percent and the small traders (not shown in chart) are Bearish-Extreme with a score of 10.2 percent.
| SOYBEANS Futures Statistics | SPECULATORS | COMMERCIALS | SMALL TRADERS |
| – Percent of Open Interest Longs: | 20.7 | 57.1 | 7.3 |
| – Percent of Open Interest Shorts: | 11.1 | 61.3 | 12.7 |
| – Net Position: | 66,214 | -29,173 | -37,041 |
| – Gross Longs: | 143,021 | 394,688 | 50,478 |
| – Gross Shorts: | 76,807 | 423,861 | 87,519 |
| – Long to Short Ratio: | 1.9 to 1 | 0.9 to 1 | 0.6 to 1 |
| NET POSITION TREND: | |||
| – COT Index Score (3 Year Range Pct): | 46.8 | 59.0 | 10.2 |
| – COT Index Reading (3 Year Range): | Bearish | Bullish | Bearish-Extreme |
| NET POSITION MOVEMENT INDEX: | |||
| – 6-Week Change in Strength Index: | 6.0 | -4.6 | -7.8 |
SOYBEAN OIL Futures:
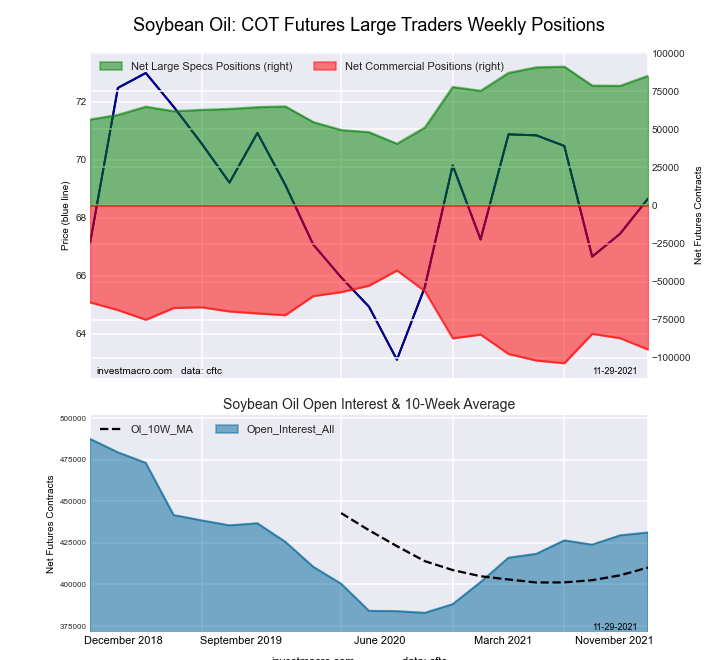 The SOYBEAN OIL large speculator standing this week equaled a net position of 85,142 contracts in the data reported through Tuesday. This was a weekly lift of 6,576 contracts from the previous week which had a total of 78,566 net contracts.
This week’s current strength score (the trader positioning range over the past three years, measured from 0 to 100) shows the speculators are currently Bullish with a score of 69.8 percent. The commercials are Bearish with a score of 32.5 percent and the small traders (not shown in chart) are Bearish with a score of 48.9 percent.
| SOYBEAN OIL Futures Statistics | SPECULATORS | COMMERCIALS | SMALL TRADERS |
| – Percent of Open Interest Longs: | 28.3 | 47.7 | 7.5 |
| – Percent of Open Interest Shorts: | 8.6 | 69.6 | 5.3 |
| – Net Position: | 85,142 | -94,645 | 9,503 |
| – Gross Longs: | 122,206 | 205,546 | 32,256 |
| – Gross Shorts: | 37,064 | 300,191 | 22,753 |
| – Long to Short Ratio: | 3.3 to 1 | 0.7 to 1 | 1.4 to 1 |
| NET POSITION TREND: | |||
| – COT Index Score (3 Year Range Pct): | 69.8 | 32.5 | 48.9 |
| – COT Index Reading (3 Year Range): | Bullish | Bearish | Bearish |
| NET POSITION MOVEMENT INDEX: | |||
| – 6-Week Change in Strength Index: | 5.3 | -4.9 | -0.0 |
SOYBEAN MEAL Futures:
 The SOYBEAN MEAL large speculator standing this week equaled a net position of 82,271 contracts in the data reported through Tuesday. This was a weekly lift of 8,282 contracts from the previous week which had a total of 73,989 net contracts.
This week’s current strength score (the trader positioning range over the past three years, measured from 0 to 100) shows the speculators are currently Bullish with a score of 77.0 percent. The commercials are Bearish with a score of 20.3 percent and the small traders (not shown in chart) are Bullish with a score of 77.4 percent.
| SOYBEAN MEAL Futures Statistics | SPECULATORS | COMMERCIALS | SMALL TRADERS |
| – Percent of Open Interest Longs: | 23.8 | 44.8 | 11.8 |
| – Percent of Open Interest Shorts: | 5.1 | 69.6 | 5.7 |
| – Net Position: | 82,271 | -108,922 | 26,651 |
| – Gross Longs: | 104,796 | 197,007 | 51,748 |
| – Gross Shorts: | 22,525 | 305,929 | 25,097 |
| – Long to Short Ratio: | 4.7 to 1 | 0.6 to 1 | 2.1 to 1 |
| NET POSITION TREND: | |||
| – COT Index Score (3 Year Range Pct): | 77.0 | 20.3 | 77.4 |
| – COT Index Reading (3 Year Range): | Bullish | Bearish | Bullish |
| NET POSITION MOVEMENT INDEX: | |||
| – 6-Week Change in Strength Index: | 49.6 | -51.2 | 24.1 |
LIVE CATTLE Futures:
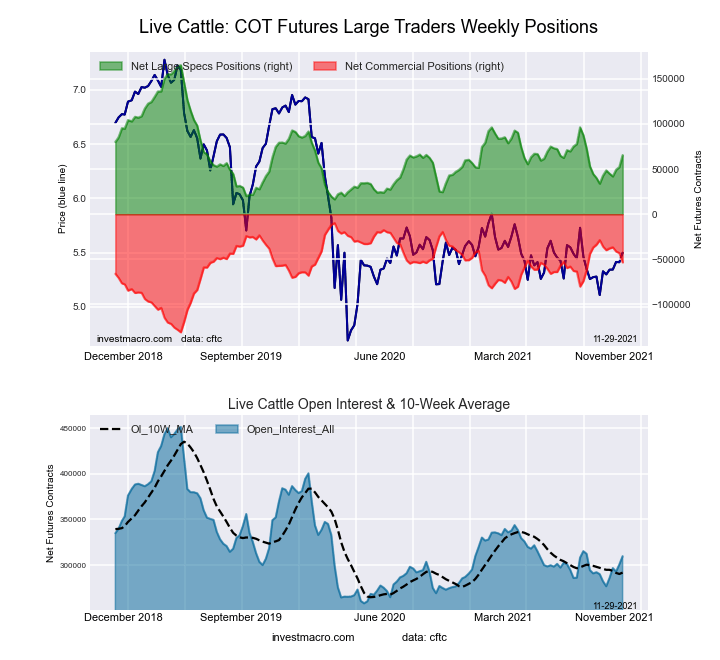 The LIVE CATTLE large speculator standing this week equaled a net position of 65,461 contracts in the data reported through Tuesday. This was a weekly lift of 13,235 contracts from the previous week which had a total of 52,226 net contracts.
This week’s current strength score (the trader positioning range over the past three years, measured from 0 to 100) shows the speculators are currently Bearish with a score of 33.0 percent. The commercials are Bullish with a score of 64.0 percent and the small traders (not shown in chart) are Bullish with a score of 57.7 percent.
| LIVE CATTLE Futures Statistics | SPECULATORS | COMMERCIALS | SMALL TRADERS |
| – Percent of Open Interest Longs: | 36.5 | 38.6 | 10.0 |
| – Percent of Open Interest Shorts: | 15.4 | 55.8 | 13.9 |
| – Net Position: | 65,461 | -53,384 | -12,077 |
| – Gross Longs: | 113,139 | 119,408 | 31,094 |
| – Gross Shorts: | 47,678 | 172,792 | 43,171 |
| – Long to Short Ratio: | 2.4 to 1 | 0.7 to 1 | 0.7 to 1 |
| NET POSITION TREND: | |||
| – COT Index Score (3 Year Range Pct): | 33.0 | 64.0 | 57.7 |
| – COT Index Reading (3 Year Range): | Bearish | Bullish | Bullish |
| NET POSITION MOVEMENT INDEX: | |||
| – 6-Week Change in Strength Index: | 15.2 | -14.5 | -12.5 |
LEAN HOGS Futures:
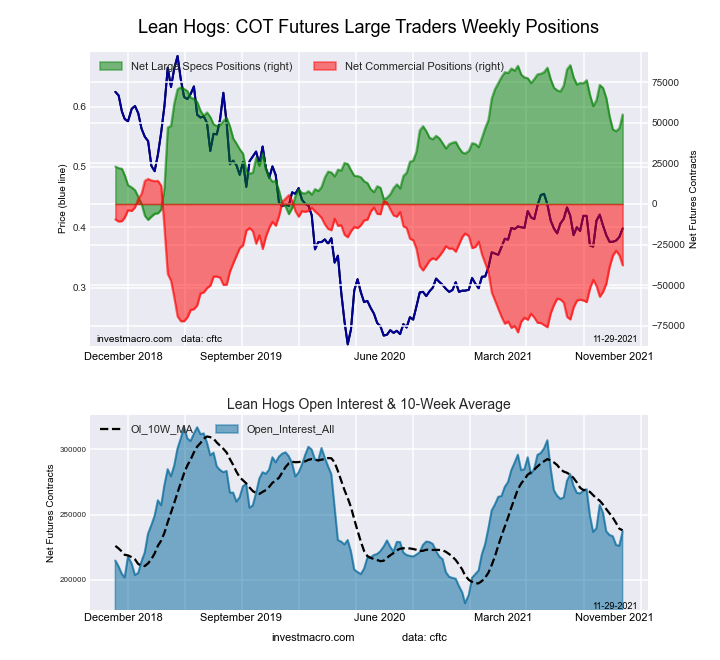 The LEAN HOGS large speculator standing this week equaled a net position of 55,193 contracts in the data reported through Tuesday. This was a weekly gain of 8,429 contracts from the previous week which had a total of 46,764 net contracts.
This week’s current strength score (the trader positioning range over the past three years, measured from 0 to 100) shows the speculators are currently Bullish with a score of 68.1 percent. The commercials are Bearish with a score of 43.7 percent and the small traders (not shown in chart) are Bearish-Extreme with a score of 0.1 percent.
| LEAN HOGS Futures Statistics | SPECULATORS | COMMERCIALS | SMALL TRADERS |
| – Percent of Open Interest Longs: | 39.8 | 33.0 | 7.4 |
| – Percent of Open Interest Shorts: | 16.5 | 48.9 | 14.7 |
| – Net Position: | 55,193 | -37,808 | -17,385 |
| – Gross Longs: | 94,433 | 78,278 | 17,465 |
| – Gross Shorts: | 39,240 | 116,086 | 34,850 |
| – Long to Short Ratio: | 2.4 to 1 | 0.7 to 1 | 0.5 to 1 |
| NET POSITION TREND: | |||
| – COT Index Score (3 Year Range Pct): | 68.1 | 43.7 | 0.1 |
| – COT Index Reading (3 Year Range): | Bullish | Bearish | Bearish-Extreme |
| NET POSITION MOVEMENT INDEX: | |||
| – 6-Week Change in Strength Index: | -17.1 | 17.3 | 0.1 |
COTTON Futures:
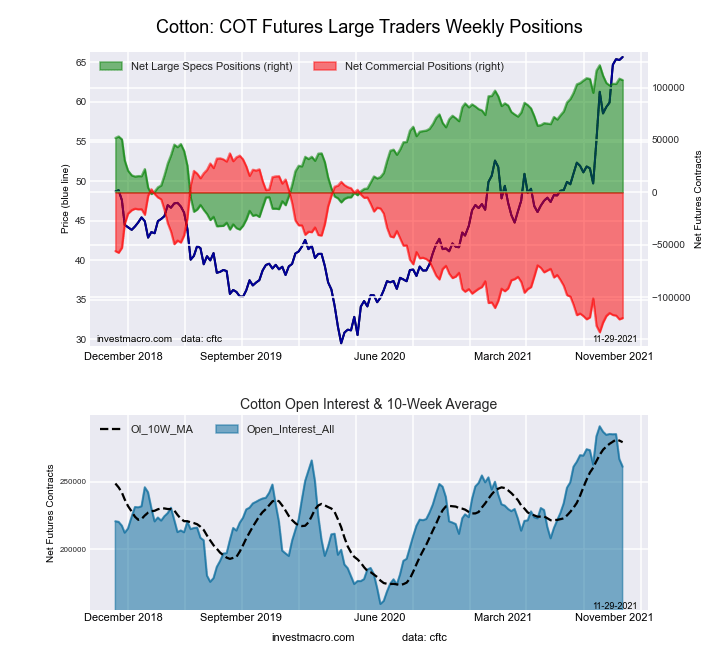 The COTTON large speculator standing this week equaled a net position of 107,111 contracts in the data reported through Tuesday. This was a weekly lowering of -1,330 contracts from the previous week which had a total of 108,441 net contracts.
This week’s current strength score (the trader positioning range over the past three years, measured from 0 to 100) shows the speculators are currently Bullish-Extreme with a score of 91.0 percent. The commercials are Bearish-Extreme with a score of 7.9 percent and the small traders (not shown in chart) are Bullish-Extreme with a score of 92.4 percent.
| COTTON Futures Statistics | SPECULATORS | COMMERCIALS | SMALL TRADERS |
| – Percent of Open Interest Longs: | 45.6 | 34.9 | 7.7 |
| – Percent of Open Interest Shorts: | 4.5 | 80.8 | 2.9 |
| – Net Position: | 107,111 | -119,746 | 12,635 |
| – Gross Longs: | 118,922 | 91,200 | 20,105 |
| – Gross Shorts: | 11,811 | 210,946 | 7,470 |
| – Long to Short Ratio: | 10.1 to 1 | 0.4 to 1 | 2.7 to 1 |
| NET POSITION TREND: | |||
| – COT Index Score (3 Year Range Pct): | 91.0 | 7.9 | 92.4 |
| – COT Index Reading (3 Year Range): | Bullish-Extreme | Bearish-Extreme | Bullish-Extreme |
| NET POSITION MOVEMENT INDEX: | |||
| – 6-Week Change in Strength Index: | -2.7 | 2.5 | -0.1 |
COCOA Futures:
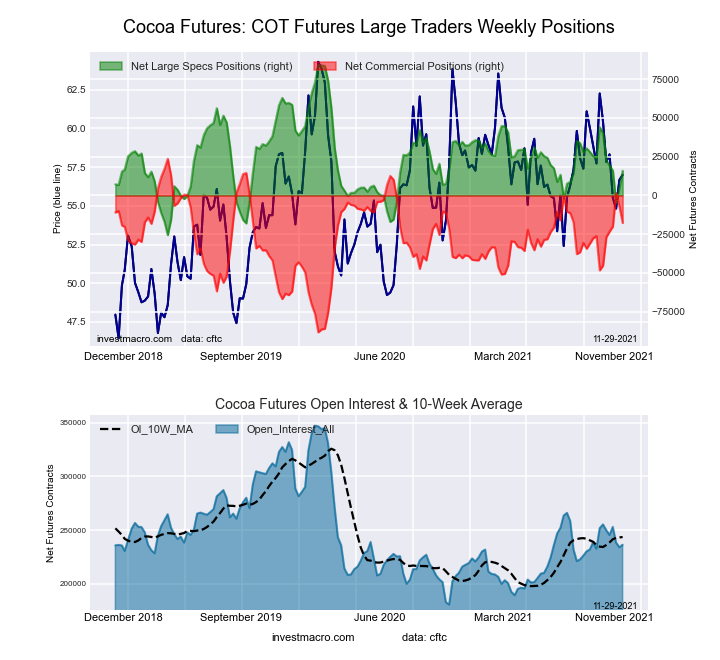 The COCOA large speculator standing this week equaled a net position of 15,925 contracts in the data reported through Tuesday. This was a weekly lift of 11,404 contracts from the previous week which had a total of 4,521 net contracts.
This week’s current strength score (the trader positioning range over the past three years, measured from 0 to 100) shows the speculators are currently Bearish with a score of 37.8 percent. The commercials are Bullish with a score of 63.1 percent and the small traders (not shown in chart) are Bearish with a score of 28.8 percent.
| COCOA Futures Statistics | SPECULATORS | COMMERCIALS | SMALL TRADERS |
| – Percent of Open Interest Longs: | 27.6 | 52.4 | 4.4 |
| – Percent of Open Interest Shorts: | 20.8 | 59.9 | 3.6 |
| – Net Position: | 15,925 | -17,710 | 1,785 |
| – Gross Longs: | 65,168 | 123,689 | 10,355 |
| – Gross Shorts: | 49,243 | 141,399 | 8,570 |
| – Long to Short Ratio: | 1.3 to 1 | 0.9 to 1 | 1.2 to 1 |
| NET POSITION TREND: | |||
| – COT Index Score (3 Year Range Pct): | 37.8 | 63.1 | 28.8 |
| – COT Index Reading (3 Year Range): | Bearish | Bullish | Bearish |
| NET POSITION MOVEMENT INDEX: | |||
| – 6-Week Change in Strength Index: | -22.2 | 24.7 | -37.5 |
WHEAT Futures:
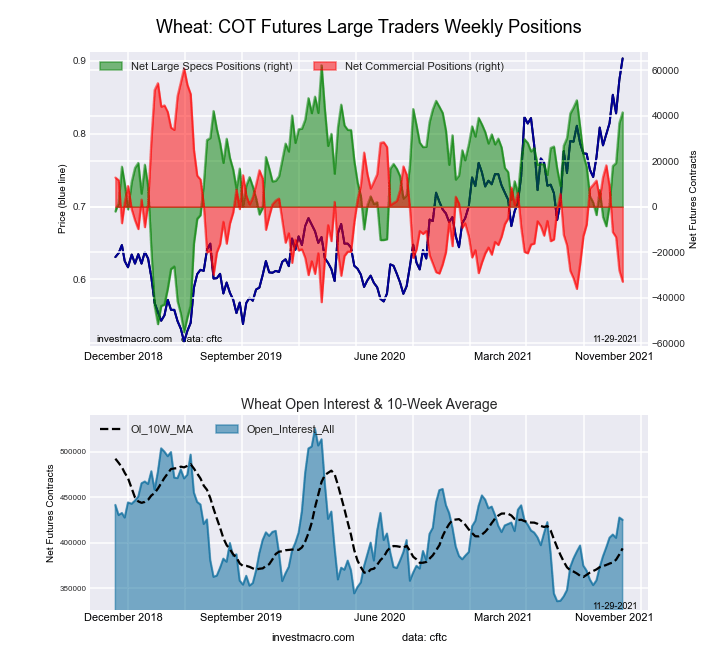 The WHEAT large speculator standing this week equaled a net position of 41,489 contracts in the data reported through Tuesday. This was a weekly boost of 4,728 contracts from the previous week which had a total of 36,761 net contracts.
This week’s current strength score (the trader positioning range over the past three years, measured from 0 to 100) shows the speculators are currently Bullish-Extreme with a score of 82.4 percent. The commercials are Bearish-Extreme with a score of 8.8 percent and the small traders (not shown in chart) are Bullish with a score of 60.7 percent.
| WHEAT Futures Statistics | SPECULATORS | COMMERCIALS | SMALL TRADERS |
| – Percent of Open Interest Longs: | 32.7 | 34.2 | 8.0 |
| – Percent of Open Interest Shorts: | 23.0 | 42.0 | 10.0 |
| – Net Position: | 41,489 | -32,939 | -8,550 |
| – Gross Longs: | 139,196 | 145,504 | 34,107 |
| – Gross Shorts: | 97,707 | 178,443 | 42,657 |
| – Long to Short Ratio: | 1.4 to 1 | 0.8 to 1 | 0.8 to 1 |
| NET POSITION TREND: | |||
| – COT Index Score (3 Year Range Pct): | 82.4 | 8.8 | 60.7 |
| – COT Index Reading (3 Year Range): | Bullish-Extreme | Bearish-Extreme | Bullish |
| NET POSITION MOVEMENT INDEX: | |||
| – 6-Week Change in Strength Index: | 39.2 | -44.7 | -0.5 |
Article By InvestMacro – Receive our weekly COT Reports by Email
*COT Report: The COT data, released weekly to the public each Friday, is updated through the most recent Tuesday (data is 3 days old) and shows a quick view of how large speculators or non-commercials (for-profit traders) were positioned in the futures markets.
The CFTC categorizes trader positions according to commercial hedgers (traders who use futures contracts for hedging as part of the business), non-commercials (large traders who speculate to realize trading profits) and nonreportable traders (usually small traders/speculators) as well as their open interest (contracts open in the market at time of reporting).See CFTC criteria here.

- COT Metals Charts: Speculator Bets led by Silver, Gold & Platinum Mar 7, 2026
- COT Bonds Charts: Speculator Bets led by 10-Year Bonds & Fed Funds Mar 7, 2026
- COT Energy Charts: Speculator Bets led by Brent Oil & Heating Oil Mar 7, 2026
- COT Soft Commodities Charts: Speculator Bets led by Corn & Soybean Meal Mar 7, 2026
- Investors run to safe-haven assets amid Middle East escalation Mar 6, 2026
- EUR/USD Under Pressure: Middle East Risks Outweigh All Else Mar 6, 2026
- Bitcoin shows resilience to Middle East events. Oil market stabilizes Mar 5, 2026
- GBP/USD: Market Not Expecting BoE Rate Cut in March Mar 5, 2026
- Brent headed for $100? Mar 4, 2026
- Global stock indices continue sell-off due to Middle East conflict Mar 4, 2026