
By InvestMacro | COT | Data Tables | COT Leaders | Downloads | COT Newsletter
Here are the latest charts and statistics for the Commitment of Traders (COT) data published by the Commodities Futures Trading Commission (CFTC) on Monday due to the Thanksgiving holiday last week.
The latest COT data is updated through Tuesday November 23rd 2021 and shows a quick view of how large traders (for-profit speculators and commercial entities) were positioned in the futures markets.
| Nov-23-2021 | OI | OI-Index | Spec-Net | Spec-Index | Com-Net | COM-Index | Smalls-Net | Smalls-Index |
|---|---|---|---|---|---|---|---|---|
| WTI Crude | 2,028,573 | 13 | 407,657 | 42 | -454,965 | 46 | 47,308 | 82 |
| Gold | 559,823 | 40 | 234,411 | 62 | -267,834 | 36 | 33,423 | 63 |
| Silver | 149,642 | 16 | 40,105 | 62 | -56,998 | 43 | 16,893 | 39 |
| Copper | 190,681 | 20 | 13,722 | 52 | -20,941 | 45 | 7,219 | 67 |
| Palladium | 10,078 | 16 | -1,766 | 9 | 1,913 | 91 | -147 | 36 |
| Platinum | 61,553 | 24 | 13,135 | 21 | -20,272 | 80 | 7,137 | 62 |
| Natural Gas | 1,280,907 | 38 | -137,255 | 37 | 97,333 | 62 | 39,922 | 80 |
| Brent | 206,668 | 45 | -14,522 | 95 | 7,811 | 1 | 6,711 | 100 |
| Heating Oil | 338,034 | 0 | 15,631 | 65 | -30,997 | 38 | 15,366 | 52 |
| Soybeans | 691,303 | 20 | 66,214 | 47 | -29,173 | 59 | -37,041 | 10 |
| Corn | 1,611,856 | 40 | 417,089 | 83 | -363,662 | 20 | -53,427 | 12 |
| Coffee | 272,527 | 38 | 67,904 | 98 | -71,494 | 4 | 3,590 | 13 |
| Sugar | 920,493 | 24 | 249,626 | 88 | -296,922 | 12 | 47,296 | 66 |
| Wheat | 425,301 | 47 | 41,489 | 82 | -32,939 | 9 | -8,550 | 61 |
WTI Crude Oil Futures:
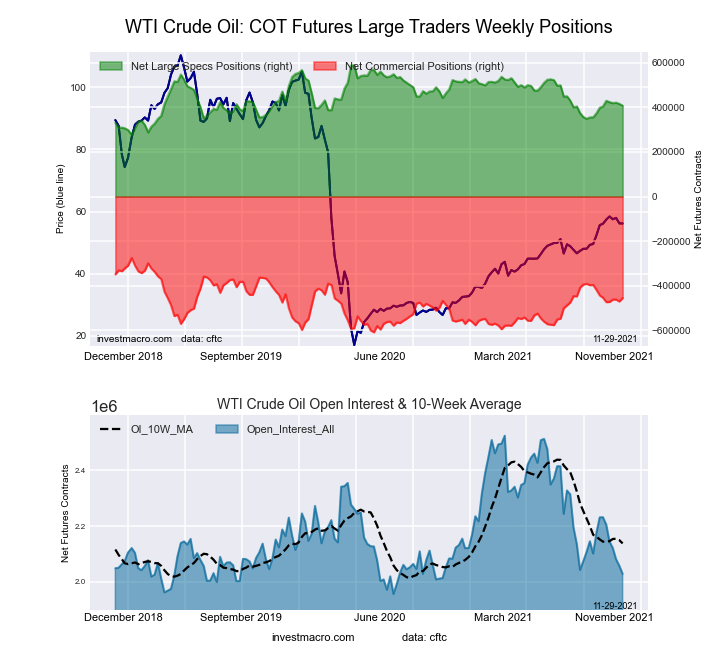 The WTI Crude Oil Futures large speculator standing this week reached a net position of 407,657 contracts in the data reported through Tuesday. This was a weekly decrease of -8,128 contracts from the previous week which had a total of 415,785 net contracts.
This week’s current strength score (the trader positioning range over the past three years, measured from 0 to 100) shows the speculators are currently Bearish with a score of 41.8 percent. The commercials are Bearish with a score of 46.1 percent and the small traders (not shown in chart) are Bullish-Extreme with a score of 81.7 percent.
Free Reports:
 Download Our Metatrader 4 Indicators – Put Our Free MetaTrader 4 Custom Indicators on your charts when you join our Weekly Newsletter
 Get our Weekly Commitment of Traders Reports - See where the biggest traders (Hedge Funds and Commercial Hedgers) are positioned in the futures markets on a weekly basis.
| WTI Crude Oil Futures Statistics | SPECULATORS | COMMERCIALS | SMALL TRADERS |
| – Percent of Open Interest Longs: | 25.2 | 35.2 | 4.8 |
| – Percent of Open Interest Shorts: | 5.1 | 57.6 | 2.4 |
| – Net Position: | 407,657 | -454,965 | 47,308 |
| – Gross Longs: | 510,586 | 713,989 | 96,613 |
| – Gross Shorts: | 102,929 | 1,168,954 | 49,305 |
| – Long to Short Ratio: | 5.0 to 1 | 0.6 to 1 | 2.0 to 1 |
| NET POSITION TREND: | |||
| – COT Index Score (3 Year Range Pct): | 41.8 | 46.1 | 81.7 |
| – COT Index Reading (3 Year Range): | Bearish | Bearish | Bullish-Extreme |
| NET POSITION MOVEMENT INDEX: | |||
| – 6-Week Change in Strength Index: | 0.9 | -0.4 | -2.3 |
Brent Crude Oil Futures:
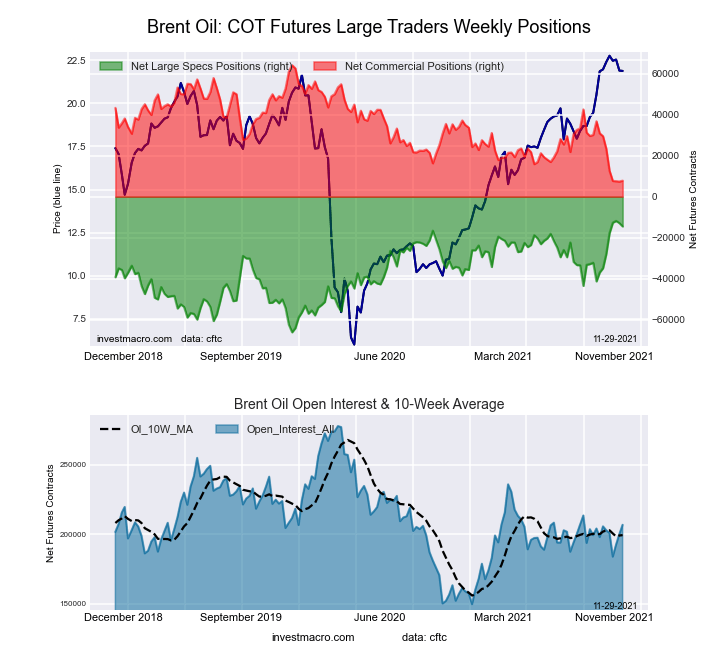 The Brent Crude Oil Futures large speculator standing this week reached a net position of -14,522 contracts in the data reported through Tuesday. This was a weekly decline of -1,622 contracts from the previous week which had a total of -12,900 net contracts.
This week’s current strength score (the trader positioning range over the past three years, measured from 0 to 100) shows the speculators are currently Bullish-Extreme with a score of 95.1 percent. The commercials are Bearish-Extreme with a score of 0.7 percent and the small traders (not shown in chart) are Bullish-Extreme with a score of 100.0 percent.
| Brent Crude Oil Futures Statistics | SPECULATORS | COMMERCIALS | SMALL TRADERS |
| – Percent of Open Interest Longs: | 19.8 | 41.1 | 5.4 |
| – Percent of Open Interest Shorts: | 26.8 | 37.3 | 2.2 |
| – Net Position: | -14,522 | 7,811 | 6,711 |
| – Gross Longs: | 40,872 | 84,910 | 11,253 |
| – Gross Shorts: | 55,394 | 77,099 | 4,542 |
| – Long to Short Ratio: | 0.7 to 1 | 1.1 to 1 | 2.5 to 1 |
| NET POSITION TREND: | |||
| – COT Index Score (3 Year Range Pct): | 95.1 | 0.7 | 100.0 |
| – COT Index Reading (3 Year Range): | Bullish-Extreme | Bearish-Extreme | Bullish-Extreme |
| NET POSITION MOVEMENT INDEX: | |||
| – 6-Week Change in Strength Index: | 37.5 | -38.3 | 12.6 |
Natural Gas Futures:
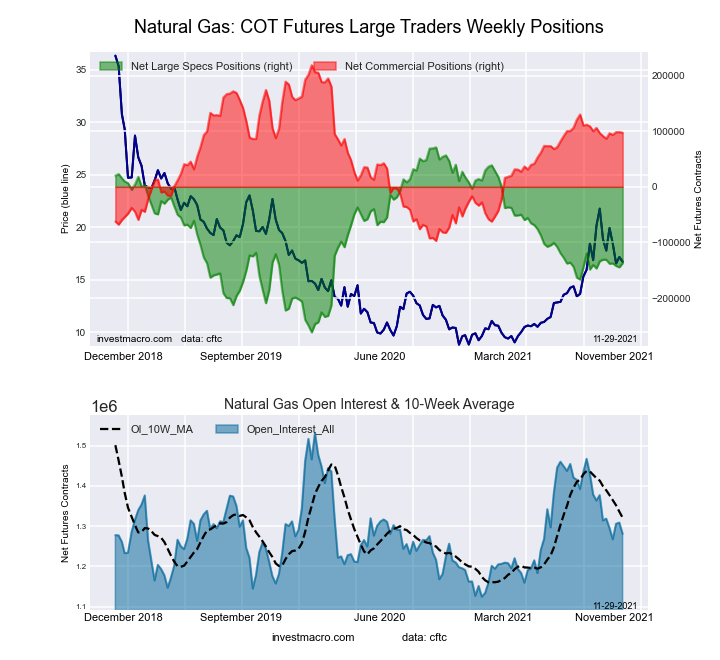 The Natural Gas Futures large speculator standing this week reached a net position of -137,255 contracts in the data reported through Tuesday. This was a weekly increase of 7,365 contracts from the previous week which had a total of -144,620 net contracts.
This week’s current strength score (the trader positioning range over the past three years, measured from 0 to 100) shows the speculators are currently Bearish with a score of 37.4 percent. The commercials are Bullish with a score of 61.6 percent and the small traders (not shown in chart) are Bullish-Extreme with a score of 80.1 percent.
| Natural Gas Futures Statistics | SPECULATORS | COMMERCIALS | SMALL TRADERS |
| – Percent of Open Interest Longs: | 19.3 | 43.6 | 4.8 |
| – Percent of Open Interest Shorts: | 30.0 | 36.0 | 1.7 |
| – Net Position: | -137,255 | 97,333 | 39,922 |
| – Gross Longs: | 247,059 | 558,259 | 61,756 |
| – Gross Shorts: | 384,314 | 460,926 | 21,834 |
| – Long to Short Ratio: | 0.6 to 1 | 1.2 to 1 | 2.8 to 1 |
| NET POSITION TREND: | |||
| – COT Index Score (3 Year Range Pct): | 37.4 | 61.6 | 80.1 |
| – COT Index Reading (3 Year Range): | Bearish | Bullish | Bullish-Extreme |
| NET POSITION MOVEMENT INDEX: | |||
| – 6-Week Change in Strength Index: | -1.9 | 1.9 | 0.6 |
Gasoline Blendstock Futures:
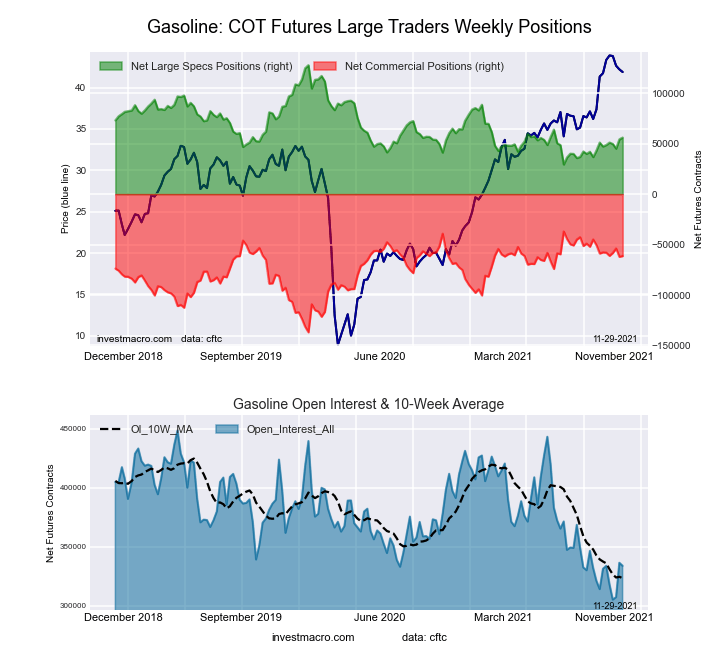 The Gasoline Blendstock Futures large speculator standing this week reached a net position of 55,994 contracts in the data reported through Tuesday. This was a weekly lift of 1,780 contracts from the previous week which had a total of 54,214 net contracts.
This week’s current strength score (the trader positioning range over the past three years, measured from 0 to 100) shows the speculators are currently Bearish with a score of 27.1 percent. The commercials are Bullish with a score of 75.6 percent and the small traders (not shown in chart) are Bearish with a score of 43.7 percent.
| Nasdaq Mini Futures Statistics | SPECULATORS | COMMERCIALS | SMALL TRADERS |
| – Percent of Open Interest Longs: | 32.5 | 45.4 | 6.2 |
| – Percent of Open Interest Shorts: | 15.7 | 63.8 | 4.6 |
| – Net Position: | 55,994 | -61,376 | 5,382 |
| – Gross Longs: | 108,575 | 151,563 | 20,636 |
| – Gross Shorts: | 52,581 | 212,939 | 15,254 |
| – Long to Short Ratio: | 2.1 to 1 | 0.7 to 1 | 1.4 to 1 |
| NET POSITION TREND: | |||
| – COT Index Score (3 Year Range Pct): | 27.1 | 75.6 | 43.7 |
| – COT Index Reading (3 Year Range): | Bearish | Bullish | Bearish |
| NET POSITION MOVEMENT INDEX: | |||
| – 6-Week Change in Strength Index: | 8.9 | -3.6 | -31.0 |
#2 Heating Oil NY-Harbor Futures:
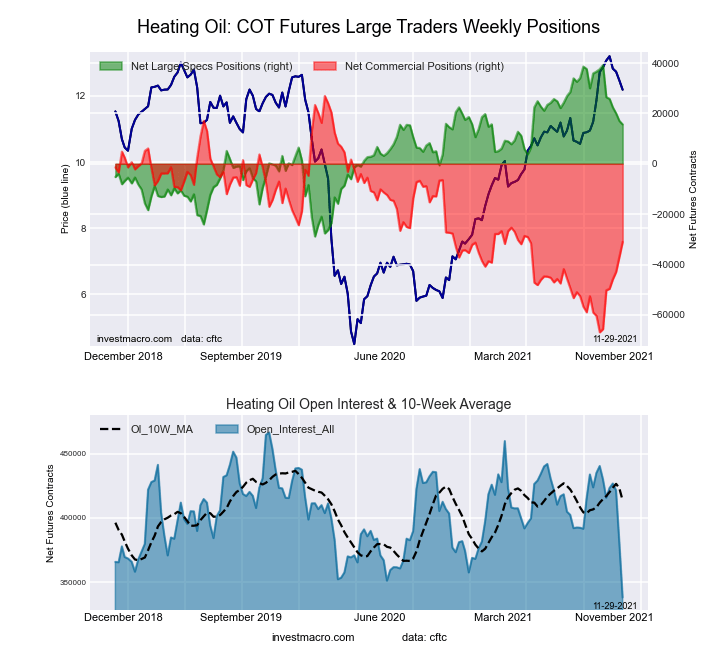 The #2 Heating Oil NY-Harbor Futures large speculator standing this week reached a net position of 15,631 contracts in the data reported through Tuesday. This was a weekly decrease of -1,398 contracts from the previous week which had a total of 17,029 net contracts.
This week’s current strength score (the trader positioning range over the past three years, measured from 0 to 100) shows the speculators are currently Bullish with a score of 65.4 percent. The commercials are Bearish with a score of 38.3 percent and the small traders (not shown in chart) are Bullish with a score of 51.6 percent.
| Heating Oil Futures Statistics | SPECULATORS | COMMERCIALS | SMALL TRADERS |
| – Percent of Open Interest Longs: | 14.9 | 48.5 | 13.0 |
| – Percent of Open Interest Shorts: | 10.3 | 57.6 | 8.4 |
| – Net Position: | 15,631 | -30,997 | 15,366 |
| – Gross Longs: | 50,383 | 163,853 | 43,785 |
| – Gross Shorts: | 34,752 | 194,850 | 28,419 |
| – Long to Short Ratio: | 1.4 to 1 | 0.8 to 1 | 1.5 to 1 |
| NET POSITION TREND: | |||
| – COT Index Score (3 Year Range Pct): | 65.4 | 38.3 | 51.6 |
| – COT Index Reading (3 Year Range): | Bullish | Bearish | Bullish |
| NET POSITION MOVEMENT INDEX: | |||
| – 6-Week Change in Strength Index: | -34.6 | 36.9 | -38.6 |
Bloomberg Commodity Index Futures:
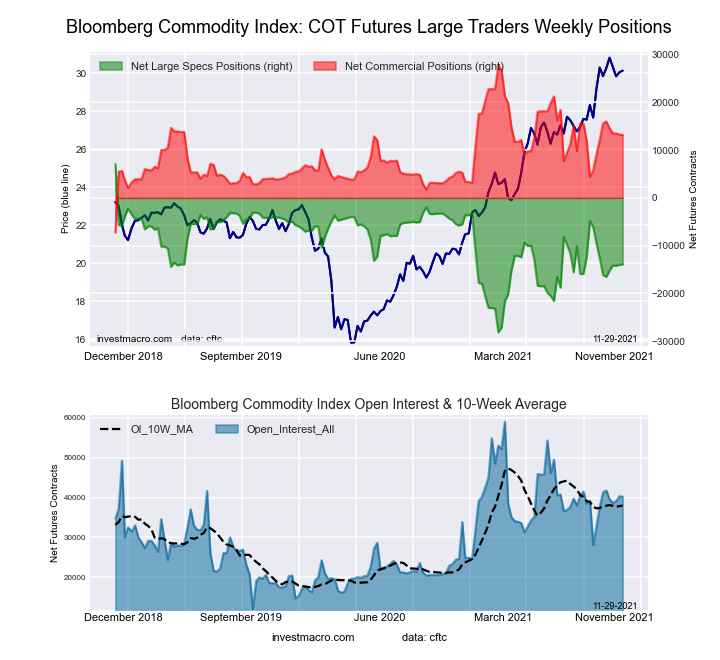 The Bloomberg Commodity Index Futures large speculator standing this week reached a net position of -13,927 contracts in the data reported through Tuesday. This was a weekly boost of 46 contracts from the previous week which had a total of -13,973 net contracts.
This week’s current strength score (the trader positioning range over the past three years, measured from 0 to 100) shows the speculators are currently Bearish with a score of 40.3 percent. The commercials are Bullish with a score of 58.5 percent and the small traders (not shown in chart) are Bullish with a score of 56.0 percent.
| Bloomberg Index Futures Statistics | SPECULATORS | COMMERCIALS | SMALL TRADERS |
| – Percent of Open Interest Longs: | 55.7 | 37.8 | 1.9 |
| – Percent of Open Interest Shorts: | 90.3 | 5.0 | 0.1 |
| – Net Position: | -13,927 | 13,206 | 721 |
| – Gross Longs: | 22,440 | 15,222 | 777 |
| – Gross Shorts: | 36,367 | 2,016 | 56 |
| – Long to Short Ratio: | 0.6 to 1 | 7.6 to 1 | 13.9 to 1 |
| NET POSITION TREND: | |||
| – COT Index Score (3 Year Range Pct): | 40.3 | 58.5 | 56.0 |
| – COT Index Reading (3 Year Range): | Bearish | Bullish | Bullish |
| NET POSITION MOVEMENT INDEX: | |||
| – 6-Week Change in Strength Index: | 6.2 | -6.8 | 8.7 |
Article By InvestMacro – Receive our weekly COT Reports by Email
*COT Report: The COT data, released weekly to the public each Friday, is updated through the most recent Tuesday (data is 3 days old) and shows a quick view of how large speculators or non-commercials (for-profit traders) were positioned in the futures markets.
The CFTC categorizes trader positions according to commercial hedgers (traders who use futures contracts for hedging as part of the business), non-commercials (large traders who speculate to realize trading profits) and nonreportable traders (usually small traders/speculators) as well as their open interest (contracts open in the market at time of reporting).See CFTC criteria here.

- COT Metals Charts: Speculator Bets led by Silver, Gold & Platinum Mar 7, 2026
- COT Bonds Charts: Speculator Bets led by 10-Year Bonds & Fed Funds Mar 7, 2026
- COT Energy Charts: Speculator Bets led by Brent Oil & Heating Oil Mar 7, 2026
- COT Soft Commodities Charts: Speculator Bets led by Corn & Soybean Meal Mar 7, 2026
- Investors run to safe-haven assets amid Middle East escalation Mar 6, 2026
- EUR/USD Under Pressure: Middle East Risks Outweigh All Else Mar 6, 2026
- Bitcoin shows resilience to Middle East events. Oil market stabilizes Mar 5, 2026
- GBP/USD: Market Not Expecting BoE Rate Cut in March Mar 5, 2026
- Brent headed for $100? Mar 4, 2026
- Global stock indices continue sell-off due to Middle East conflict Mar 4, 2026