By InvestMacro COT Home | Data Tables | Data Downloads | COT Newsletter
Here are the latest charts and statistics for the Commitment of Traders (COT) data published by the Commodities Futures Trading Commission (CFTC).
The latest COT data is updated through Tuesday October 5th 2021 and shows a quick view of how large traders (for-profit speculators and commercial entities) were positioned in the futures markets.
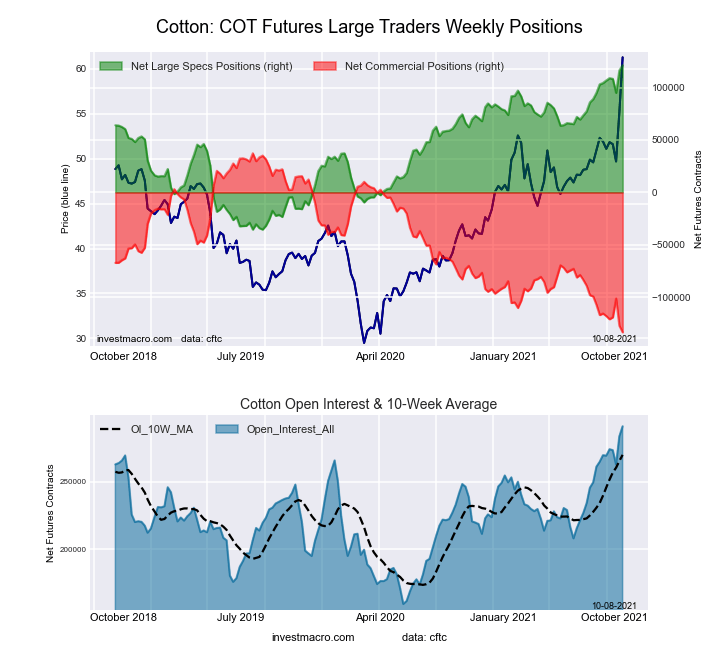
Cotton speculative positions continued to draw higher this week with a gain of +5,154 contracts. This is the eleventh rise in the past thirteen weeks to bring the speculator level to over a 3-year high dating back to June 12th of 2018. Cotton prices have been surging as well with prices reaching the highest thresholds since 2011. Needless to say that the Cotton Speculator Strength Index is currently at a 100 percent score again this week (meaning the highest level of bullish speculator positioning over the past three-year range). Joining Cotton with bullish-extreme strength readings this week are Lean Hogs, COFFEE and Sugar among the soft commodities.
| Oct-05-2021 | OI | OI-Index | Spec-Net | Spec-Index | Com-Net | COM-Index | Smalls-Net | Smalls-Index |
|---|---|---|---|---|---|---|---|---|
| WTI Crude | 2,230,794 | 48 | 398,307 | 39 | -443,259 | 50 | 44,952 | 78 |
| Gold | 483,789 | 21 | 182,582 | 53 | -203,702 | 47 | 21,120 | 31 |
| Silver | 139,763 | 7 | 16,379 | 39 | -27,778 | 72 | 11,399 | 6 |
| Copper | 185,655 | 16 | 14,417 | 53 | -18,918 | 46 | 4,501 | 51 |
| Palladium | 9,705 | 14 | -3,230 | 0 | 3,510 | 99 | -280 | 28 |
| Platinum | 62,109 | 25 | 5,515 | 10 | -10,403 | 94 | 4,888 | 30 |
| Natural Gas | 1,376,788 | 50 | -133,708 | 38 | 96,637 | 61 | 37,071 | 73 |
| Brent | 197,795 | 38 | -37,021 | 51 | 30,935 | 42 | 6,086 | 89 |
| Heating Oil | 440,286 | 77 | 37,548 | 92 | -66,885 | 0 | 29,337 | 100 |
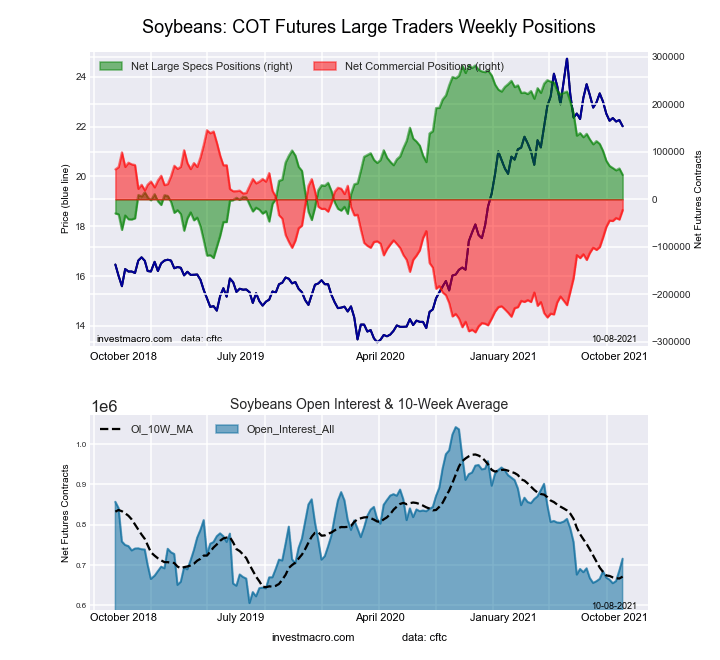
| Soybeans | 715,835 | 25 | 51,401 | 43 | -22,592 | 61 | -28,809 | 24 |
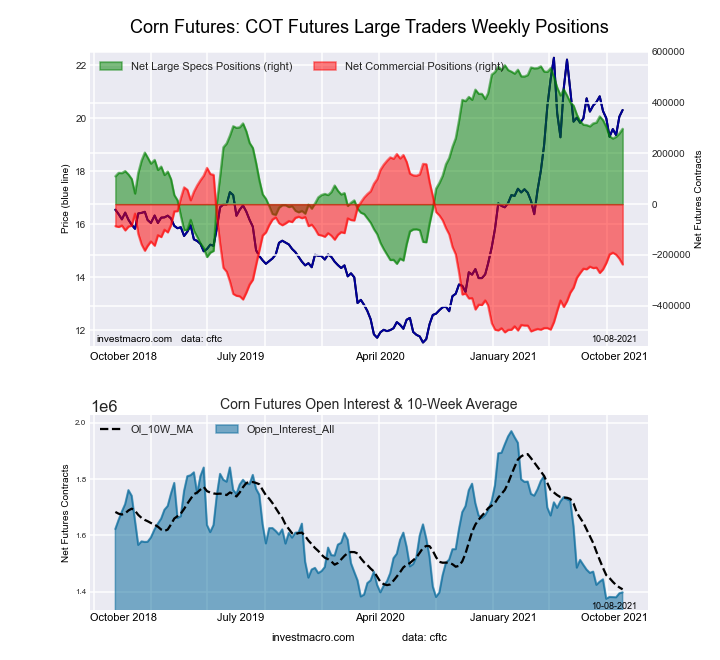
| Corn | 1,397,458 | 4 | 297,005 | 68 | -237,593 | 38 | -59,412 | 9 |
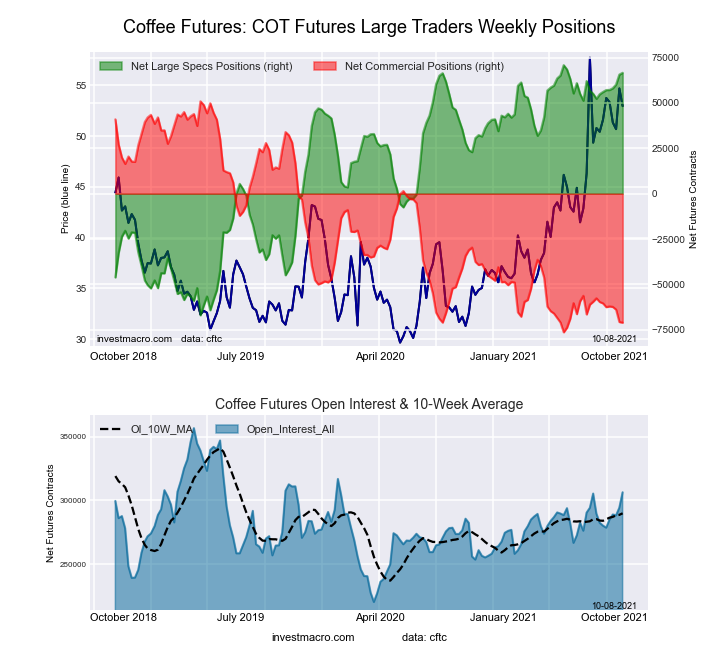
| Coffee | 306,363 | 63 | 66,571 | 97 | -71,022 | 4 | 4,451 | 19 |
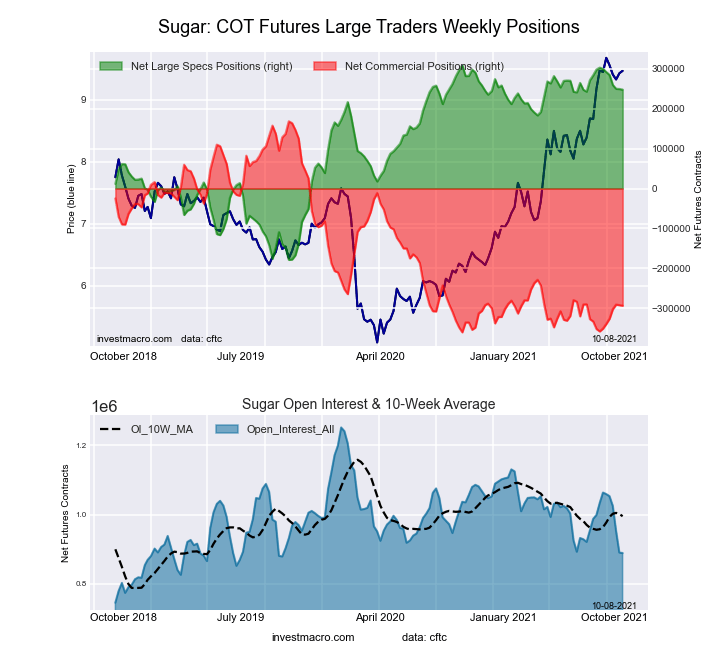
| Sugar | 888,354 | 28 | 247,375 | 87 | -293,135 | 13 | 45,760 | 64 |
| Wheat | 373,320 | 17 | 7,312 | 53 | 3,695 | 44 | -11,007 | 49 |
Free Reports:
This week’s current strength score (the trader positioning range over the past three years, measured from 0 to 100) shows the speculators are currently Bullish with a score of 68.0 percent. The commercials are Bearish with a score of 38.1 percent and the small traders (not shown in chart) are Bearish-Extreme with a score of 8.9 percent.
| CORN Futures Statistics | SPECULATORS | COMMERCIALS | SMALL TRADERS |
| – Percent of Open Interest Longs: | 29.4 | 48.0 | 9.0 |
| – Percent of Open Interest Shorts: | 8.1 | 65.0 | 13.3 |
| – Net Position: | 297,005 | -237,593 | -59,412 |
| – Gross Longs: | 410,799 | 670,303 | 126,389 |
| – Gross Shorts: | 113,794 | 907,896 | 185,801 |
| – Long to Short Ratio: | 3.6 to 1 | 0.7 to 1 | 0.7 to 1 |
| NET POSITION TREND: | |||
| – COT Index Score (3 Year Range Pct): | 68.0 | 38.1 | 8.9 |
| – COT Index Reading (3 Year Range): | Bullish | Bearish | Bearish-Extreme |
| NET POSITION MOVEMENT INDEX: | |||
| – 6-Week Change in Strength Index: | -4.3 | 2.7 | 8.5 |
This week’s current strength score (the trader positioning range over the past three years, measured from 0 to 100) shows the speculators are currently Bullish-Extreme with a score of 87.5 percent. The commercials are Bearish-Extreme with a score of 12.6 percent and the small traders (not shown in chart) are Bullish with a score of 64.4 percent.
| SUGAR Futures Statistics | SPECULATORS | COMMERCIALS | SMALL TRADERS |
| – Percent of Open Interest Longs: | 33.4 | 41.9 | 10.0 |
| – Percent of Open Interest Shorts: | 5.6 | 74.9 | 4.8 |
| – Net Position: | 247,375 | -293,135 | 45,760 |
| – Gross Longs: | 296,884 | 372,006 | 88,637 |
| – Gross Shorts: | 49,509 | 665,141 | 42,877 |
| – Long to Short Ratio: | 6.0 to 1 | 0.6 to 1 | 2.1 to 1 |
| NET POSITION TREND: | |||
| – COT Index Score (3 Year Range Pct): | 87.5 | 12.6 | 64.4 |
| – COT Index Reading (3 Year Range): | Bullish-Extreme | Bearish-Extreme | Bullish |
| NET POSITION MOVEMENT INDEX: | |||
| – 6-Week Change in Strength Index: | -10.6 | 10.9 | -6.9 |
This week’s current strength score (the trader positioning range over the past three years, measured from 0 to 100) shows the speculators are currently Bullish-Extreme with a score of 96.9 percent. The commercials are Bearish-Extreme with a score of 4.2 percent and the small traders (not shown in chart) are Bearish-Extreme with a score of 19.1 percent.
| COFFEE Futures Statistics | SPECULATORS | COMMERCIALS | SMALL TRADERS |
| – Percent of Open Interest Longs: | 27.6 | 39.6 | 3.8 |
| – Percent of Open Interest Shorts: | 5.9 | 62.8 | 2.4 |
| – Net Position: | 66,571 | -71,022 | 4,451 |
| – Gross Longs: | 84,602 | 121,365 | 11,705 |
| – Gross Shorts: | 18,031 | 192,387 | 7,254 |
| – Long to Short Ratio: | 4.7 to 1 | 0.6 to 1 | 1.6 to 1 |
| NET POSITION TREND: | |||
| – COT Index Score (3 Year Range Pct): | 96.9 | 4.2 | 19.1 |
| – COT Index Reading (3 Year Range): | Bullish-Extreme | Bearish-Extreme | Bearish-Extreme |
| NET POSITION MOVEMENT INDEX: | |||
| – 6-Week Change in Strength Index: | 7.7 | -8.4 | 0.5 |
This week’s current strength score (the trader positioning range over the past three years, measured from 0 to 100) shows the speculators are currently Bearish with a score of 43.1 percent. The commercials are Bullish with a score of 60.5 percent and the small traders (not shown in chart) are Bearish with a score of 23.9 percent.
| SOYBEANS Futures Statistics | SPECULATORS | COMMERCIALS | SMALL TRADERS |
| – Percent of Open Interest Longs: | 19.2 | 56.2 | 6.7 |
| – Percent of Open Interest Shorts: | 12.0 | 59.4 | 10.8 |
| – Net Position: | 51,401 | -22,592 | -28,809 |
| – Gross Longs: | 137,547 | 402,376 | 48,264 |
| – Gross Shorts: | 86,146 | 424,968 | 77,073 |
| – Long to Short Ratio: | 1.6 to 1 | 0.9 to 1 | 0.6 to 1 |
| NET POSITION TREND: | |||
| – COT Index Score (3 Year Range Pct): | 43.1 | 60.5 | 23.9 |
| – COT Index Reading (3 Year Range): | Bearish | Bullish | Bearish |
| NET POSITION MOVEMENT INDEX: | |||
| – 6-Week Change in Strength Index: | -12.4 | 13.6 | -12.6 |
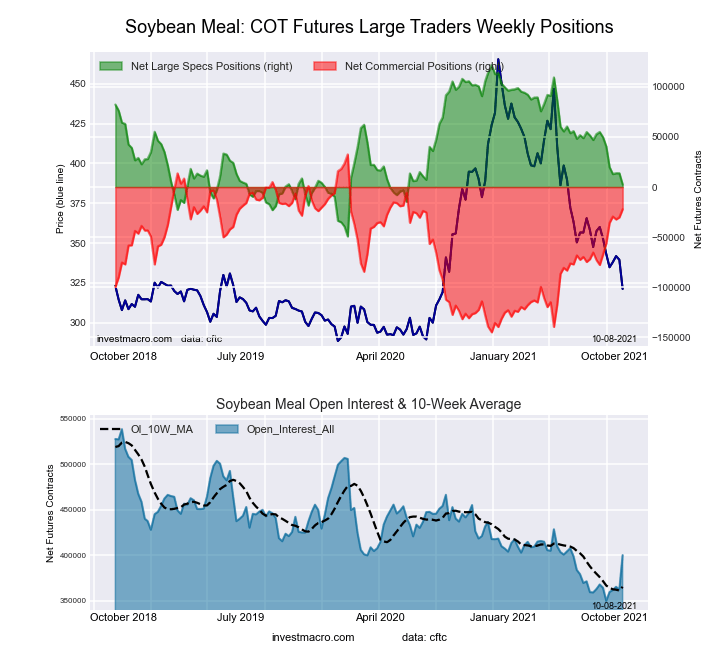
This week’s current strength score (the trader positioning range over the past three years, measured from 0 to 100) shows the speculators are currently Bearish with a score of 30.3 percent. The commercials are Bullish with a score of 69.2 percent and the small traders (not shown in chart) are Bearish with a score of 49.5 percent.
| SOYBEAN MEAL Futures Statistics | SPECULATORS | COMMERCIALS | SMALL TRADERS |
| – Percent of Open Interest Longs: | 20.1 | 49.0 | 11.9 |
| – Percent of Open Interest Shorts: | 19.5 | 54.6 | 7.0 |
| – Net Position: | 2,462 | -22,153 | 19,691 |
| – Gross Longs: | 80,454 | 196,027 | 47,656 |
| – Gross Shorts: | 77,992 | 218,180 | 27,965 |
| – Long to Short Ratio: | 1.0 to 1 | 0.9 to 1 | 1.7 to 1 |
| NET POSITION TREND: | |||
| – COT Index Score (3 Year Range Pct): | 30.3 | 69.2 | 49.5 |
| – COT Index Reading (3 Year Range): | Bearish | Bullish | Bearish |
| NET POSITION MOVEMENT INDEX: | |||
| – 6-Week Change in Strength Index: | -27.6 | 25.5 | 8.0 |
This week’s current strength score (the trader positioning range over the past three years, measured from 0 to 100) shows the speculators are currently Bearish-Extreme with a score of 11.7 percent. The commercials are Bullish-Extreme with a score of 84.3 percent and the small traders (not shown in chart) are Bullish with a score of 74.6 percent.
| LIVE CATTLE Futures Statistics | SPECULATORS | COMMERCIALS | SMALL TRADERS |
| – Percent of Open Interest Longs: | 30.7 | 44.9 | 10.8 |
| – Percent of Open Interest Shorts: | 19.0 | 54.8 | 12.6 |
| – Net Position: | 33,852 | -28,700 | -5,152 |
| – Gross Longs: | 88,928 | 130,125 | 31,412 |
| – Gross Shorts: | 55,076 | 158,825 | 36,564 |
| – Long to Short Ratio: | 1.6 to 1 | 0.8 to 1 | 0.9 to 1 |
| NET POSITION TREND: | |||
| – COT Index Score (3 Year Range Pct): | 11.7 | 84.3 | 74.6 |
| – COT Index Reading (3 Year Range): | Bearish-Extreme | Bullish-Extreme | Bullish |
| NET POSITION MOVEMENT INDEX: | |||
| – 6-Week Change in Strength Index: | -41.9 | 42.5 | 26.7 |
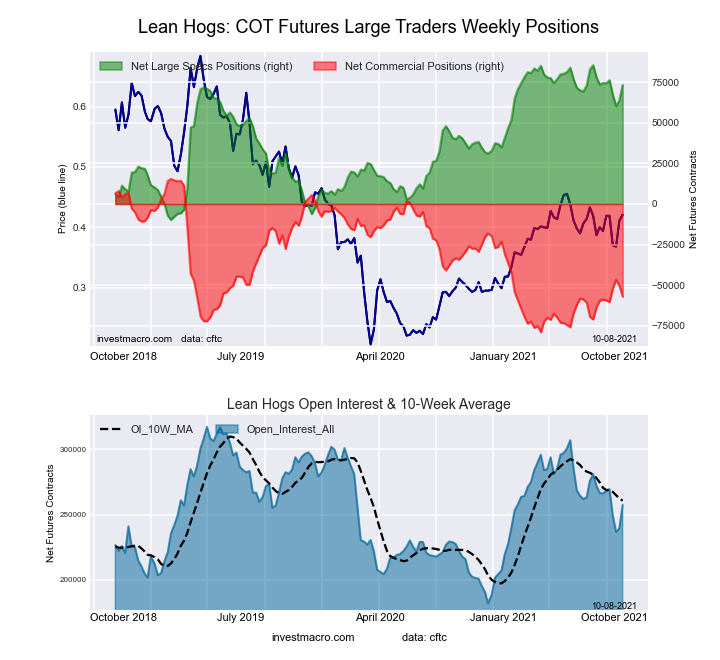
This week’s current strength score (the trader positioning range over the past three years, measured from 0 to 100) shows the speculators are currently Bullish-Extreme with a score of 87.2 percent. The commercials are Bearish with a score of 23.2 percent and the small traders (not shown in chart) are Bearish-Extreme with a score of 0.7 percent.
| LEAN HOGS Futures Statistics | SPECULATORS | COMMERCIALS | SMALL TRADERS |
| – Percent of Open Interest Longs: | 42.7 | 30.0 | 7.3 |
| – Percent of Open Interest Shorts: | 14.2 | 52.2 | 13.7 |
| – Net Position: | 73,429 | -57,148 | -16,281 |
| – Gross Longs: | 109,947 | 77,177 | 18,907 |
| – Gross Shorts: | 36,518 | 134,325 | 35,188 |
| – Long to Short Ratio: | 3.0 to 1 | 0.6 to 1 | 0.5 to 1 |
| NET POSITION TREND: | |||
| – COT Index Score (3 Year Range Pct): | 87.2 | 23.2 | 0.7 |
| – COT Index Reading (3 Year Range): | Bullish-Extreme | Bearish | Bearish-Extreme |
| NET POSITION MOVEMENT INDEX: | |||
| – 6-Week Change in Strength Index: | -1.3 | 1.9 | -2.8 |
This week’s current strength score (the trader positioning range over the past three years, measured from 0 to 100) shows the speculators are currently Bullish-Extreme with a score of 100.0 percent. The commercials are Bearish-Extreme with a score of 0.0 percent and the small traders (not shown in chart) are Bullish-Extreme with a score of 88.5 percent.
| COTTON Futures Statistics | SPECULATORS | COMMERCIALS | SMALL TRADERS |
| – Percent of Open Interest Longs: | 46.2 | 32.9 | 7.3 |
| – Percent of Open Interest Shorts: | 4.5 | 78.7 | 3.2 |
| – Net Position: | 121,286 | -133,285 | 11,999 |
| – Gross Longs: | 134,307 | 95,687 | 21,371 |
| – Gross Shorts: | 13,021 | 228,972 | 9,372 |
| – Long to Short Ratio: | 10.3 to 1 | 0.4 to 1 | 2.3 to 1 |
| NET POSITION TREND: | |||
| – COT Index Score (3 Year Range Pct): | 100.0 | 0.0 | 88.5 |
| – COT Index Reading (3 Year Range): | Bullish-Extreme | Bearish-Extreme | Bullish-Extreme |
| NET POSITION MOVEMENT INDEX: | |||
| – 6-Week Change in Strength Index: | 10.8 | -10.5 | 5.4 |
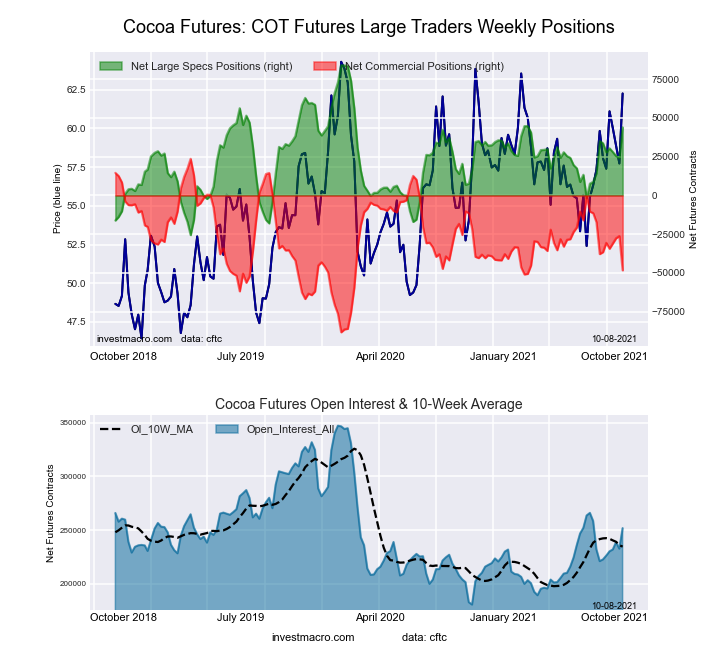
This week’s current strength score (the trader positioning range over the past three years, measured from 0 to 100) shows the speculators are currently Bullish with a score of 63.5 percent. The commercials are Bearish with a score of 35.7 percent and the small traders (not shown in chart) are Bullish with a score of 57.4 percent.
| COCOA Futures Statistics | SPECULATORS | COMMERCIALS | SMALL TRADERS |
| – Percent of Open Interest Longs: | 31.5 | 46.4 | 4.9 |
| – Percent of Open Interest Shorts: | 14.0 | 65.6 | 3.2 |
| – Net Position: | 43,997 | -48,301 | 4,304 |
| – Gross Longs: | 79,217 | 116,792 | 12,283 |
| – Gross Shorts: | 35,220 | 165,093 | 7,979 |
| – Long to Short Ratio: | 2.2 to 1 | 0.7 to 1 | 1.5 to 1 |
| NET POSITION TREND: | |||
| – COT Index Score (3 Year Range Pct): | 63.5 | 35.7 | 57.4 |
| – COT Index Reading (3 Year Range): | Bullish | Bearish | Bullish |
| NET POSITION MOVEMENT INDEX: | |||
| – 6-Week Change in Strength Index: | 9.4 | -10.5 | 15.7 |
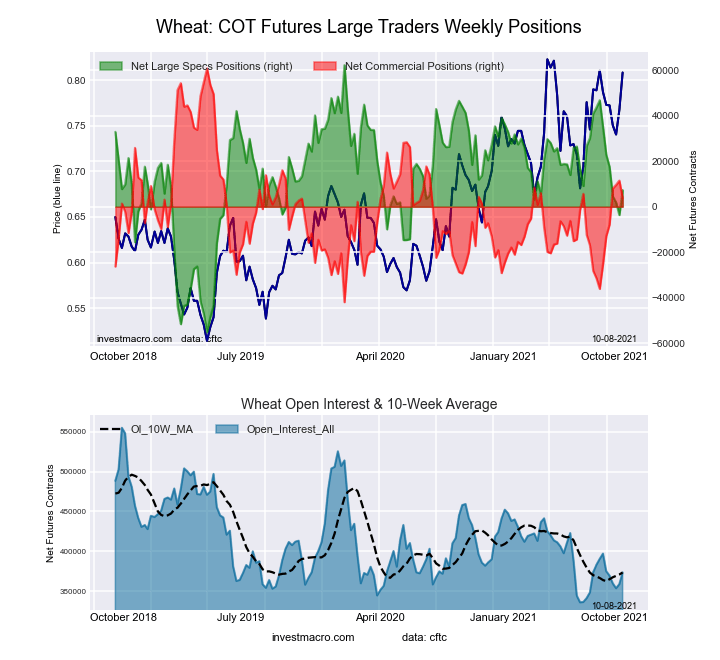
This week’s current strength score (the trader positioning range over the past three years, measured from 0 to 100) shows the speculators are currently Bullish with a score of 53.2 percent. The commercials are Bearish with a score of 44.4 percent and the small traders (not shown in chart) are Bearish with a score of 49.0 percent.
| WHEAT Futures Statistics | SPECULATORS | COMMERCIALS | SMALL TRADERS |
| – Percent of Open Interest Longs: | 25.8 | 41.2 | 8.1 |
| – Percent of Open Interest Shorts: | 23.8 | 40.2 | 11.0 |
| – Net Position: | 7,312 | 3,695 | -11,007 |
| – Gross Longs: | 96,203 | 153,942 | 30,210 |
| – Gross Shorts: | 88,891 | 150,247 | 41,217 |
| – Long to Short Ratio: | 1.1 to 1 | 1.0 to 1 | 0.7 to 1 |
| NET POSITION TREND: | |||
| – COT Index Score (3 Year Range Pct): | 53.2 | 44.4 | 49.0 |
| – COT Index Reading (3 Year Range): | Bullish | Bearish | Bearish |
| NET POSITION MOVEMENT INDEX: | |||
| – 6-Week Change in Strength Index: | -23.6 | 28.1 | -5.6 |
Article By InvestMacro.com – Receive our weekly COT Reports by Email
*COT Report: The COT data, released weekly to the public each Friday, is updated through the most recent Tuesday (data is 3 days old) and shows a quick view of how large speculators or non-commercials (for-profit traders) were positioned in the futures markets.
The CFTC categorizes trader positions according to commercial hedgers (traders who use futures contracts for hedging as part of the business), non-commercials (large traders who speculate to realize trading profits) and nonreportable traders (usually small traders/speculators).
Find CFTC criteria here: (http://www.cftc.gov/MarketReports/CommitmentsofTraders/ExplanatoryNotes/index.htm).
By JustMarkets The US stock indices started the week on a downbeat note. By the…
By Analytical Department RoboForex GBP/USD fell to 1.3437 on Tuesday as investors assessed the appointment…
By JustMarkets The US stock indices ended Friday’s session in the red. By the end…
By Analytical Department RoboForex USD/JPY opens the week at 162.36 on Monday. The Japanese yen…
By InvestMacro Here are the latest charts and statistics for the Commitment of Traders (COT)…
By InvestMacro The latest update for the weekly Commitment of Traders (COT) report was released…
This website uses cookies.