
By CountingPips.com COT Home | Data Tables | Data Downloads | Newsletter
Here are the latest charts and statistics for the Commitment of Traders (COT) data published by the Commodities Futures Trading Commission (CFTC).
The latest COT data is updated through Tuesday September 28th 2021 and shows a quick view of how large traders (for-profit speculators and commercial entities) were positioned in the futures markets.
3-Month Eurodollars Futures:
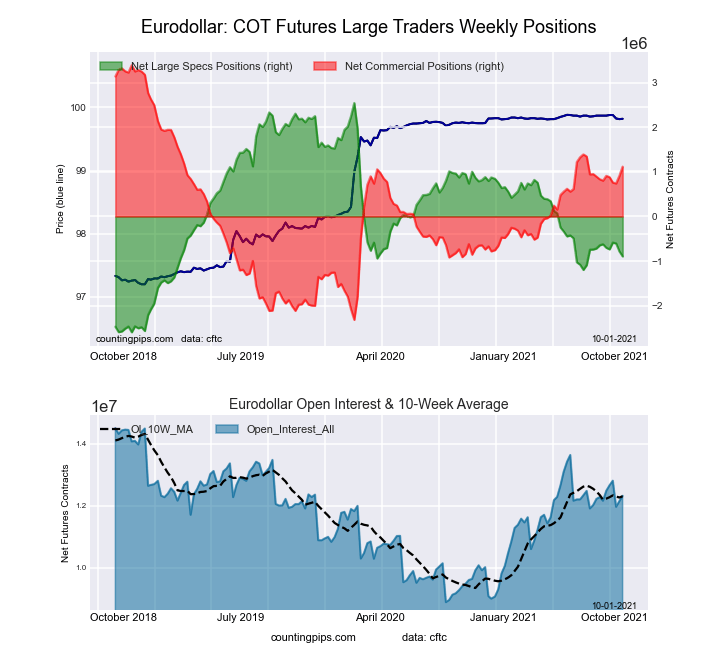 The 3-Month Eurodollars large speculator standing this week came in at a net position of -895,030 contracts in the data reported through Tuesday. This was a weekly decrease of -112,756 contracts from the previous week which had a total of -782,274 net contracts.
This week’s current strength score (the trader positioning range over the past three years, measured from 0 to 100) shows the speculators are currently Bearish with a score of 33.1 percent. The commercials are Bullish with a score of 60.1 percent and the small traders (not shown in chart) are Bullish with a score of 74.1 percent.
| 3-Month Eurodollars Statistics | SPECULATORS | COMMERCIALS | SMALL TRADERS |
| – Percent of Open Interest Longs: | 12.6 | 61.5 | 4.9 |
| – Percent of Open Interest Shorts: | 19.8 | 52.4 | 6.7 |
| – Net Position: | -895,030 | 1,115,947 | -220,917 |
| – Gross Longs: | 1,548,154 | 7,569,799 | 603,270 |
| – Gross Shorts: | 2,443,184 | 6,453,852 | 824,187 |
| – Long to Short Ratio: | 0.6 to 1 | 1.2 to 1 | 0.7 to 1 |
| NET POSITION TREND: | |||
| – COT Index Score (3 Year Range Pct): | 33.1 | 60.1 | 74.1 |
| – COT Index Reading (3 Year Range): | Bearish | Bullish | Bullish |
| NET POSITION MOVEMENT INDEX: | |||
| – 6-Week Change in Strength Index: | -5.3 | 5.5 | -5.1 |
Free Reports:
 Download Our Metatrader 4 Indicators – Put Our Free MetaTrader 4 Custom Indicators on your charts when you join our Weekly Newsletter
 Get our Weekly Commitment of Traders Reports - See where the biggest traders (Hedge Funds and Commercial Hedgers) are positioned in the futures markets on a weekly basis.
30-Day Federal Funds Futures:
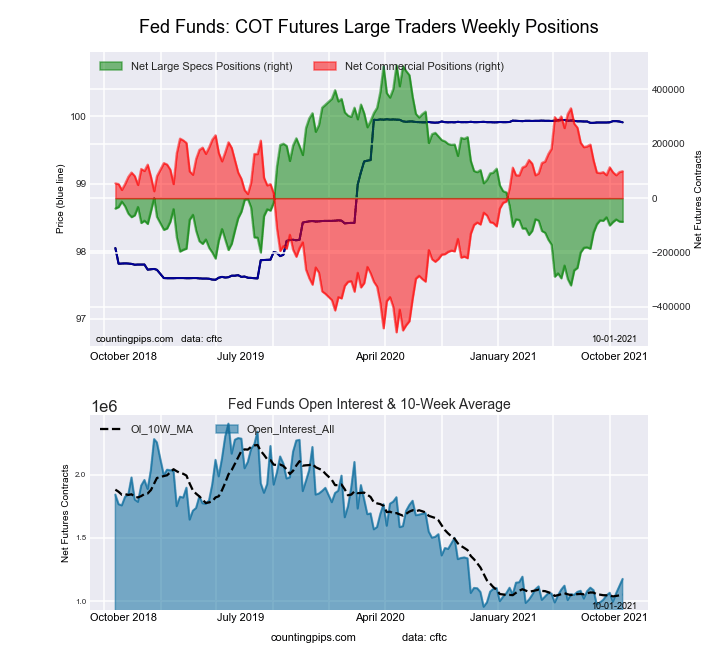 The 30-Day Federal Funds large speculator standing this week came in at a net position of -86,981 contracts in the data reported through Tuesday. This was a weekly reduction of -927 contracts from the previous week which had a total of -86,054 net contracts.
This week’s current strength score (the trader positioning range over the past three years, measured from 0 to 100) shows the speculators are currently Bearish with a score of 28.9 percent. The commercials are Bullish with a score of 71.9 percent and the small traders (not shown in chart) are Bearish with a score of 39.2 percent.
| 30-Day Federal Funds Statistics | SPECULATORS | COMMERCIALS | SMALL TRADERS |
| – Percent of Open Interest Longs: | 4.9 | 78.1 | 1.6 |
| – Percent of Open Interest Shorts: | 12.3 | 69.6 | 2.6 |
| – Net Position: | -86,981 | 99,062 | -12,081 |
| – Gross Longs: | 57,226 | 917,366 | 18,773 |
| – Gross Shorts: | 144,207 | 818,304 | 30,854 |
| – Long to Short Ratio: | 0.4 to 1 | 1.1 to 1 | 0.6 to 1 |
| NET POSITION TREND: | |||
| – COT Index Score (3 Year Range Pct): | 28.9 | 71.9 | 39.2 |
| – COT Index Reading (3 Year Range): | Bearish | Bullish | Bearish |
| NET POSITION MOVEMENT INDEX: | |||
| – 6-Week Change in Strength Index: | -0.5 | 0.4 | 0.9 |
2-Year Treasury Note Futures:
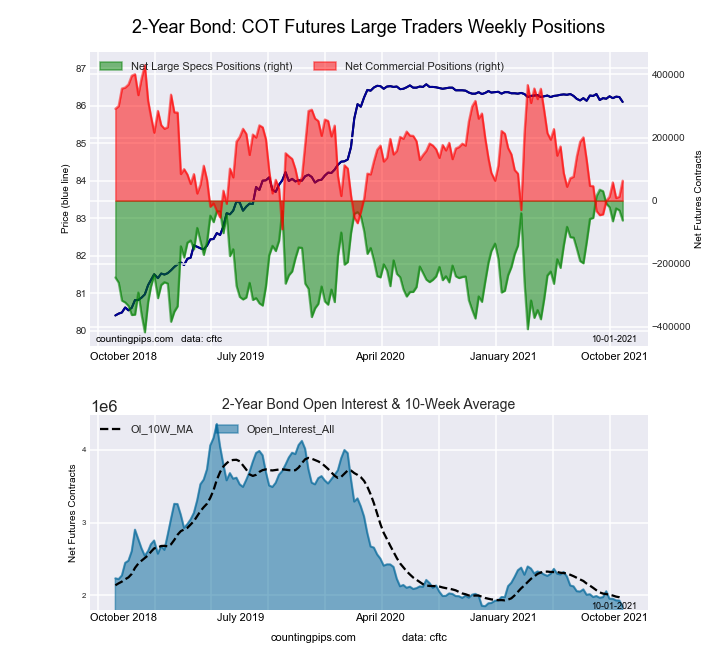 The 2-Year Treasury Note large speculator standing this week came in at a net position of -62,829 contracts in the data reported through Tuesday. This was a weekly reduction of -32,428 contracts from the previous week which had a total of -30,401 net contracts.
This week’s current strength score (the trader positioning range over the past three years, measured from 0 to 100) shows the speculators are currently Bullish with a score of 78.4 percent. The commercials are Bearish with a score of 29.6 percent and the small traders (not shown in chart) are Bearish with a score of 27.5 percent.
| 2-Year Treasury Note Statistics | SPECULATORS | COMMERCIALS | SMALL TRADERS |
| – Percent of Open Interest Longs: | 17.9 | 71.2 | 7.7 |
| – Percent of Open Interest Shorts: | 21.3 | 67.8 | 7.7 |
| – Net Position: | -62,829 | 63,290 | -461 |
| – Gross Longs: | 331,033 | 1,315,342 | 141,690 |
| – Gross Shorts: | 393,862 | 1,252,052 | 142,151 |
| – Long to Short Ratio: | 0.8 to 1 | 1.1 to 1 | 1.0 to 1 |
| NET POSITION TREND: | |||
| – COT Index Score (3 Year Range Pct): | 78.4 | 29.6 | 27.5 |
| – COT Index Reading (3 Year Range): | Bullish | Bearish | Bearish |
| NET POSITION MOVEMENT INDEX: | |||
| – 6-Week Change in Strength Index: | -20.6 | 20.5 | -7.9 |
5-Year Treasury Note Futures:
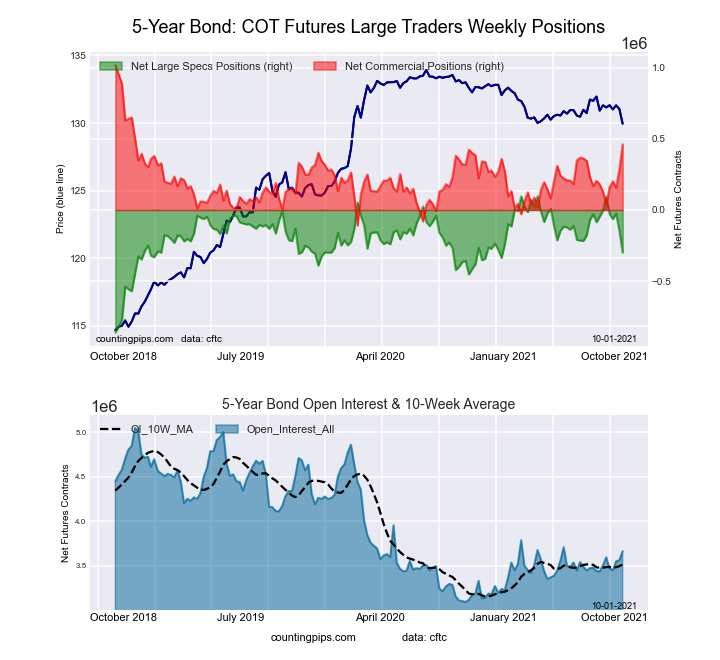 The 5-Year Treasury Note large speculator standing this week came in at a net position of -299,196 contracts in the data reported through Tuesday. This was a weekly lowering of -151,773 contracts from the previous week which had a total of -147,423 net contracts.
This week’s current strength score (the trader positioning range over the past three years, measured from 0 to 100) shows the speculators are currently Bullish with a score of 58.7 percent. The commercials are Bullish with a score of 50.7 percent and the small traders (not shown in chart) are Bearish-Extreme with a score of 2.7 percent.
| 5-Year Treasury Note Statistics | SPECULATORS | COMMERCIALS | SMALL TRADERS |
| – Percent of Open Interest Longs: | 11.6 | 77.3 | 7.8 |
| – Percent of Open Interest Shorts: | 19.7 | 64.7 | 12.2 |
| – Net Position: | -299,196 | 461,653 | -162,457 |
| – Gross Longs: | 423,401 | 2,831,871 | 285,115 |
| – Gross Shorts: | 722,597 | 2,370,218 | 447,572 |
| – Long to Short Ratio: | 0.6 to 1 | 1.2 to 1 | 0.6 to 1 |
| NET POSITION TREND: | |||
| – COT Index Score (3 Year Range Pct): | 58.7 | 50.7 | 2.7 |
| – COT Index Reading (3 Year Range): | Bullish | Bullish | Bearish-Extreme |
| NET POSITION MOVEMENT INDEX: | |||
| – 6-Week Change in Strength Index: | -31.1 | 29.7 | -15.7 |
10-Year Treasury Note Futures:
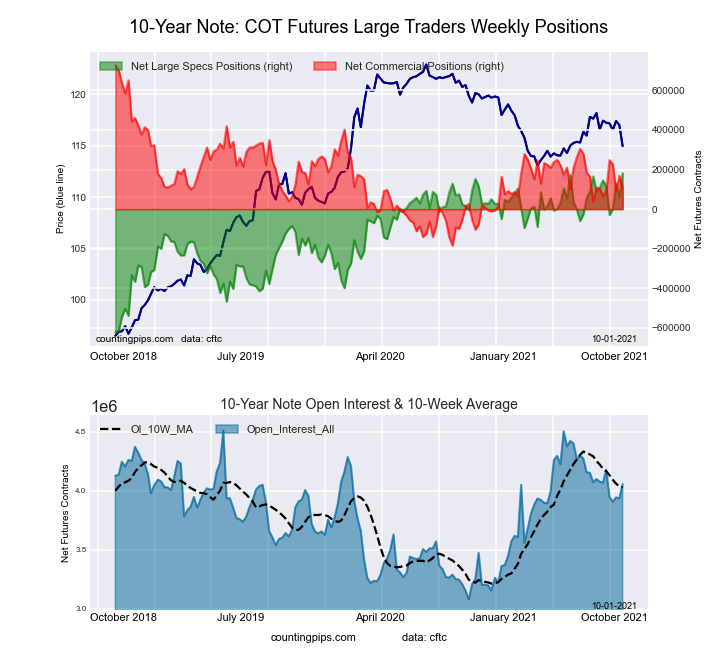 The 10-Year Treasury Note large speculator standing this week came in at a net position of 181,207 contracts in the data reported through Tuesday. This was a weekly rise of 119,986 contracts from the previous week which had a total of 61,221 net contracts.
This week’s current strength score (the trader positioning range over the past three years, measured from 0 to 100) shows the speculators are currently Bullish-Extreme with a score of 100.0 percent. The commercials are Bearish with a score of 32.1 percent and the small traders (not shown in chart) are Bearish-Extreme with a score of 0.0 percent.
| 10-Year Treasury Note Statistics | SPECULATORS | COMMERCIALS | SMALL TRADERS |
| – Percent of Open Interest Longs: | 21.4 | 67.9 | 7.8 |
| – Percent of Open Interest Shorts: | 17.0 | 65.2 | 14.9 |
| – Net Position: | 181,207 | 108,708 | -289,915 |
| – Gross Longs: | 869,115 | 2,753,975 | 315,903 |
| – Gross Shorts: | 687,908 | 2,645,267 | 605,818 |
| – Long to Short Ratio: | 1.3 to 1 | 1.0 to 1 | 0.5 to 1 |
| NET POSITION TREND: | |||
| – COT Index Score (3 Year Range Pct): | 100.0 | 32.1 | 0.0 |
| – COT Index Reading (3 Year Range): | Bullish-Extreme | Bearish | Bearish-Extreme |
| NET POSITION MOVEMENT INDEX: | |||
| – 6-Week Change in Strength Index: | 4.5 | 4.8 | -20.8 |
Ultra 10-Year Notes Futures:
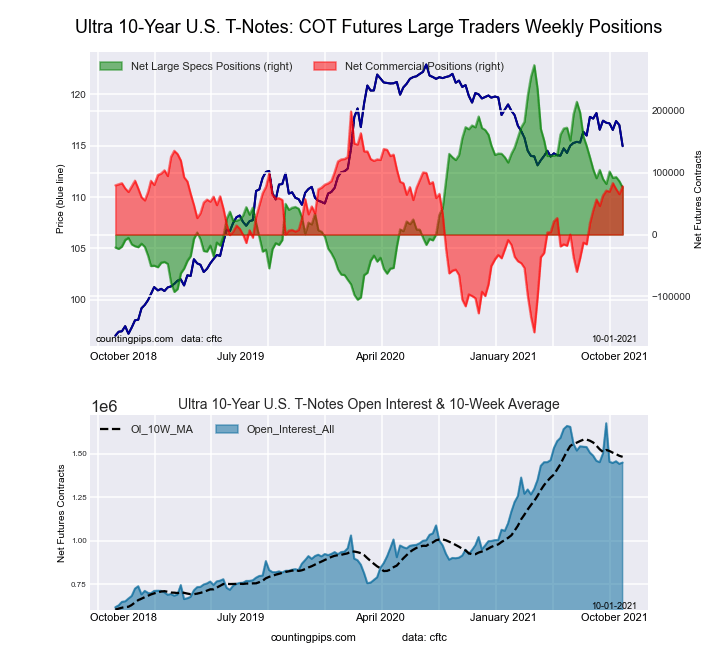 The Ultra 10-Year Notes large speculator standing this week came in at a net position of 75,847 contracts in the data reported through Tuesday. This was a weekly decline of -10,384 contracts from the previous week which had a total of 86,231 net contracts.
This week’s current strength score (the trader positioning range over the past three years, measured from 0 to 100) shows the speculators are currently Bearish with a score of 47.8 percent. The commercials are Bullish with a score of 66.1 percent and the small traders (not shown in chart) are Bearish-Extreme with a score of 13.9 percent.
| Ultra 10-Year Notes Statistics | SPECULATORS | COMMERCIALS | SMALL TRADERS |
| – Percent of Open Interest Longs: | 16.1 | 74.5 | 9.1 |
| – Percent of Open Interest Shorts: | 10.8 | 69.1 | 19.7 |
| – Net Position: | 75,847 | 78,053 | -153,900 |
| – Gross Longs: | 232,658 | 1,080,055 | 131,272 |
| – Gross Shorts: | 156,811 | 1,002,002 | 285,172 |
| – Long to Short Ratio: | 1.5 to 1 | 1.1 to 1 | 0.5 to 1 |
| NET POSITION TREND: | |||
| – COT Index Score (3 Year Range Pct): | 47.8 | 66.1 | 13.9 |
| – COT Index Reading (3 Year Range): | Bearish | Bullish | Bearish-Extreme |
| NET POSITION MOVEMENT INDEX: | |||
| – 6-Week Change in Strength Index: | -3.7 | 4.2 | -0.6 |
US Treasury Bonds Futures:
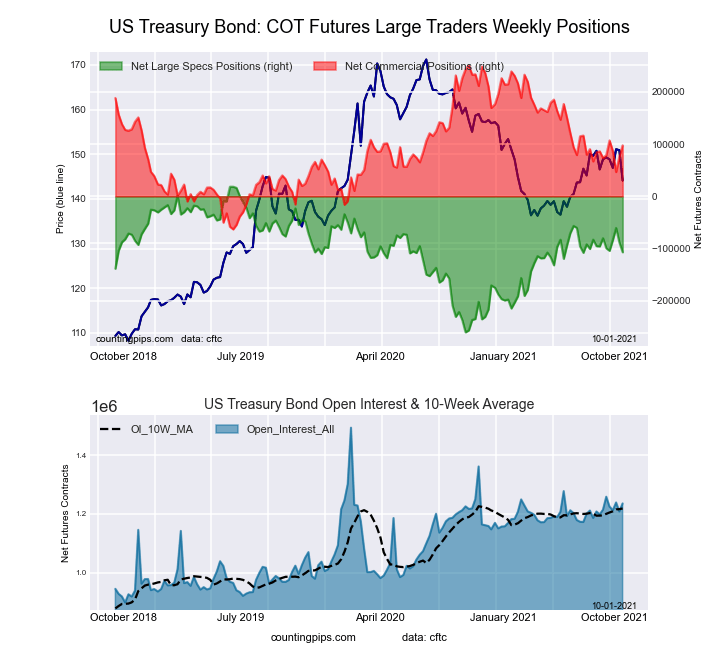 The US Treasury Bonds large speculator standing this week came in at a net position of -106,940 contracts in the data reported through Tuesday. This was a weekly decrease of -18,669 contracts from the previous week which had a total of -88,271 net contracts.
This week’s current strength score (the trader positioning range over the past three years, measured from 0 to 100) shows the speculators are currently Bullish with a score of 55.0 percent. The commercials are Bullish with a score of 51.1 percent and the small traders (not shown in chart) are Bullish with a score of 60.2 percent.
| US Treasury Bonds Statistics | SPECULATORS | COMMERCIALS | SMALL TRADERS |
| – Percent of Open Interest Longs: | 9.3 | 73.5 | 15.2 |
| – Percent of Open Interest Shorts: | 18.0 | 65.6 | 14.5 |
| – Net Position: | -106,940 | 97,332 | 9,608 |
| – Gross Longs: | 115,052 | 907,957 | 188,318 |
| – Gross Shorts: | 221,992 | 810,625 | 178,710 |
| – Long to Short Ratio: | 0.5 to 1 | 1.1 to 1 | 1.1 to 1 |
| NET POSITION TREND: | |||
| – COT Index Score (3 Year Range Pct): | 55.0 | 51.1 | 60.2 |
| – COT Index Reading (3 Year Range): | Bullish | Bullish | Bullish |
| NET POSITION MOVEMENT INDEX: | |||
| – 6-Week Change in Strength Index: | -9.6 | 7.6 | 2.2 |
Ultra US Treasury Bonds Futures:
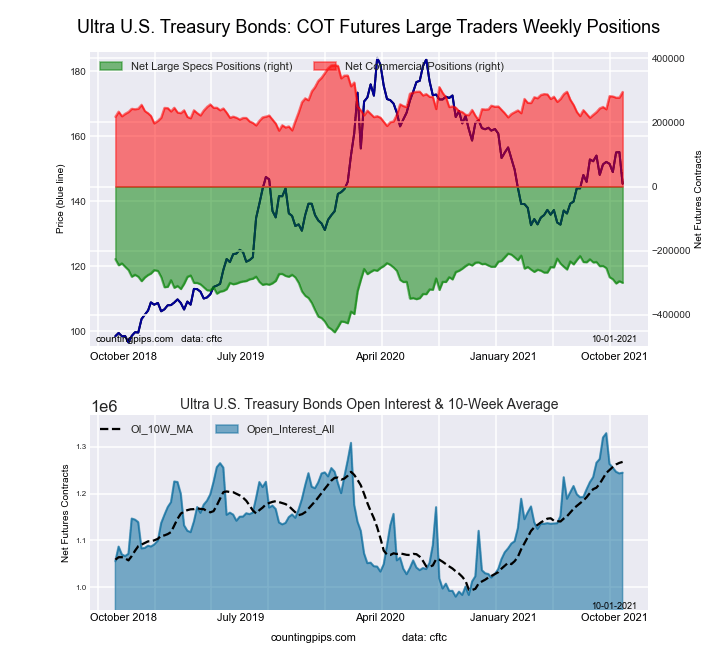 The Ultra US Treasury Bonds large speculator standing this week came in at a net position of -299,793 contracts in the data reported through Tuesday. This was a weekly decrease of -5,028 contracts from the previous week which had a total of -294,765 net contracts.
This week’s current strength score (the trader positioning range over the past three years, measured from 0 to 100) shows the speculators are currently Bullish with a score of 62.9 percent. The commercials are Bullish with a score of 59.2 percent and the small traders (not shown in chart) are Bearish with a score of 31.9 percent.
| Ultra US Treasury Bonds Statistics | SPECULATORS | COMMERCIALS | SMALL TRADERS |
| – Percent of Open Interest Longs: | 5.5 | 81.1 | 12.5 |
| – Percent of Open Interest Shorts: | 29.6 | 57.4 | 12.1 |
| – Net Position: | -299,793 | 294,678 | 5,115 |
| – Gross Longs: | 68,563 | 1,009,158 | 155,998 |
| – Gross Shorts: | 368,356 | 714,480 | 150,883 |
| – Long to Short Ratio: | 0.2 to 1 | 1.4 to 1 | 1.0 to 1 |
| NET POSITION TREND: | |||
| – COT Index Score (3 Year Range Pct): | 62.9 | 59.2 | 31.9 |
| – COT Index Reading (3 Year Range): | Bullish | Bullish | Bearish |
| NET POSITION MOVEMENT INDEX: | |||
| – 6-Week Change in Strength Index: | -21.4 | 23.0 | 4.0 |
Article By InvestMacro.com – Receive our weekly COT Reports by Email
*COT Report: The COT data, released weekly to the public each Friday, is updated through the most recent Tuesday (data is 3 days old) and shows a quick view of how large speculators or non-commercials (for-profit traders) were positioned in the futures markets.
The CFTC categorizes trader positions according to commercial hedgers (traders who use futures contracts for hedging as part of the business), non-commercials (large traders who speculate to realize trading profits) and nonreportable traders (usually small traders/speculators).
Find CFTC criteria here: (http://www.cftc.gov/MarketReports/CommitmentsofTraders/ExplanatoryNotes/index.htm).

- COT Metals Charts: Weekly Speculator Bets led by Copper & Steel Jul 18, 2026
- COT Bonds Charts: Weekly Speculator Bets led by 2-Year, SOFR 3M & 5-Year Bonds Jul 18, 2026
- COT Energy Charts: Weekly Speculator Bets led by Brent Oil & Heating Oil Jul 18, 2026
- COT Soft Commodities Charts: Weekly Speculator Bets led by Wheat, Corn & Soybean Meal Jul 18, 2026
- The Bank of Canada kept its interest rate unchanged. Platinum prices reached a three‑week high Jul 16, 2026
- Stock indices rose after the release of US inflation data. China’s GDP slowed sharply Jul 15, 2026
- GBP/USD Awaits Political News: What Will Happen Next Jul 15, 2026
- USD/JPY Holds at Highs: Pressure Lingers on Yen Jul 14, 2026
- Oil prices jumped 4% amid a new wave of escalation between the US and Iran Jul 13, 2026
- EUR/USD: US Inflation Will Determine Everything Jul 13, 2026