
By InvestMacro.com COT Home | Data Tables | Data Downloads | Newsletter
Here are the latest charts and statistics for the Commitment of Traders (COT) data published by the Commodities Futures Trading Commission (CFTC).
The latest COT data is updated through Tuesday September 28th 2021 and shows a quick view of how large traders (for-profit speculators and commercial entities) were positioned in the futures markets.
VIX Volatility Futures:
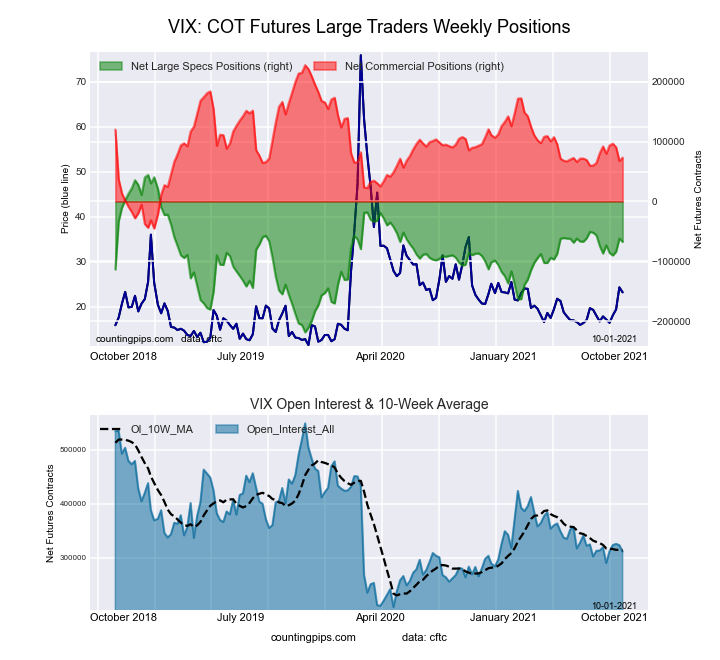 The VIX Volatility large speculator standing this week equaled a net position of -67,359 contracts in the data reported through Tuesday. This was a weekly reduction of -5,432 contracts from the previous week which had a total of -61,927 net contracts.
This week’s current strength score (the trader positioning range over the past three years, measured from 0 to 100) shows the speculators are currently Bullish with a score of 57.5 percent. The commercials are Bearish with a score of 43.4 percent and the small traders (not shown in chart) are Bearish with a score of 34.8 percent.
| VIX Volatility Futures Statistics | SPECULATORS | COMMERCIALS | SMALL TRADERS |
| – Percent of Open Interest Longs: | 17.3 | 51.6 | 7.7 |
| – Percent of Open Interest Shorts: | 38.9 | 28.1 | 9.6 |
| – Net Position: | -67,359 | 73,060 | -5,701 |
| – Gross Longs: | 53,922 | 160,575 | 24,129 |
| – Gross Shorts: | 121,281 | 87,515 | 29,830 |
| – Long to Short Ratio: | 0.4 to 1 | 1.8 to 1 | 0.8 to 1 |
| NET POSITION TREND: | |||
| – COT Index Score (3 Year Range Pct): | 57.5 | 43.4 | 34.8 |
| – COT Index Reading (3 Year Range): | Bullish | Bearish | Bearish |
| NET POSITION MOVEMENT INDEX: | |||
| – 6-Week Change in Strength Index: | 7.4 | -6.9 | -2.5 |
Free Reports:
 Download Our Metatrader 4 Indicators – Put Our Free MetaTrader 4 Custom Indicators on your charts when you join our Weekly Newsletter
 Get our Weekly Commitment of Traders Reports - See where the biggest traders (Hedge Funds and Commercial Hedgers) are positioned in the futures markets on a weekly basis.
S&P500 Mini Futures:
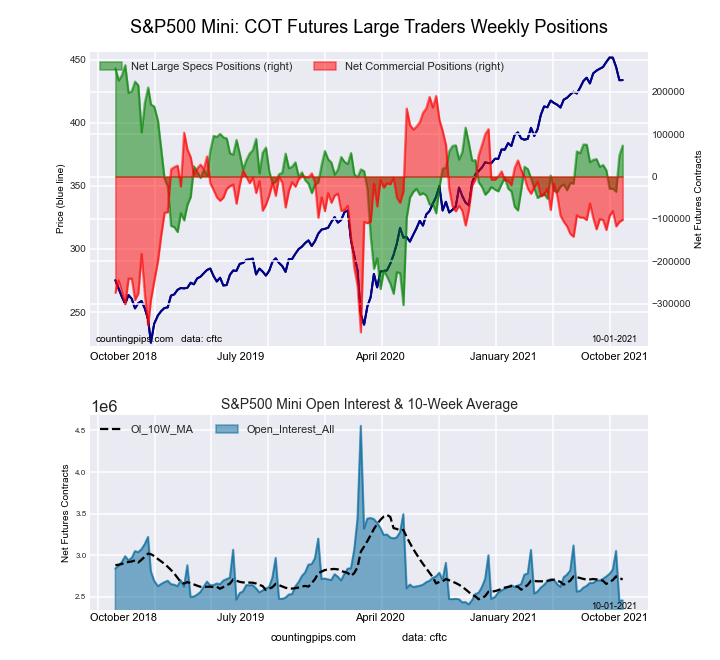 The S&P500 Mini large speculator standing this week equaled a net position of 73,157 contracts in the data reported through Tuesday. This was a weekly rise of 23,342 contracts from the previous week which had a total of 49,815 net contracts.
This week’s current strength score (the trader positioning range over the past three years, measured from 0 to 100) shows the speculators are currently Bullish with a score of 66.5 percent. The commercials are Bearish with a score of 47.6 percent and the small traders (not shown in chart) are Bearish with a score of 32.4 percent.
| S&P500 Mini Futures Statistics | SPECULATORS | COMMERCIALS | SMALL TRADERS |
| – Percent of Open Interest Longs: | 15.6 | 70.9 | 11.0 |
| – Percent of Open Interest Shorts: | 12.6 | 75.0 | 9.8 |
| – Net Position: | 73,157 | -102,108 | 28,951 |
| – Gross Longs: | 382,495 | 1,741,160 | 270,900 |
| – Gross Shorts: | 309,338 | 1,843,268 | 241,949 |
| – Long to Short Ratio: | 1.2 to 1 | 0.9 to 1 | 1.1 to 1 |
| NET POSITION TREND: | |||
| – COT Index Score (3 Year Range Pct): | 66.5 | 47.6 | 32.4 |
| – COT Index Reading (3 Year Range): | Bullish | Bearish | Bearish |
| NET POSITION MOVEMENT INDEX: | |||
| – 6-Week Change in Strength Index: | 8.1 | 0.0 | -9.6 |
Dow Jones Mini Futures:
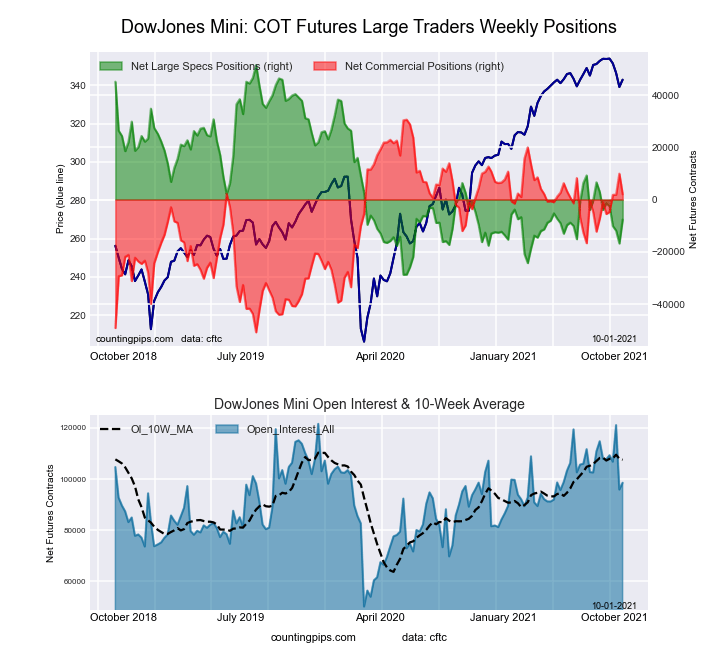 The Dow Jones Mini large speculator standing this week equaled a net position of -7,681 contracts in the data reported through Tuesday. This was a weekly lift of 9,120 contracts from the previous week which had a total of -16,801 net contracts.
This week’s current strength score (the trader positioning range over the past three years, measured from 0 to 100) shows the speculators are currently Bearish with a score of 26.3 percent. The commercials are Bullish with a score of 64.9 percent and the small traders (not shown in chart) are Bullish with a score of 68.7 percent.
| Dow Jones Mini Futures Statistics | SPECULATORS | COMMERCIALS | SMALL TRADERS |
| – Percent of Open Interest Longs: | 30.1 | 50.7 | 17.5 |
| – Percent of Open Interest Shorts: | 37.9 | 48.6 | 11.8 |
| – Net Position: | -7,681 | 2,025 | 5,656 |
| – Gross Longs: | 29,684 | 49,924 | 17,272 |
| – Gross Shorts: | 37,365 | 47,899 | 11,616 |
| – Long to Short Ratio: | 0.8 to 1 | 1.0 to 1 | 1.5 to 1 |
| NET POSITION TREND: | |||
| – COT Index Score (3 Year Range Pct): | 26.3 | 64.9 | 68.7 |
| – COT Index Reading (3 Year Range): | Bearish | Bullish | Bullish |
| NET POSITION MOVEMENT INDEX: | |||
| – 6-Week Change in Strength Index: | -4.7 | 3.8 | 3.3 |
Nasdaq Mini Futures:
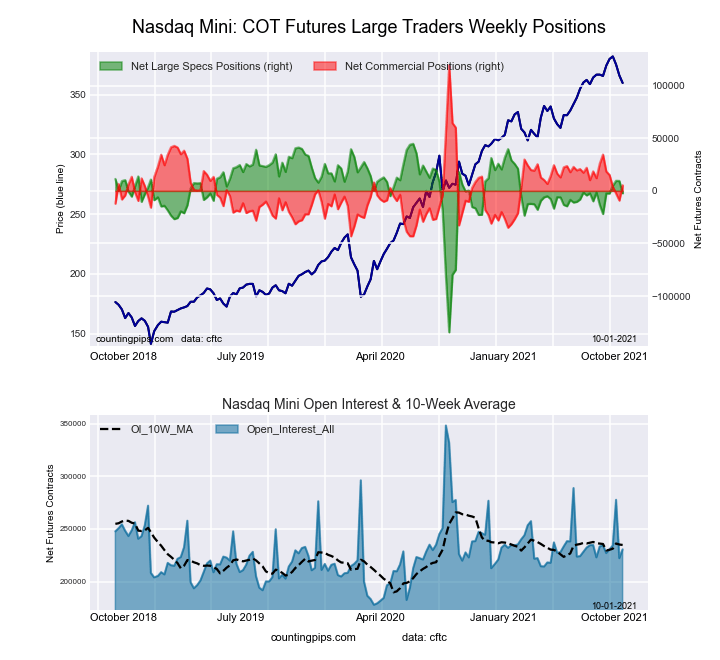 The Nasdaq Mini large speculator standing this week equaled a net position of -2,280 contracts in the data reported through Tuesday. This was a weekly decrease of -11,702 contracts from the previous week which had a total of 9,422 net contracts.
This week’s current strength score (the trader positioning range over the past three years, measured from 0 to 100) shows the speculators are currently Bullish with a score of 73.8 percent. The commercials are Bearish with a score of 29.8 percent and the small traders (not shown in chart) are Bearish with a score of 37.1 percent.
| Nasdaq Mini Futures Statistics | SPECULATORS | COMMERCIALS | SMALL TRADERS |
| – Percent of Open Interest Longs: | 27.8 | 52.4 | 17.8 |
| – Percent of Open Interest Shorts: | 28.8 | 50.0 | 19.2 |
| – Net Position: | -2,280 | 5,346 | -3,066 |
| – Gross Longs: | 64,041 | 120,760 | 41,162 |
| – Gross Shorts: | 66,321 | 115,414 | 44,228 |
| – Long to Short Ratio: | 1.0 to 1 | 1.0 to 1 | 0.9 to 1 |
| NET POSITION TREND: | |||
| – COT Index Score (3 Year Range Pct): | 73.8 | 29.8 | 37.1 |
| – COT Index Reading (3 Year Range): | Bullish | Bearish | Bearish |
| NET POSITION MOVEMENT INDEX: | |||
| – 6-Week Change in Strength Index: | 11.0 | -17.9 | 21.2 |
Russell 2000 Mini Futures:
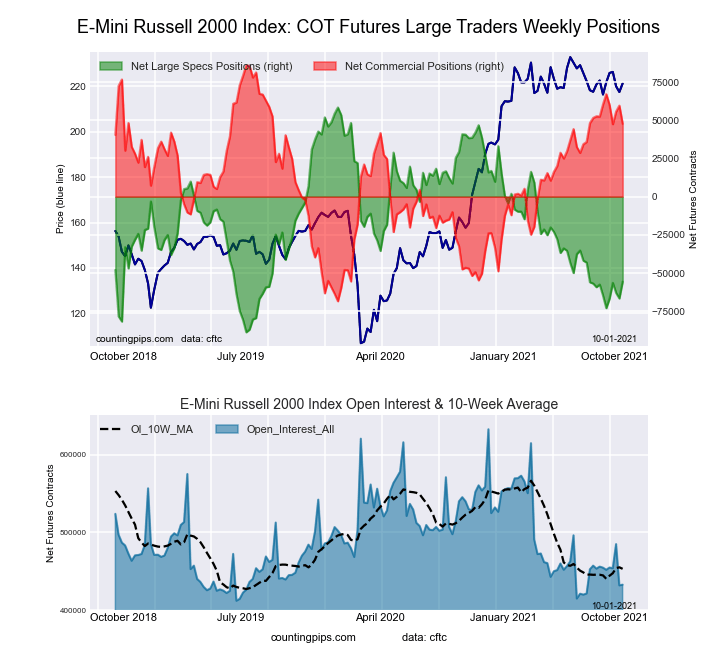 The Russell 2000 Mini large speculator standing this week equaled a net position of -55,643 contracts in the data reported through Tuesday. This was a weekly rise of 10,958 contracts from the previous week which had a total of -66,601 net contracts.
This week’s current strength score (the trader positioning range over the past three years, measured from 0 to 100) shows the speculators are currently Bearish with a score of 22.5 percent. The commercials are Bullish with a score of 75.2 percent and the small traders (not shown in chart) are Bullish with a score of 55.5 percent.
| Russell 2000 Mini Futures Statistics | SPECULATORS | COMMERCIALS | SMALL TRADERS |
| – Percent of Open Interest Longs: | 12.1 | 80.2 | 6.7 |
| – Percent of Open Interest Shorts: | 24.9 | 69.2 | 4.9 |
| – Net Position: | -55,643 | 47,686 | 7,957 |
| – Gross Longs: | 52,263 | 346,974 | 29,180 |
| – Gross Shorts: | 107,906 | 299,288 | 21,223 |
| – Long to Short Ratio: | 0.5 to 1 | 1.2 to 1 | 1.4 to 1 |
| NET POSITION TREND: | |||
| – COT Index Score (3 Year Range Pct): | 22.5 | 75.2 | 55.5 |
| – COT Index Reading (3 Year Range): | Bearish | Bullish | Bullish |
| NET POSITION MOVEMENT INDEX: | |||
| – 6-Week Change in Strength Index: | 6.1 | -8.2 | 10.1 |
Nikkei Stock Average (USD) Futures:
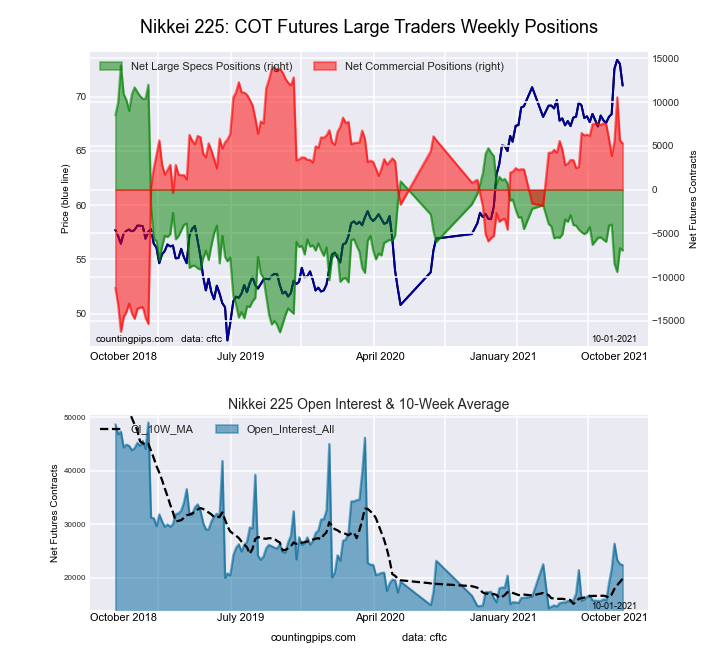 The Nikkei Stock Average (USD) large speculator standing this week equaled a net position of -6,948 contracts in the data reported through Tuesday. This was a weekly reduction of -255 contracts from the previous week which had a total of -6,693 net contracts.
This week’s current strength score (the trader positioning range over the past three years, measured from 0 to 100) shows the speculators are currently Bearish with a score of 30.6 percent. The commercials are Bullish with a score of 71.1 percent and the small traders (not shown in chart) are Bearish with a score of 48.1 percent.
| Nikkei Stock Average Futures Statistics | SPECULATORS | COMMERCIALS | SMALL TRADERS |
| – Percent of Open Interest Longs: | 10.2 | 69.5 | 20.3 |
| – Percent of Open Interest Shorts: | 41.3 | 45.9 | 12.8 |
| – Net Position: | -6,948 | 5,284 | 1,664 |
| – Gross Longs: | 2,292 | 15,549 | 4,533 |
| – Gross Shorts: | 9,240 | 10,265 | 2,869 |
| – Long to Short Ratio: | 0.2 to 1 | 1.5 to 1 | 1.6 to 1 |
| NET POSITION TREND: | |||
| – COT Index Score (3 Year Range Pct): | 30.6 | 71.1 | 48.1 |
| – COT Index Reading (3 Year Range): | Bearish | Bullish | Bearish |
| NET POSITION MOVEMENT INDEX: | |||
| – 6-Week Change in Strength Index: | -3.3 | -7.2 | 40.7 |
MSCI EAFE Mini Futures:
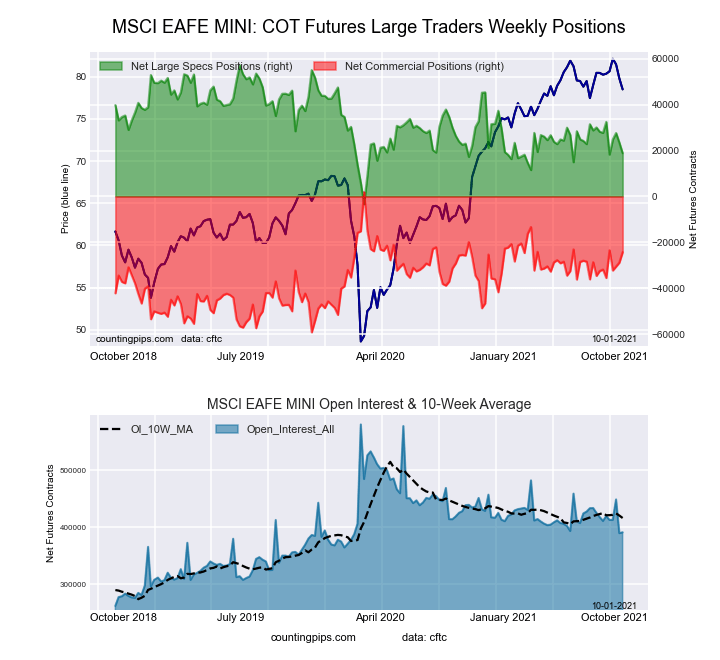 The MSCI EAFE Mini large speculator standing this week equaled a net position of 18,834 contracts in the data reported through Tuesday. This was a weekly lowering of -4,614 contracts from the previous week which had a total of 23,448 net contracts.
This week’s current strength score (the trader positioning range over the past three years, measured from 0 to 100) shows the speculators are currently Bearish with a score of 36.7 percent. The commercials are Bullish with a score of 57.1 percent and the small traders (not shown in chart) are Bullish with a score of 65.6 percent.
| MSCI EAFE Mini Futures Statistics | SPECULATORS | COMMERCIALS | SMALL TRADERS |
| – Percent of Open Interest Longs: | 7.2 | 89.4 | 2.9 |
| – Percent of Open Interest Shorts: | 2.4 | 95.6 | 1.5 |
| – Net Position: | 18,834 | -24,314 | 5,480 |
| – Gross Longs: | 28,158 | 349,799 | 11,489 |
| – Gross Shorts: | 9,324 | 374,113 | 6,009 |
| – Long to Short Ratio: | 3.0 to 1 | 0.9 to 1 | 1.9 to 1 |
| NET POSITION TREND: | |||
| – COT Index Score (3 Year Range Pct): | 36.7 | 57.1 | 65.6 |
| – COT Index Reading (3 Year Range): | Bearish | Bullish | Bullish |
| NET POSITION MOVEMENT INDEX: | |||
| – 6-Week Change in Strength Index: | -14.7 | 12.4 | 12.0 |
Article By InvestMacro.com – Receive our weekly COT Reports by Email
*COT Report: The COT data, released weekly to the public each Friday, is updated through the most recent Tuesday (data is 3 days old) and shows a quick view of how large speculators or non-commercials (for-profit traders) were positioned in the futures markets.
The CFTC categorizes trader positions according to commercial hedgers (traders who use futures contracts for hedging as part of the business), non-commercials (large traders who speculate to realize trading profits) and nonreportable traders (usually small traders/speculators).
Find CFTC criteria here: (http://www.cftc.gov/MarketReports/CommitmentsofTraders/ExplanatoryNotes/index.htm).

- COT Metals Charts: Weekly Speculator Bets led by Copper & Steel Jul 18, 2026
- COT Bonds Charts: Weekly Speculator Bets led by 2-Year, SOFR 3M & 5-Year Bonds Jul 18, 2026
- COT Energy Charts: Weekly Speculator Bets led by Brent Oil & Heating Oil Jul 18, 2026
- COT Soft Commodities Charts: Weekly Speculator Bets led by Wheat, Corn & Soybean Meal Jul 18, 2026
- The Bank of Canada kept its interest rate unchanged. Platinum prices reached a three‑week high Jul 16, 2026
- Stock indices rose after the release of US inflation data. China’s GDP slowed sharply Jul 15, 2026
- GBP/USD Awaits Political News: What Will Happen Next Jul 15, 2026
- USD/JPY Holds at Highs: Pressure Lingers on Yen Jul 14, 2026
- Oil prices jumped 4% amid a new wave of escalation between the US and Iran Jul 13, 2026
- EUR/USD: US Inflation Will Determine Everything Jul 13, 2026