By Dmitriy Gurkovskiy, Chief Analyst at RoboForex
Early in another week of September, EUR/USD is significantly falling and trading at 1.1790.
The major currency pair started moving downwards after negotiations between American and Chinese Presidents. It was their first conversation in seven months. The key topics discussed were economics and mutual interests, including the areas where the parties are still far away from consensus.
Additional support the “greenback” got from the statistics on the Producer Price Index, which improved pretty much in August. As a result, American inflation is likely to remain quite high but the logistic structure for producers may remain as tough as before because of the pandemic effect.
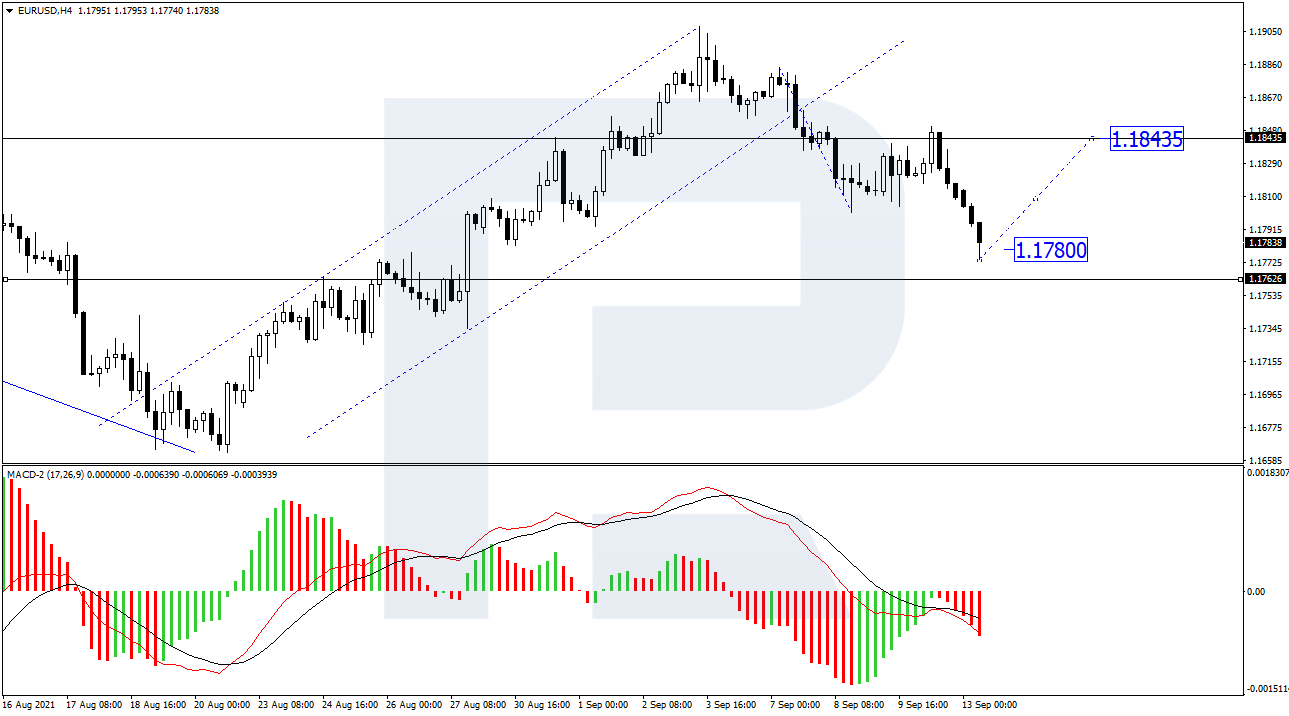
In the H4 chart, after breaking 1.1840 to the downside and finishing the fifth descending structure at 1.1780, EUR/USD is expected to form a new consolidation range near the highs. If the price breaks this range to the upside, the market may resume trading upwards to test 1.1850. From the technical point of view, this scenario is confirmed by MACD Oscillator: its signal line is about to leave the histogram area and start another growth towards 0. After breaking 0, the line is expected to continue growing towards new highs of the indicator.
Free Reports:
As we can see in the H1 chart, EUR/USD is consolidating above 1.1780 and may later grow to reach 1.1809. After that, the instrument may fall towards 1.1790 and then start another growth with the short-term target at 1.1830. Later, the market may correct to test 1.1809 from above and then resume trading upwards to reach 1.1850. From the technical point of view, this scenario is confirmed by the Stochastic Oscillator: after breaking 20 to the upside and leaving the “oversold area”, its signal line is steadily moving towards 50, a breakout of which may lead to further growth to reach 80.
Disclaimer
Any forecasts contained herein are based on the author’s particular opinion. This analysis may not be treated as trading advice. RoboForex bears no responsibility for trading results based on trading recommendations and reviews contained herein.
By JustMarkets The US stock indices ended Friday’s session in the red. By the end…
By Analytical Department RoboForex USD/JPY opens the week at 162.36 on Monday. The Japanese yen…
By InvestMacro Here are the latest charts and statistics for the Commitment of Traders (COT)…
By InvestMacro The latest update for the weekly Commitment of Traders (COT) report was released…
By InvestMacro Here are the latest charts and statistics for the Commitment of Traders (COT)…
By InvestMacro Here are the latest charts and statistics for the Commitment of Traders (COT)…
This website uses cookies.