By CountingPips.com COT Home | Data Tables | Data Downloads | Newsletter
Here are the latest charts and statistics for the Commitment of Traders (COT) data published by the Commodities Futures Trading Commission (CFTC).
The latest COT data is updated through Tuesday July 20 2021 and shows a quick view of how large traders (for-profit speculators and commercial entities) were positioned in the futures markets.
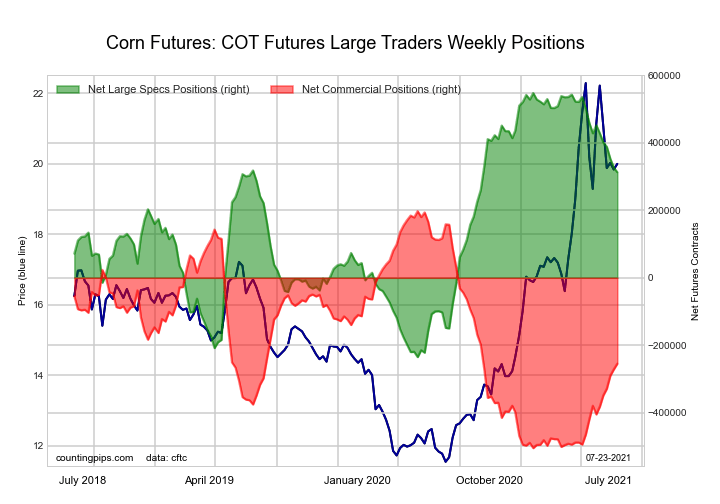
This week’s current strength score (the trader positioning range over the past three years, measured from 0 to 100) shows the speculators are currently Bullish with a score of 69.8 percent. The commercials are Bearish with a score of 35.4 percent and the small traders (not shown in chart) are Bearish-Extreme with a score of 4.7 percent.
| CORN Futures Statistics | SPECULATORS | COMMERCIALS | SMALL TRADERS |
| – Percent of Open Interest Longs: | 27.7 | 48.9 | 8.6 |
| – Percent of Open Interest Shorts: | 6.7 | 66.3 | 12.4 |
| – Net Position: | 311,529 | -256,483 | -55,046 |
| – Gross Longs: | 410,004 | 723,246 | 127,725 |
| – Gross Shorts: | 98,475 | 979,729 | 182,771 |
| – Long to Short Ratio: | 4.2 to 1 | 0.7 to 1 | 0.7 to 1 |
| NET POSITION TREND: | |||
| – COT Index Score (3 Year Range Pct): | 69.8 | 35.4 | 4.7 |
| – COT Index Reading (3 Year Range): | Bullish | Bearish | Bearish-Extreme |
| NET POSITION MOVEMENT INDEX: | |||
| – 6-Week Change in Strength Index: | -14.9 | 17.9 | -5.4 |
Free Reports:
This week’s current strength score (the trader positioning range over the past three years, measured from 0 to 100) shows the speculators are currently Bullish-Extreme with a score of 86.4 percent. The commercials are Bearish-Extreme with a score of 13.3 percent and the small traders (not shown in chart) are Bullish with a score of 66.1 percent.
| SUGAR Futures Statistics | SPECULATORS | COMMERCIALS | SMALL TRADERS |
| – Percent of Open Interest Longs: | 30.7 | 44.9 | 9.2 |
| – Percent of Open Interest Shorts: | 4.3 | 76.3 | 4.1 |
| – Net Position: | 242,469 | -289,545 | 47,076 |
| – Gross Longs: | 282,512 | 413,344 | 85,077 |
| – Gross Shorts: | 40,043 | 702,889 | 38,001 |
| – Long to Short Ratio: | 7.1 to 1 | 0.6 to 1 | 2.2 to 1 |
| NET POSITION TREND: | |||
| – COT Index Score (3 Year Range Pct): | 86.4 | 13.3 | 66.1 |
| – COT Index Reading (3 Year Range): | Bullish-Extreme | Bearish-Extreme | Bullish |
| NET POSITION MOVEMENT INDEX: | |||
| – 6-Week Change in Strength Index: | -5.7 | 7.8 | -16.5 |
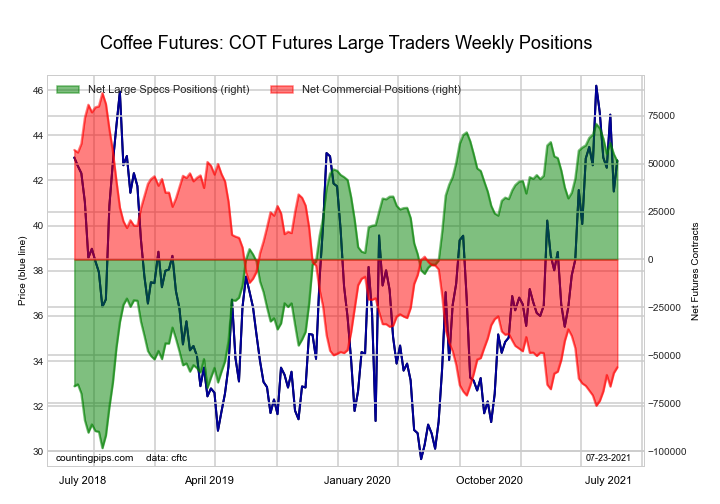
This week’s current strength score (the trader positioning range over the past three years, measured from 0 to 100) shows the speculators are currently Bullish-Extreme with a score of 94.8 percent. The commercials are Bearish-Extreme with a score of 6.0 percent and the small traders (not shown in chart) are Bearish-Extreme with a score of 19.0 percent.
| COFFEE Futures Statistics | SPECULATORS | COMMERCIALS | SMALL TRADERS |
| – Percent of Open Interest Longs: | 29.0 | 47.4 | 3.7 |
| – Percent of Open Interest Shorts: | 7.7 | 70.3 | 2.2 |
| – Net Position: | 62,036 | -66,472 | 4,436 |
| – Gross Longs: | 84,362 | 137,782 | 10,779 |
| – Gross Shorts: | 22,326 | 204,254 | 6,343 |
| – Long to Short Ratio: | 3.8 to 1 | 0.7 to 1 | 1.7 to 1 |
| NET POSITION TREND: | |||
| – COT Index Score (3 Year Range Pct): | 94.8 | 6.0 | 19.0 |
| – COT Index Reading (3 Year Range): | Bullish-Extreme | Bearish-Extreme | Bearish-Extreme |
| NET POSITION MOVEMENT INDEX: | |||
| – 6-Week Change in Strength Index: | -3.8 | 4.5 | -6.6 |
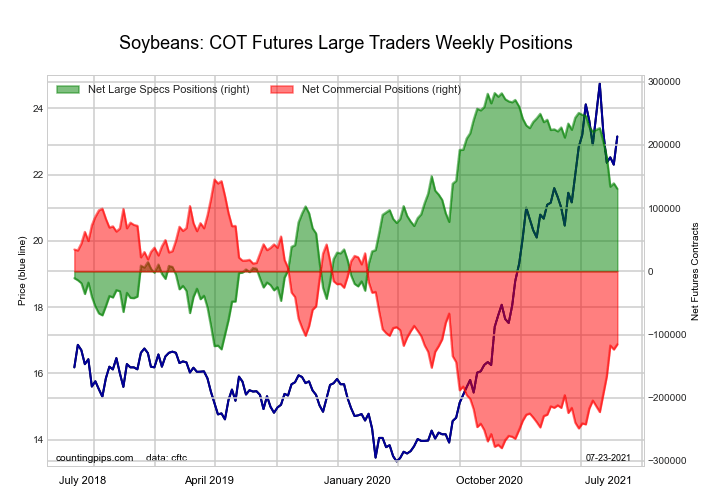
This week’s current strength score (the trader positioning range over the past three years, measured from 0 to 100) shows the speculators are currently Bullish with a score of 64.4 percent. The commercials are Bearish with a score of 35.8 percent and the small traders (not shown in chart) are Bullish with a score of 54.9 percent.
| SOYBEANS Futures Statistics | SPECULATORS | COMMERCIALS | SMALL TRADERS |
| – Percent of Open Interest Longs: | 28.8 | 47.6 | 7.6 |
| – Percent of Open Interest Shorts: | 8.9 | 66.0 | 9.0 |
| – Net Position: | 137,679 | -127,539 | -10,140 |
| – Gross Longs: | 199,323 | 329,450 | 52,484 |
| – Gross Shorts: | 61,644 | 456,989 | 62,624 |
| – Long to Short Ratio: | 3.2 to 1 | 0.7 to 1 | 0.8 to 1 |
| NET POSITION TREND: | |||
| – COT Index Score (3 Year Range Pct): | 64.4 | 35.8 | 54.9 |
| – COT Index Reading (3 Year Range): | Bullish | Bearish | Bullish |
| NET POSITION MOVEMENT INDEX: | |||
| – 6-Week Change in Strength Index: | -22.0 | 22.4 | -10.1 |
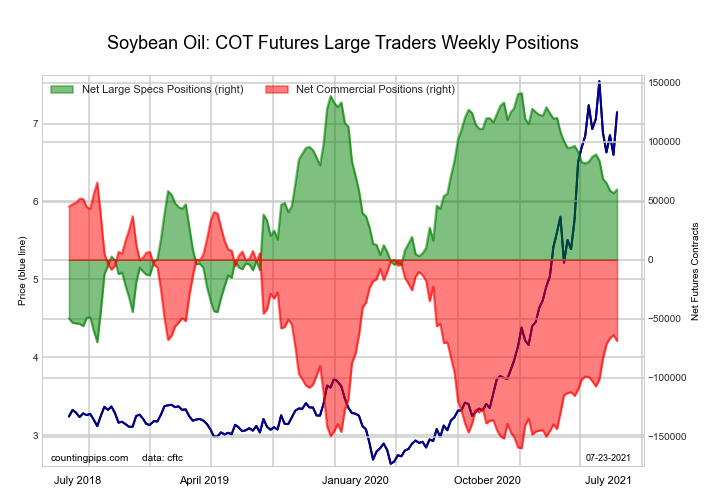
This week’s current strength score (the trader positioning range over the past three years, measured from 0 to 100) shows the speculators are currently Bullish with a score of 61.3 percent. The commercials are Bearish with a score of 40.4 percent and the small traders (not shown in chart) are Bearish with a score of 47.7 percent.
| SOYBEAN OIL Futures Statistics | SPECULATORS | COMMERCIALS | SMALL TRADERS |
| – Percent of Open Interest Longs: | 19.8 | 50.9 | 7.2 |
| – Percent of Open Interest Shorts: | 7.4 | 65.2 | 5.3 |
| – Net Position: | 59,517 | -68,690 | 9,173 |
| – Gross Longs: | 95,068 | 243,983 | 34,536 |
| – Gross Shorts: | 35,551 | 312,673 | 25,363 |
| – Long to Short Ratio: | 2.7 to 1 | 0.8 to 1 | 1.4 to 1 |
| NET POSITION TREND: | |||
| – COT Index Score (3 Year Range Pct): | 61.3 | 40.4 | 47.7 |
| – COT Index Reading (3 Year Range): | Bullish | Bearish | Bearish |
| NET POSITION MOVEMENT INDEX: | |||
| – 6-Week Change in Strength Index: | -14.1 | 17.1 | -32.9 |
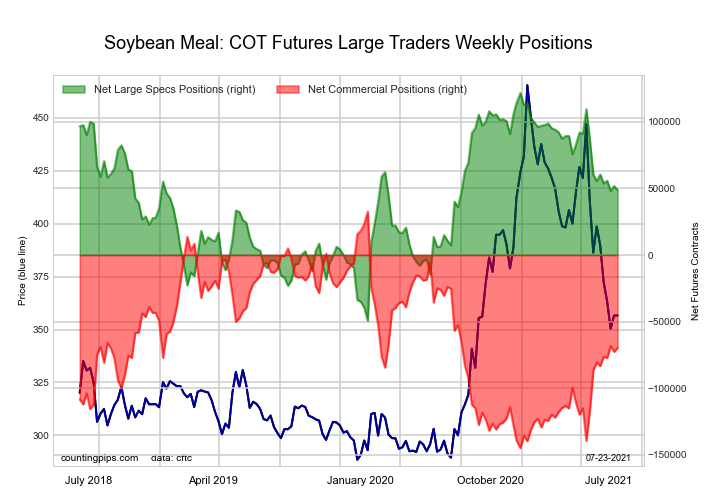
This week’s current strength score (the trader positioning range over the past three years, measured from 0 to 100) shows the speculators are currently Bullish with a score of 60.9 percent. The commercials are Bearish with a score of 39.5 percent and the small traders (not shown in chart) are Bullish with a score of 50.7 percent.
| SOYBEAN MEAL Futures Statistics | SPECULATORS | COMMERCIALS | SMALL TRADERS |
| – Percent of Open Interest Longs: | 23.2 | 52.0 | 12.4 |
| – Percent of Open Interest Shorts: | 8.4 | 72.1 | 7.0 |
| – Net Position: | 54,865 | -74,845 | 19,980 |
| – Gross Longs: | 86,062 | 192,820 | 46,110 |
| – Gross Shorts: | 31,197 | 267,665 | 26,130 |
| – Long to Short Ratio: | 2.8 to 1 | 0.7 to 1 | 1.8 to 1 |
| NET POSITION TREND: | |||
| – COT Index Score (3 Year Range Pct): | 60.9 | 39.5 | 50.7 |
| – COT Index Reading (3 Year Range): | Bullish | Bearish | Bullish |
| NET POSITION MOVEMENT INDEX: | |||
| – 6-Week Change in Strength Index: | -3.3 | 4.8 | -11.9 |
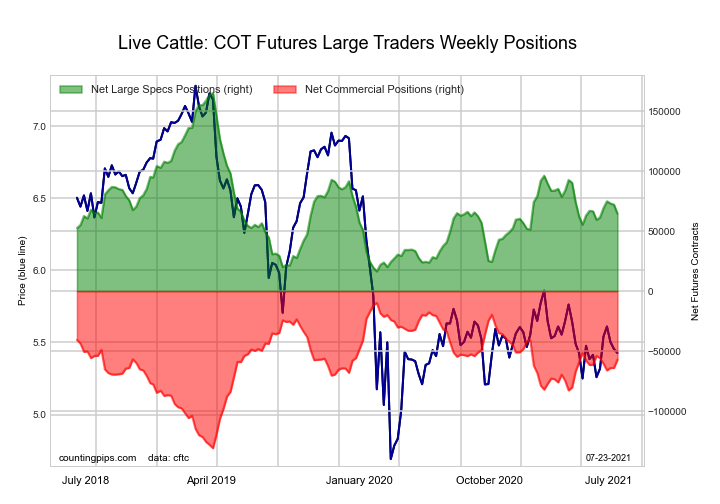
This week’s current strength score (the trader positioning range over the past three years, measured from 0 to 100) shows the speculators are currently Bearish with a score of 30.9 percent. The commercials are Bullish with a score of 64.3 percent and the small traders (not shown in chart) are Bullish with a score of 64.3 percent.
| LIVE CATTLE Futures Statistics | SPECULATORS | COMMERCIALS | SMALL TRADERS |
| – Percent of Open Interest Longs: | 35.5 | 39.5 | 9.5 |
| – Percent of Open Interest Shorts: | 14.9 | 57.1 | 12.6 |
| – Net Position: | 62,386 | -53,028 | -9,358 |
| – Gross Longs: | 107,466 | 119,611 | 28,836 |
| – Gross Shorts: | 45,080 | 172,639 | 38,194 |
| – Long to Short Ratio: | 2.4 to 1 | 0.7 to 1 | 0.8 to 1 |
| NET POSITION TREND: | |||
| – COT Index Score (3 Year Range Pct): | 30.9 | 64.3 | 64.3 |
| – COT Index Reading (3 Year Range): | Bearish | Bullish | Bullish |
| NET POSITION MOVEMENT INDEX: | |||
| – 6-Week Change in Strength Index: | 0.6 | 2.4 | -9.3 |
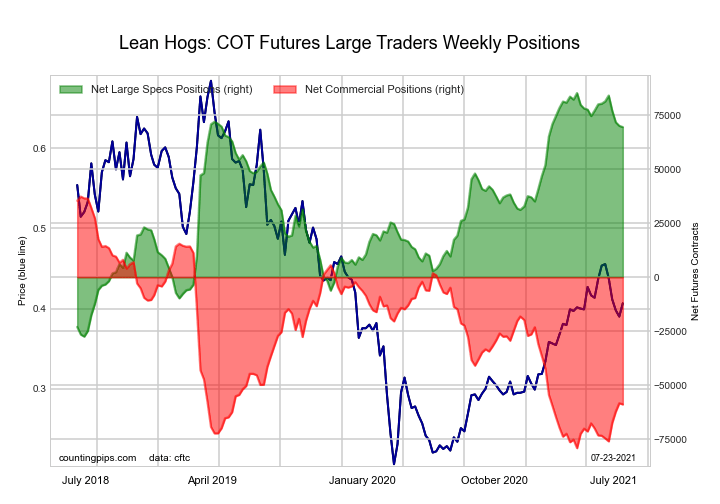
This week’s current strength score (the trader positioning range over the past three years, measured from 0 to 100) shows the speculators are currently Bullish-Extreme with a score of 89.2 percent. The commercials are Bearish-Extreme with a score of 15.8 percent and the small traders (not shown in chart) are Bearish-Extreme with a score of 19.5 percent.
| LEAN HOGS Futures Statistics | SPECULATORS | COMMERCIALS | SMALL TRADERS |
| – Percent of Open Interest Longs: | 43.6 | 31.2 | 7.9 |
| – Percent of Open Interest Shorts: | 15.9 | 54.3 | 12.6 |
| – Net Position: | 73,019 | -60,731 | -12,288 |
| – Gross Longs: | 114,801 | 82,097 | 20,837 |
| – Gross Shorts: | 41,782 | 142,828 | 33,125 |
| – Long to Short Ratio: | 2.7 to 1 | 0.6 to 1 | 0.6 to 1 |
| NET POSITION TREND: | |||
| – COT Index Score (3 Year Range Pct): | 89.2 | 15.8 | 19.5 |
| – COT Index Reading (3 Year Range): | Bullish-Extreme | Bearish-Extreme | Bearish-Extreme |
| NET POSITION MOVEMENT INDEX: | |||
| – 6-Week Change in Strength Index: | -7.4 | 11.9 | -26.1 |
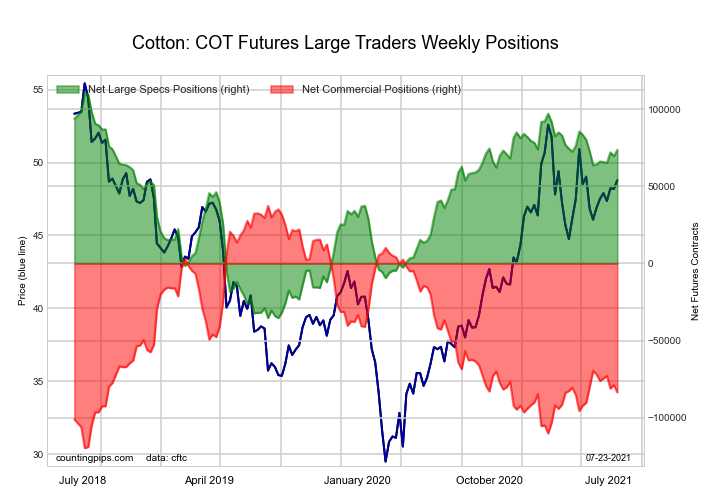
This week’s current strength score (the trader positioning range over the past three years, measured from 0 to 100) shows the speculators are currently Bullish with a score of 77.3 percent. The commercials are Bearish-Extreme with a score of 19.5 percent and the small traders (not shown in chart) are Bullish-Extreme with a score of 87.5 percent.
| COTTON Futures Statistics | SPECULATORS | COMMERCIALS | SMALL TRADERS |
| – Percent of Open Interest Longs: | 40.3 | 41.3 | 7.6 |
| – Percent of Open Interest Shorts: | 7.2 | 79.4 | 2.7 |
| – Net Position: | 77,313 | -88,971 | 11,658 |
| – Gross Longs: | 94,235 | 96,679 | 17,885 |
| – Gross Shorts: | 16,922 | 185,650 | 6,227 |
| – Long to Short Ratio: | 5.6 to 1 | 0.5 to 1 | 2.9 to 1 |
| NET POSITION TREND: | |||
| – COT Index Score (3 Year Range Pct): | 77.3 | 19.5 | 87.5 |
| – COT Index Reading (3 Year Range): | Bullish | Bearish-Extreme | Bullish-Extreme |
| NET POSITION MOVEMENT INDEX: | |||
| – 6-Week Change in Strength Index: | 7.7 | -8.2 | 10.3 |
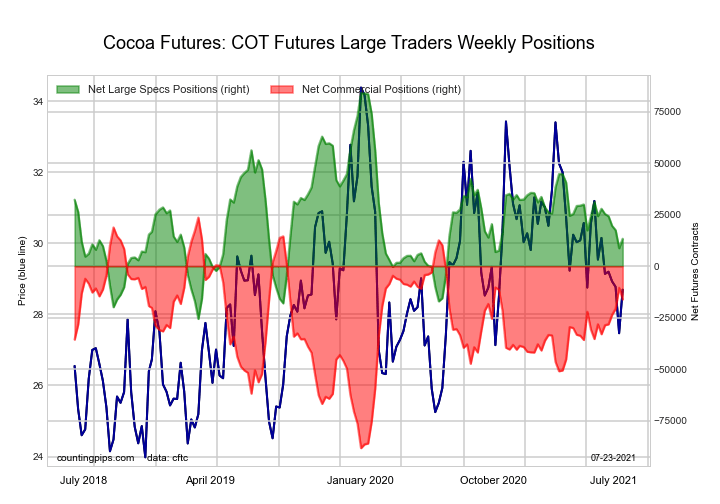
This week’s current strength score (the trader positioning range over the past three years, measured from 0 to 100) shows the speculators are currently Bearish with a score of 35.5 percent. The commercials are Bullish with a score of 64.5 percent and the small traders (not shown in chart) are Bearish with a score of 39.9 percent.
| COCOA Futures Statistics | SPECULATORS | COMMERCIALS | SMALL TRADERS |
| – Percent of Open Interest Longs: | 27.3 | 48.2 | 4.7 |
| – Percent of Open Interest Shorts: | 22.0 | 54.6 | 3.6 |
| – Net Position: | 13,326 | -16,092 | 2,766 |
| – Gross Longs: | 68,772 | 121,390 | 11,767 |
| – Gross Shorts: | 55,446 | 137,482 | 9,001 |
| – Long to Short Ratio: | 1.2 to 1 | 0.9 to 1 | 1.3 to 1 |
| NET POSITION TREND: | |||
| – COT Index Score (3 Year Range Pct): | 35.5 | 64.5 | 39.9 |
| – COT Index Reading (3 Year Range): | Bearish | Bullish | Bearish |
| NET POSITION MOVEMENT INDEX: | |||
| – 6-Week Change in Strength Index: | -13.3 | 15.1 | -26.6 |
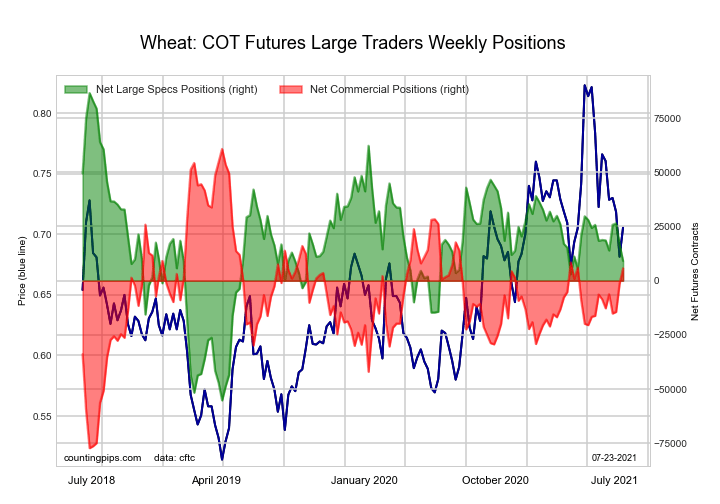
This week’s current strength score (the trader positioning range over the past three years, measured from 0 to 100) shows the speculators are currently Bullish with a score of 57.8 percent. The commercials are Bearish with a score of 47.0 percent and the small traders (not shown in chart) are Bearish with a score of 32.5 percent.
| WHEAT Futures Statistics | SPECULATORS | COMMERCIALS | SMALL TRADERS |
| – Percent of Open Interest Longs: | 32.1 | 38.5 | 7.6 |
| – Percent of Open Interest Shorts: | 24.2 | 42.1 | 11.9 |
| – Net Position: | 26,769 | -12,300 | -14,469 |
| – Gross Longs: | 109,319 | 131,161 | 25,975 |
| – Gross Shorts: | 82,550 | 143,461 | 40,444 |
| – Long to Short Ratio: | 1.3 to 1 | 0.9 to 1 | 0.6 to 1 |
| NET POSITION TREND: | |||
| – COT Index Score (3 Year Range Pct): | 57.8 | 47.0 | 32.5 |
| – COT Index Reading (3 Year Range): | Bullish | Bearish | Bearish |
| NET POSITION MOVEMENT INDEX: | |||
| – 6-Week Change in Strength Index: | 5.8 | 0.3 | -40.8 |
Article By CountingPips.com – Receive our weekly COT Reports by Email
*COT Report: The COT data, released weekly to the public each Friday, is updated through the most recent Tuesday (data is 3 days old) and shows a quick view of how large speculators or non-commercials (for-profit traders) were positioned in the futures markets.
The CFTC categorizes trader positions according to commercial hedgers (traders who use futures contracts for hedging as part of the business), non-commercials (large traders who speculate to realize trading profits) and nonreportable traders (usually small traders/speculators).
Find CFTC criteria here: (http://www.cftc.gov/MarketReports/CommitmentsofTraders/ExplanatoryNotes/index.htm).
By JustMarkets On Thursday, the US stock indices posted strong gains, fully recovering from the…
By Analytical Department RoboForex USD/JPY recovered to 160.60 on Friday following a sharp drop the…
By Patrick J. Schena, Tufts University Creating a government fund to own AI stock and…
By JustMarkets The US equity indices ended Wednesday’s session with notable declines as geopolitical risks…
By Analytical Department RoboForex USD/JPY held near 163.50 on Thursday, with the yen retreating slightly…
By Analytical Department RoboForex GBP/USD continued to consolidate at 1.3283 on Wednesday. The British pound…
This website uses cookies.