By Dmitriy Gurkovskiy, Chief Analyst at RoboForex
Early in the first full week of June, Brent is correcting downwards after rallying before. The asset is trading at $71.35 and surely has room to retreat.
At the same time, the global oil market has a quite positive attitude that started after the June meeting of OPEC+, where everything went pretty well. Members of the cartel and their allies do not consider Iran and its return to the global oil market as a threat and aren’t looking for the market disbalance. Investors liked such comments.
The latest weekly data on the Crude Oil Inventories and the Natural Gas Storage was quite bullish and have already been included in prices.
The oil market is entering a new week having considered all possible news and information.
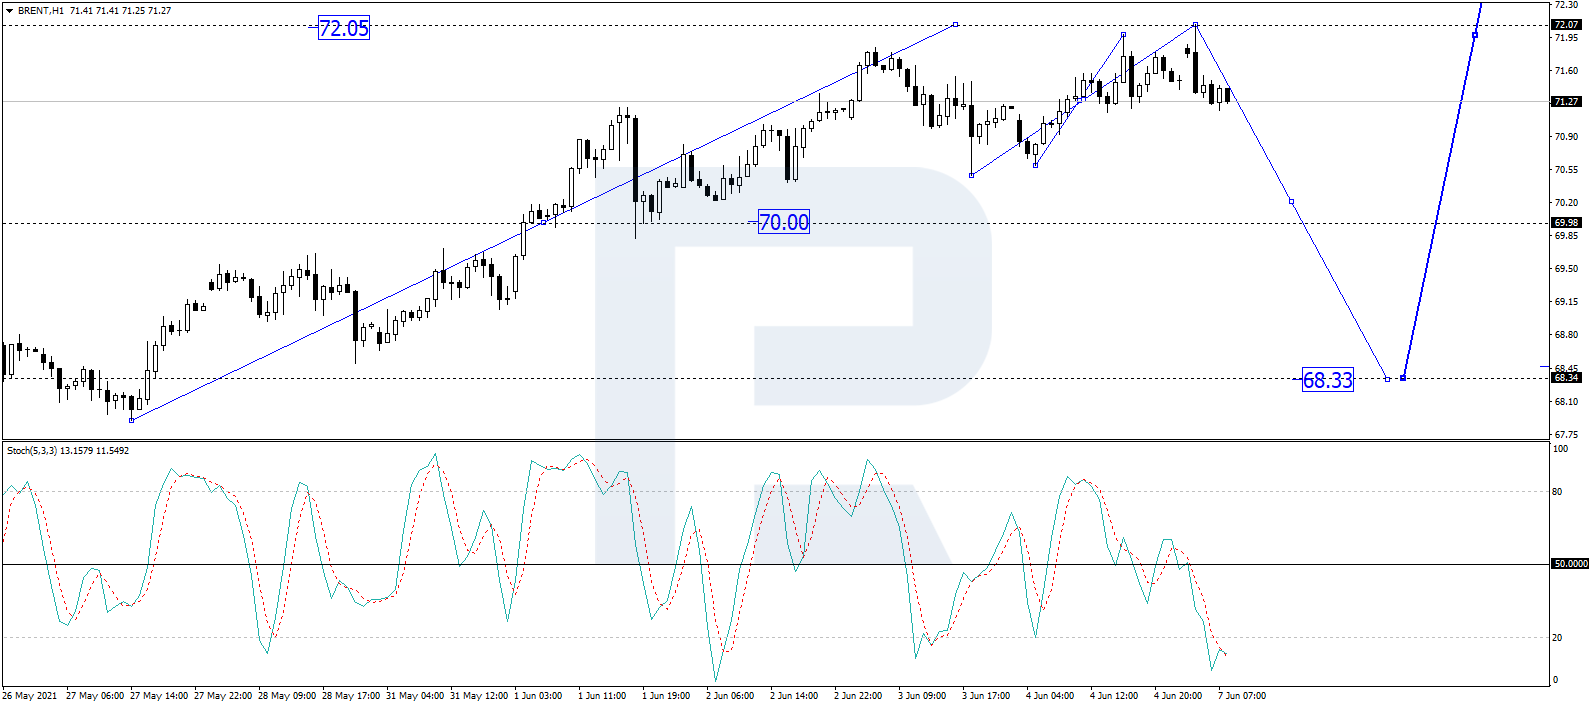
In the H4 chart, after finishing the ascending wave at 72.05, Brent is forming the first descending impulse. Possibly, the asset may start a new pullback to reach 70.00, at least. Later, the market may continue correcting downwards with the target at 68.33. From the technical point of view, this scenario is confirmed by MACD Oscillator: its signal line is moving outside the histogram area and falling towards 0, thus confirming a correctional wave.
Free Reports:
As we can see in the H1 chart, after rebounding from 70.50 and completing another ascending wave at 72.05, Brent is forming a new descending impulse towards 70.00 and may later grow to reach 71.25, thus forming a new consolidation range between the two latter levels. If the price breaks this range to the downside, the instrument may continue the correction towards 68.33; if to the upside – start another growth with the target at 75.55. From the technical point of view, this idea is confirmed by the Stochastic Oscillator: its signal line moving below 20, which means that the asset may soon finish the descending impulse and start a new growth on the price chart. As for the indicator, it is expected to grow towards 50.
Disclaimer
Any forecasts contained herein are based on the author’s particular opinion. This analysis may not be treated as trading advice. RoboForex bears no responsibility for trading results based on trading recommendations and reviews contained herein.
By Analytical Department RoboForex GBP/USD continued to consolidate at 1.3283 on Wednesday. The British pound…
By JustMarkets The US equity indices showed mixed performance on Tuesday. The Dow Jones (US30)…
By Pawan Jain, University of Michigan Flint Finding good financial advice can be stressful –…
Source: Stephen McBride (7/27/26) Stephen McBride of RiskHedge shares his thoughts on the potential for…
By JustMarkets The US equity indices showed mixed performance on Monday ahead of the Federal…
By Analytical Department RoboForex Gold fell to 4,047 USD per ounce on Tuesday, erasing gains…
This website uses cookies.