By CountingPips.com COT Home | Data Tables | Data Downloads | Newsletter
Here are the latest charts and statistics for the Commitment of Traders (COT) data published by the Commodities Futures Trading Commission (CFTC).
The latest COT data is updated through Tuesday May 25 2021 and shows a quick view of how large traders (for-profit speculators and commercial entities) were positioned in the futures markets.
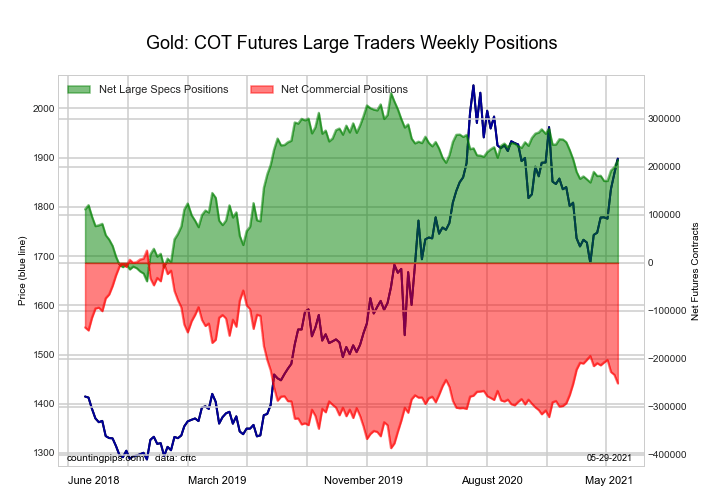
The Gold Comex Futures large speculator standing this week reached a net position of 214,642 contracts in the data reported through Tuesday. This was a weekly lift of 15,753 contracts from the previous week which had a total of 198,889 net contracts.
This week’s current strength score (the trader positioning range over the past three years, measured from 0 to 100) shows the speculators are currently Bullish with a score of 64.5 percent. The commercials are Bearish with a score of 32.7 percent and the small traders (not shown in chart) are Bullish with a score of 71.6 percent.
| Gold Futures Statistics | SPECULATORS | COMMERCIALS | SMALL TRADERS |
| – Percent of Open Interest Longs: | 56.5 | 21.8 | 11.7 |
| – Percent of Open Interest Shorts: | 14.4 | 70.9 | 4.6 |
| – Net Position: | 214,642 | -250,869 | 36,227 |
| – Gross Longs: | 288,266 | 111,024 | 59,511 |
| – Gross Shorts: | 73,624 | 361,893 | 23,284 |
| – Long to Short Ratio: | 3.9 to 1 | 0.3 to 1 | 2.6 to 1 |
| NET POSITION TREND: | |||
| – COT Index Score (3 Year Range Pct): | 64.5 | 32.7 | 71.6 |
| – COT Index Reading (3 Year Range): | Bullish | Bearish | Bullish |
| NET POSITION MOVEMENT INDEX: | |||
| – 6-Week Change in Strength Index: | 8.6 | -10.2 | 20.3 |
Free Reports:
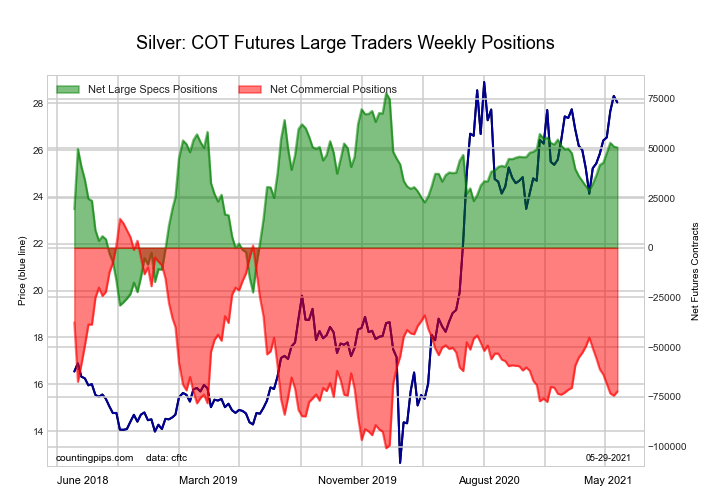
The Silver Comex Futures large speculator standing this week reached a net position of 50,482 contracts in the data reported through Tuesday. This was a weekly lowering of -499 contracts from the previous week which had a total of 50,981 net contracts.
This week’s current strength score (the trader positioning range over the past three years, measured from 0 to 100) shows the speculators are currently Bullish with a score of 74.4 percent. The commercials are Bearish with a score of 24.7 percent and the small traders (not shown in chart) are Bullish with a score of 68.6 percent.
| Silver Futures Statistics | SPECULATORS | COMMERCIALS | SMALL TRADERS |
| – Percent of Open Interest Longs: | 47.6 | 28.5 | 17.4 |
| – Percent of Open Interest Shorts: | 19.6 | 68.4 | 5.3 |
| – Net Position: | 50,482 | -72,274 | 21,792 |
| – Gross Longs: | 86,013 | 51,487 | 31,411 |
| – Gross Shorts: | 35,531 | 123,761 | 9,619 |
| – Long to Short Ratio: | 2.4 to 1 | 0.4 to 1 | 3.3 to 1 |
| NET POSITION TREND: | |||
| – COT Index Score (3 Year Range Pct): | 74.4 | 24.7 | 68.6 |
| – COT Index Reading (3 Year Range): | Bullish | Bearish | Bullish |
| NET POSITION MOVEMENT INDEX: | |||
| – 6-Week Change in Strength Index: | 13.2 | -14.5 | 16.4 |
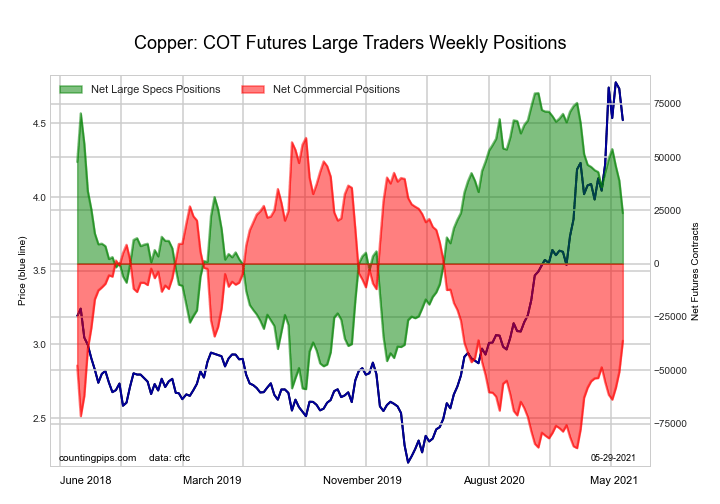
The Copper Grade #1 Futures large speculator standing this week reached a net position of 23,713 contracts in the data reported through Tuesday. This was a weekly decrease of -15,265 contracts from the previous week which had a total of 38,978 net contracts.
This week’s current strength score (the trader positioning range over the past three years, measured from 0 to 100) shows the speculators are currently Bullish with a score of 59.4 percent. The commercials are Bearish with a score of 34.6 percent and the small traders (not shown in chart) are Bullish-Extreme with a score of 98.5 percent.
| Copper Futures Statistics | SPECULATORS | COMMERCIALS | SMALL TRADERS |
| – Percent of Open Interest Longs: | 40.8 | 33.1 | 10.3 |
| – Percent of Open Interest Shorts: | 30.6 | 48.8 | 4.9 |
| – Net Position: | 23,713 | -36,202 | 12,489 |
| – Gross Longs: | 94,206 | 76,319 | 23,807 |
| – Gross Shorts: | 70,493 | 112,521 | 11,318 |
| – Long to Short Ratio: | 1.3 to 1 | 0.7 to 1 | 2.1 to 1 |
| NET POSITION TREND: | |||
| – COT Index Score (3 Year Range Pct): | 59.4 | 34.6 | 98.5 |
| – COT Index Reading (3 Year Range): | Bullish | Bearish | Bullish-Extreme |
| NET POSITION MOVEMENT INDEX: | |||
| – 6-Week Change in Strength Index: | -8.8 | 8.5 | -0.8 |
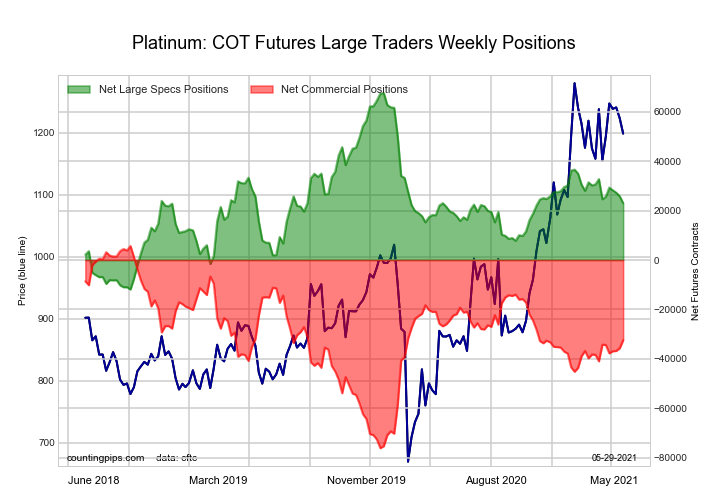
The Platinum Futures large speculator standing this week reached a net position of 22,987 contracts in the data reported through Tuesday. This was a weekly fall of -2,827 contracts from the previous week which had a total of 25,814 net contracts.
This week’s current strength score (the trader positioning range over the past three years, measured from 0 to 100) shows the speculators are currently Bearish with a score of 43.9 percent. The commercials are Bullish with a score of 53.4 percent and the small traders (not shown in chart) are Bullish-Extreme with a score of 93.7 percent.
| Platinum Futures Statistics | SPECULATORS | COMMERCIALS | SMALL TRADERS |
| – Percent of Open Interest Longs: | 56.8 | 20.2 | 17.8 |
| – Percent of Open Interest Shorts: | 22.6 | 68.4 | 3.8 |
| – Net Position: | 22,987 | -32,422 | 9,435 |
| – Gross Longs: | 38,188 | 13,577 | 11,960 |
| – Gross Shorts: | 15,201 | 45,999 | 2,525 |
| – Long to Short Ratio: | 2.5 to 1 | 0.3 to 1 | 4.7 to 1 |
| NET POSITION TREND: | |||
| – COT Index Score (3 Year Range Pct): | 43.9 | 53.4 | 93.7 |
| – COT Index Reading (3 Year Range): | Bearish | Bullish | Bullish-Extreme |
| NET POSITION MOVEMENT INDEX: | |||
| – 6-Week Change in Strength Index: | -2.1 | 2.3 | -2.8 |
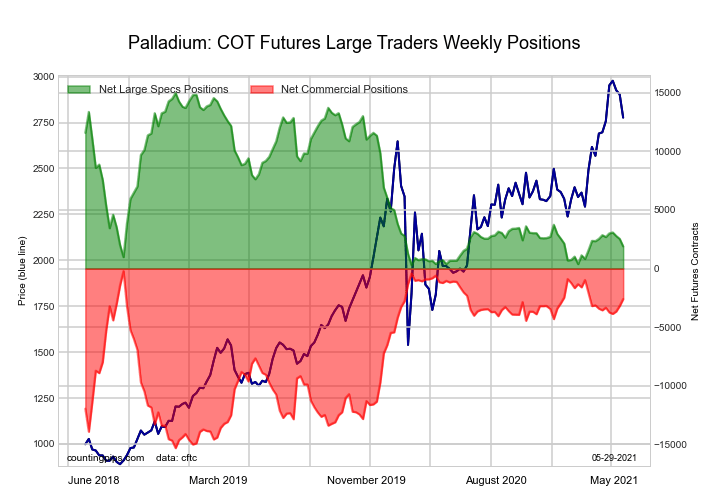
The Palladium Futures large speculator standing this week reached a net position of 1,893 contracts in the data reported through Tuesday. This was a weekly fall of -644 contracts from the previous week which had a total of 2,537 net contracts.
This week’s current strength score (the trader positioning range over the past three years, measured from 0 to 100) shows the speculators are currently Bearish-Extreme with a score of 10.9 percent. The commercials are Bullish-Extreme with a score of 84.2 percent and the small traders (not shown in chart) are Bullish-Extreme with a score of 86.3 percent.
| Palladium Futures Statistics | SPECULATORS | COMMERCIALS | SMALL TRADERS |
| – Percent of Open Interest Longs: | 51.8 | 28.9 | 14.8 |
| – Percent of Open Interest Shorts: | 34.0 | 53.3 | 8.2 |
| – Net Position: | 1,893 | -2,598 | 705 |
| – Gross Longs: | 5,508 | 3,066 | 1,575 |
| – Gross Shorts: | 3,615 | 5,664 | 870 |
| – Long to Short Ratio: | 1.5 to 1 | 0.5 to 1 | 1.8 to 1 |
| NET POSITION TREND: | |||
| – COT Index Score (3 Year Range Pct): | 10.9 | 84.2 | 86.3 |
| – COT Index Reading (3 Year Range): | Bearish-Extreme | Bullish-Extreme | Bullish-Extreme |
| NET POSITION MOVEMENT INDEX: | |||
| – 6-Week Change in Strength Index: | -6.5 | 6.3 | 0.5 |
Article By CountingPips.com – Receive our weekly COT Reports by Email
*COT Report: The COT data, released weekly to the public each Friday, is updated through the most recent Tuesday (data is 3 days old) and shows a quick view of how large speculators or non-commercials (for-profit traders) were positioned in the futures markets.
The CFTC categorizes trader positions according to commercial hedgers (traders who use futures contracts for hedging as part of the business), non-commercials (large traders who speculate to realize trading profits) and nonreportable traders (usually small traders/speculators).
Find CFTC criteria here: (http://www.cftc.gov/MarketReports/CommitmentsofTraders/ExplanatoryNotes/index.htm).
By Analytical Department RoboForex Gold fell to 4,033 USD per ounce on Thursday, extending its…
By JustMarkets By the end of the day, the Dow Jones Index (US30) rose by…
By JustMarkets On Tuesday, the US stock indices finished the session in the green, supported…
By Analytical Department RoboForex GBP/USD rose to 1.3403 on Wednesday, with British politics taking centre…
By Analytical Department RoboForex USD/JPY ended Tuesday at 162.27, with the Japanese yen remaining near…
By JustMarkets On Friday, the Dow Jones Index (US30) rose by 0.29% (weekly: -0.36%). The…
This website uses cookies.