By CountingPips.com COT Home | Data Tables | Data Downloads | Newsletter
Here are the latest charts and statistics for the Commitment of Traders (COT) data published by the Commodities Futures Trading Commission (CFTC).
The latest COT data is updated through Tuesday May 25 2021 and shows a quick view of how large traders (for-profit speculators and commercial entities) were positioned in the futures markets.
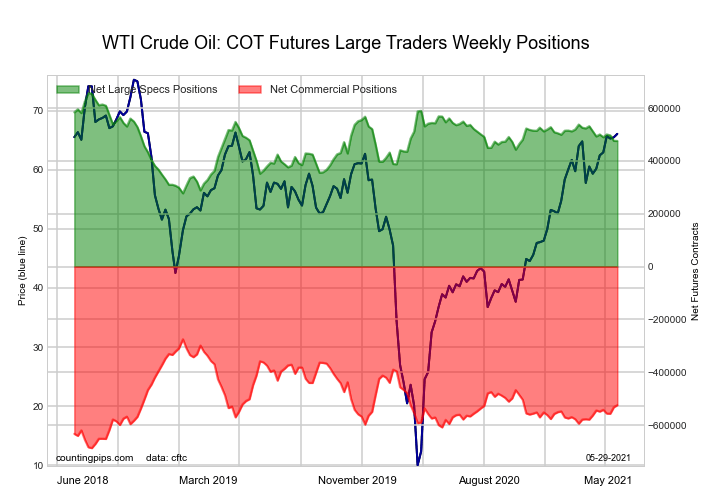
The WTI Crude Oil Futures large speculator standing this week totaled a net position of 475,490 contracts in the data reported through Tuesday. This was a weekly lowering of -457 contracts from the previous week which had a total of 475,947 net contracts.
This week’s current strength score (the trader positioning range over the past three years, measured from 0 to 100) shows the speculators are currently Bullish with a score of 52.2 percent. The commercials are Bearish with a score of 39.5 percent and the small traders (not shown in chart) are Bullish-Extreme with a score of 84.1 percent.
| WTI Crude Oil Futures Statistics | SPECULATORS | COMMERCIALS | SMALL TRADERS |
| – Percent of Open Interest Longs: | 25.8 | 34.9 | 4.2 |
| – Percent of Open Interest Shorts: | 6.2 | 56.6 | 2.1 |
| – Net Position: | 475,490 | -524,540 | 49,050 |
| – Gross Longs: | 625,568 | 847,843 | 100,701 |
| – Gross Shorts: | 150,078 | 1,372,383 | 51,651 |
| – Long to Short Ratio: | 4.2 to 1 | 0.6 to 1 | 1.9 to 1 |
| NET POSITION TREND: | |||
| – COT Index Score (3 Year Range Pct): | 52.2 | 39.5 | 84.1 |
| – COT Index Reading (3 Year Range): | Bullish | Bearish | Bullish-Extreme |
| NET POSITION MOVEMENT INDEX: | |||
| – 6-Week Change in Strength Index: | -4.5 | 4.9 | -4.2 |
Free Reports:
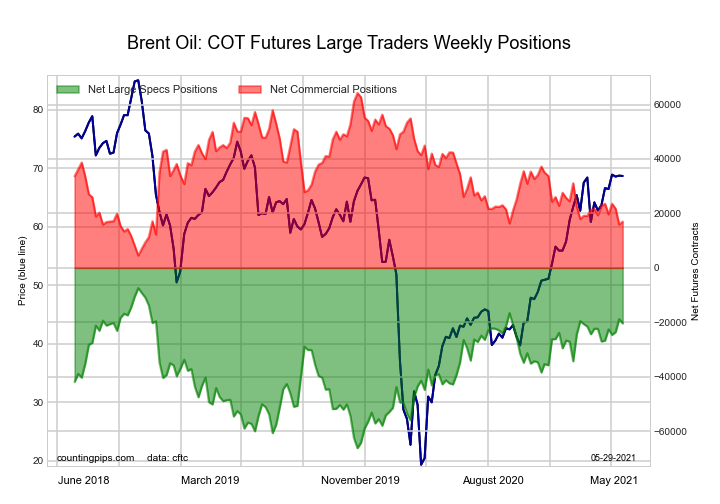
The Brent Crude Oil Futures large speculator standing this week totaled a net position of -20,382 contracts in the data reported through Tuesday. This was a weekly decline of -1,562 contracts from the previous week which had a total of -18,820 net contracts.
This week’s current strength score (the trader positioning range over the past three years, measured from 0 to 100) shows the speculators are currently Bullish with a score of 77.9 percent. The commercials are Bearish with a score of 20.9 percent and the small traders (not shown in chart) are Bullish with a score of 61.0 percent.
| Brent Crude Oil Futures Statistics | SPECULATORS | COMMERCIALS | SMALL TRADERS |
| – Percent of Open Interest Longs: | 21.0 | 46.8 | 4.9 |
| – Percent of Open Interest Shorts: | 31.3 | 38.2 | 3.1 |
| – Net Position: | -20,382 | 16,979 | 3,403 |
| – Gross Longs: | 41,473 | 92,317 | 9,611 |
| – Gross Shorts: | 61,855 | 75,338 | 6,208 |
| – Long to Short Ratio: | 0.7 to 1 | 1.2 to 1 | 1.5 to 1 |
| NET POSITION TREND: | |||
| – COT Index Score (3 Year Range Pct): | 77.9 | 20.9 | 61.0 |
| – COT Index Reading (3 Year Range): | Bullish | Bearish | Bullish |
| NET POSITION MOVEMENT INDEX: | |||
| – 6-Week Change in Strength Index: | 11.3 | -9.6 | -7.5 |
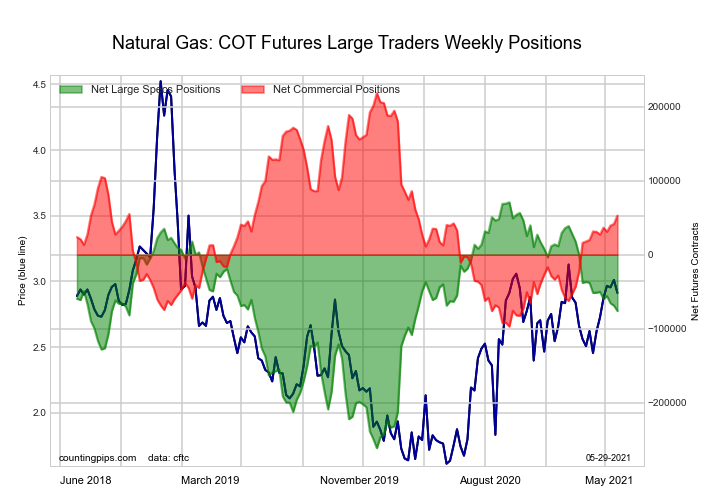
The Natural Gas Futures large speculator standing this week totaled a net position of -76,028 contracts in the data reported through Tuesday. This was a weekly decrease of -7,276 contracts from the previous week which had a total of -68,752 net contracts.
This week’s current strength score (the trader positioning range over the past three years, measured from 0 to 100) shows the speculators are currently Bullish with a score of 55.8 percent. The commercials are Bearish with a score of 47.5 percent and the small traders (not shown in chart) are Bearish with a score of 21.3 percent.
| Natural Gas Futures Statistics | SPECULATORS | COMMERCIALS | SMALL TRADERS |
| – Percent of Open Interest Longs: | 24.2 | 41.3 | 4.7 |
| – Percent of Open Interest Shorts: | 30.6 | 36.9 | 2.8 |
| – Net Position: | -76,028 | 52,934 | 23,094 |
| – Gross Longs: | 286,247 | 489,201 | 55,783 |
| – Gross Shorts: | 362,275 | 436,267 | 32,689 |
| – Long to Short Ratio: | 0.8 to 1 | 1.1 to 1 | 1.7 to 1 |
| NET POSITION TREND: | |||
| – COT Index Score (3 Year Range Pct): | 55.8 | 47.5 | 21.3 |
| – COT Index Reading (3 Year Range): | Bullish | Bearish | Bearish |
| NET POSITION MOVEMENT INDEX: | |||
| – 6-Week Change in Strength Index: | -7.4 | 6.9 | 8.9 |
The Gasoline Blendstock Futures large speculator standing this week totaled a net position of 53,368 contracts in the data reported through Tuesday. This was a weekly decline of -4,025 contracts from the previous week which had a total of 57,393 net contracts.
This week’s current strength score (the trader positioning range over the past three years, measured from 0 to 100) shows the speculators are currently Bearish-Extreme with a score of 14.1 percent. The commercials are Bullish with a score of 76.2 percent and the small traders (not shown in chart) are Bullish with a score of 66.1 percent.
| Nasdaq Mini Futures Statistics | SPECULATORS | COMMERCIALS | SMALL TRADERS |
| – Percent of Open Interest Longs: | 25.1 | 47.9 | 5.9 |
| – Percent of Open Interest Shorts: | 11.3 | 64.1 | 3.6 |
| – Net Position: | 53,368 | -62,503 | 9,135 |
| – Gross Longs: | 96,895 | 184,974 | 22,898 |
| – Gross Shorts: | 43,527 | 247,477 | 13,763 |
| – Long to Short Ratio: | 2.2 to 1 | 0.7 to 1 | 1.7 to 1 |
| NET POSITION TREND: | |||
| – COT Index Score (3 Year Range Pct): | 14.1 | 76.2 | 66.1 |
| – COT Index Reading (3 Year Range): | Bearish-Extreme | Bullish | Bullish |
| NET POSITION MOVEMENT INDEX: | |||
| – 6-Week Change in Strength Index: | 13.1 | -10.3 | -7.4 |
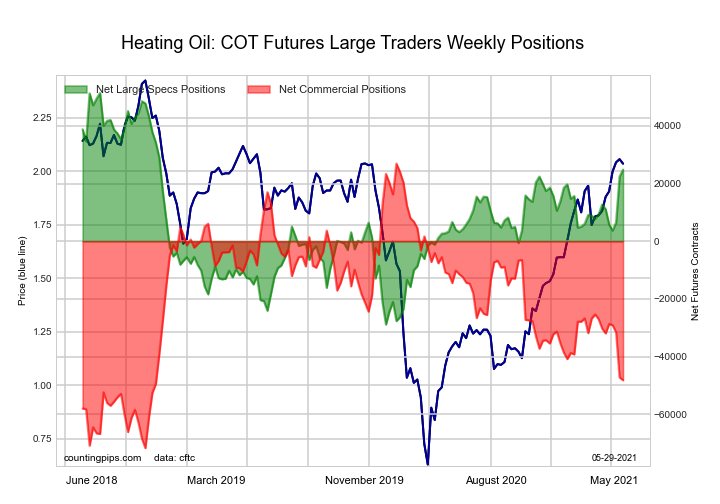
The #2 Heating Oil NY-Harbor Futures large speculator standing this week totaled a net position of 24,830 contracts in the data reported through Tuesday. This was a weekly advance of 2,404 contracts from the previous week which had a total of 22,426 net contracts.
This week’s current strength score (the trader positioning range over the past three years, measured from 0 to 100) shows the speculators are currently Bullish with a score of 66.9 percent. The commercials are Bearish with a score of 23.9 percent and the small traders (not shown in chart) are Bullish-Extreme with a score of 91.8 percent.
| Heating Oil Futures Statistics | SPECULATORS | COMMERCIALS | SMALL TRADERS |
| – Percent of Open Interest Longs: | 16.5 | 49.8 | 11.6 |
| – Percent of Open Interest Shorts: | 10.7 | 61.0 | 6.2 |
| – Net Position: | 24,830 | -48,134 | 23,304 |
| – Gross Longs: | 70,877 | 213,722 | 49,970 |
| – Gross Shorts: | 46,047 | 261,856 | 26,666 |
| – Long to Short Ratio: | 1.5 to 1 | 0.8 to 1 | 1.9 to 1 |
| NET POSITION TREND: | |||
| – COT Index Score (3 Year Range Pct): | 66.9 | 23.9 | 91.8 |
| – COT Index Reading (3 Year Range): | Bullish | Bearish | Bullish-Extreme |
| NET POSITION MOVEMENT INDEX: | |||
| – 6-Week Change in Strength Index: | 15.1 | -18.2 | 23.2 |
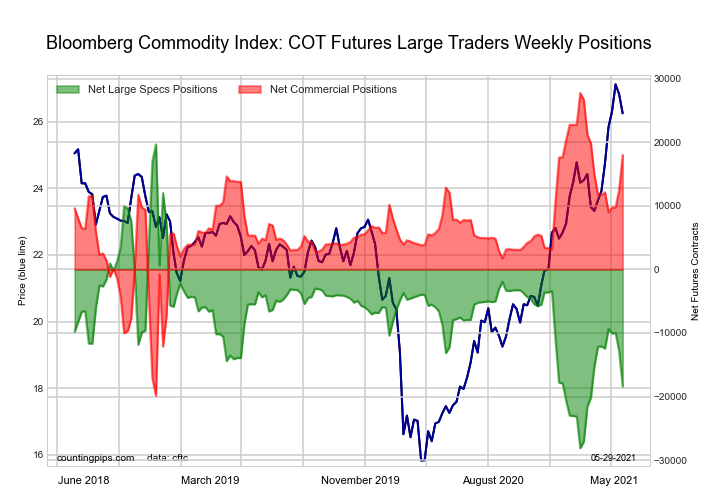
The Bloomberg Commodity Index Futures large speculator standing this week totaled a net position of -18,376 contracts in the data reported through Tuesday. This was a weekly decline of -5,478 contracts from the previous week which had a total of -12,898 net contracts.
This week’s current strength score (the trader positioning range over the past three years, measured from 0 to 100) shows the speculators are currently Bearish with a score of 20.4 percent. The commercials are Bullish with a score of 79.6 percent and the small traders (not shown in chart) are Bullish with a score of 68.9 percent.
| Bloomberg Index Futures Statistics | SPECULATORS | COMMERCIALS | SMALL TRADERS |
| – Percent of Open Interest Longs: | 50.9 | 48.0 | 1.0 |
| – Percent of Open Interest Shorts: | 90.9 | 8.8 | 0.2 |
| – Net Position: | -18,376 | 18,013 | 363 |
| – Gross Longs: | 23,375 | 22,053 | 472 |
| – Gross Shorts: | 41,751 | 4,040 | 109 |
| – Long to Short Ratio: | 0.6 to 1 | 5.5 to 1 | 4.3 to 1 |
| NET POSITION TREND: | |||
| – COT Index Score (3 Year Range Pct): | 20.4 | 79.6 | 68.9 |
| – COT Index Reading (3 Year Range): | Bearish | Bullish | Bullish |
| NET POSITION MOVEMENT INDEX: | |||
| – 6-Week Change in Strength Index: | -13.1 | 13.2 | -1.1 |
Article By CountingPips.com – Receive our weekly COT Reports by Email
*COT Report: The COT data, released weekly to the public each Friday, is updated through the most recent Tuesday (data is 3 days old) and shows a quick view of how large speculators or non-commercials (for-profit traders) were positioned in the futures markets.
The CFTC categorizes trader positions according to commercial hedgers (traders who use futures contracts for hedging as part of the business), non-commercials (large traders who speculate to realize trading profits) and nonreportable traders (usually small traders/speculators).
Find CFTC criteria here: (http://www.cftc.gov/MarketReports/CommitmentsofTraders/ExplanatoryNotes/index.htm).
By Analytical Department RoboForex Gold fell to 4,033 USD per ounce on Thursday, extending its…
By JustMarkets By the end of the day, the Dow Jones Index (US30) rose by…
By JustMarkets On Tuesday, the US stock indices finished the session in the green, supported…
By Analytical Department RoboForex GBP/USD rose to 1.3403 on Wednesday, with British politics taking centre…
By Analytical Department RoboForex USD/JPY ended Tuesday at 162.27, with the Japanese yen remaining near…
By JustMarkets On Friday, the Dow Jones Index (US30) rose by 0.29% (weekly: -0.36%). The…
This website uses cookies.