By CountingPips.com COT Home | Data Tables | Data Downloads | Newsletter
Here are the latest charts and statistics for the Commitment of Traders (COT) data published by the Commodities Futures Trading Commission (CFTC).
The latest COT data is updated through Tuesday May 04 2021 and shows a quick view of how large traders (for-profit speculators and commercial entities) were positioned in the futures markets.
The 30-Day Federal Funds large speculator standing this week resulted in a net position of -288,552 contracts in the data reported through Tuesday. This was a weekly fall of -117,508 contracts from the previous week which had a total of -171,044 net contracts.
This week’s current strength score (the trader positioning range over the past three years, measured from 0 to 100) shows the speculators are currently Bearish-Extreme with a score of 0.0 percent. The commercials are Bullish-Extreme with a score of 100.0 percent and the small traders (not shown in chart) are Bullish with a score of 53.9 percent.
| 30-Day Federal Funds Statistics | SPECULATORS | COMMERCIALS | SMALL TRADERS |
| – Percent of Open Interest Longs: | 3.1 | 77.5 | 2.0 |
| – Percent of Open Interest Shorts: | 32.2 | 47.3 | 2.9 |
| – Net Position: | -288,552 | 298,013 | -9,461 |
| – Gross Longs: | 30,283 | 766,053 | 19,394 |
| – Gross Shorts: | 318,835 | 468,040 | 28,855 |
| – Long to Short Ratio: | 0.1 to 1 | 1.6 to 1 | 0.7 to 1 |
| NET POSITION TREND: | |||
| – COT Index Score (3 Year Range Pct): | 0.0 | 100.0 | 53.9 |
| – COT Index Reading (3 Year Range): | Bearish-Extreme | Bullish-Extreme | Bullish |
| NET POSITION MOVEMENT INDEX: | |||
| – 6-Week Change in Strength Index: | -27.1 | 27.0 | -5.0 |
Free Reports:
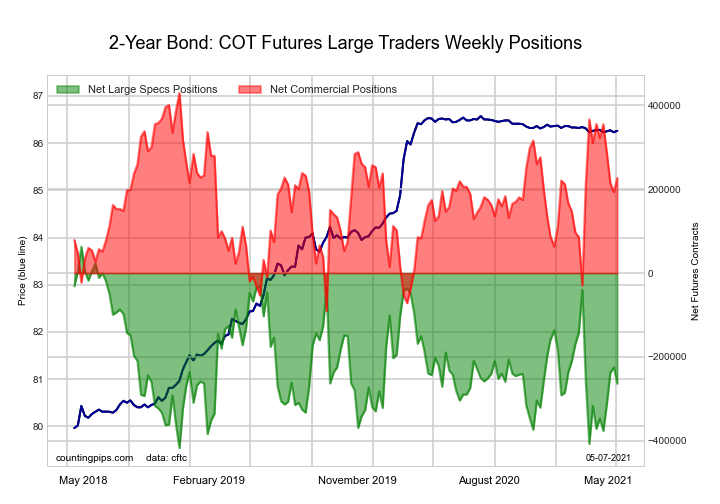
The 2-Year Treasury Note large speculator standing this week resulted in a net position of -263,456 contracts in the data reported through Tuesday. This was a weekly decline of -38,724 contracts from the previous week which had a total of -224,732 net contracts.
This week’s current strength score (the trader positioning range over the past three years, measured from 0 to 100) shows the speculators are currently Bearish with a score of 32.0 percent. The commercials are Bullish with a score of 61.1 percent and the small traders (not shown in chart) are Bullish with a score of 54.1 percent.
| 2-Year Treasury Note Statistics | SPECULATORS | COMMERCIALS | SMALL TRADERS |
| – Percent of Open Interest Longs: | 17.9 | 74.5 | 6.3 |
| – Percent of Open Interest Shorts: | 29.0 | 64.9 | 4.8 |
| – Net Position: | -263,456 | 226,934 | 36,522 |
| – Gross Longs: | 422,520 | 1,760,922 | 149,783 |
| – Gross Shorts: | 685,976 | 1,533,988 | 113,261 |
| – Long to Short Ratio: | 0.6 to 1 | 1.1 to 1 | 1.3 to 1 |
| NET POSITION TREND: | |||
| – COT Index Score (3 Year Range Pct): | 32.0 | 61.1 | 54.1 |
| – COT Index Reading (3 Year Range): | Bearish | Bullish | Bullish |
| NET POSITION MOVEMENT INDEX: | |||
| – 6-Week Change in Strength Index: | 22.5 | -24.7 | 10.9 |
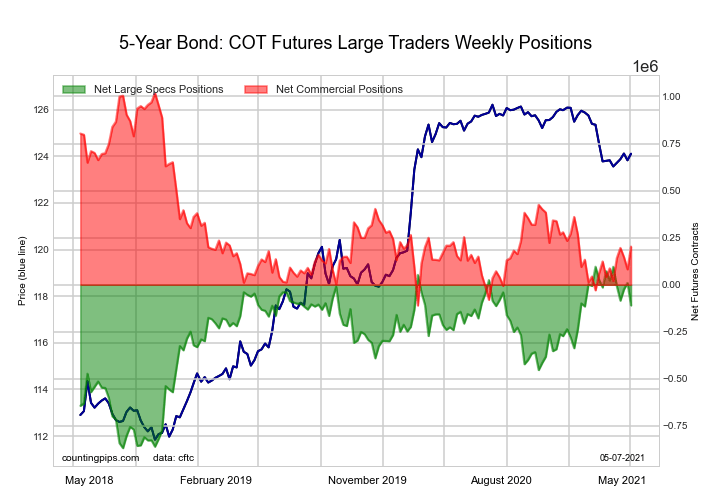
The 5-Year Treasury Note large speculator standing this week resulted in a net position of -109,619 contracts in the data reported through Tuesday. This was a weekly reduction of -119,153 contracts from the previous week which had a total of 9,534 net contracts.
This week’s current strength score (the trader positioning range over the past three years, measured from 0 to 100) shows the speculators are currently Bullish with a score of 78.7 percent. The commercials are Bearish with a score of 27.7 percent and the small traders (not shown in chart) are Bearish with a score of 33.8 percent.
| 5-Year Treasury Note Statistics | SPECULATORS | COMMERCIALS | SMALL TRADERS |
| – Percent of Open Interest Longs: | 10.1 | 78.4 | 8.5 |
| – Percent of Open Interest Shorts: | 13.3 | 72.5 | 11.3 |
| – Net Position: | -109,619 | 202,363 | -92,744 |
| – Gross Longs: | 342,368 | 2,659,008 | 289,241 |
| – Gross Shorts: | 451,987 | 2,456,645 | 381,985 |
| – Long to Short Ratio: | 0.8 to 1 | 1.1 to 1 | 0.8 to 1 |
| NET POSITION TREND: | |||
| – COT Index Score (3 Year Range Pct): | 78.7 | 27.7 | 33.8 |
| – COT Index Reading (3 Year Range): | Bullish | Bearish | Bearish |
| NET POSITION MOVEMENT INDEX: | |||
| – 6-Week Change in Strength Index: | -13.8 | 10.2 | 7.1 |
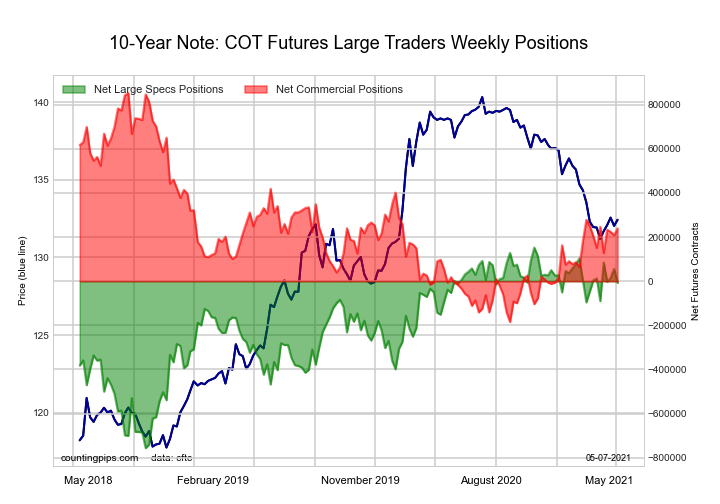
The 10-Year Treasury Note large speculator standing this week resulted in a net position of -7,245 contracts in the data reported through Tuesday. This was a weekly lowering of -63,004 contracts from the previous week which had a total of 55,759 net contracts.
This week’s current strength score (the trader positioning range over the past three years, measured from 0 to 100) shows the speculators are currently Bullish-Extreme with a score of 82.4 percent. The commercials are Bearish with a score of 40.8 percent and the small traders (not shown in chart) are Bearish-Extreme with a score of 10.9 percent.
| 10-Year Treasury Note Statistics | SPECULATORS | COMMERCIALS | SMALL TRADERS |
| – Percent of Open Interest Longs: | 19.2 | 70.2 | 7.9 |
| – Percent of Open Interest Shorts: | 19.4 | 64.6 | 13.3 |
| – Net Position: | -7,245 | 239,211 | -231,966 |
| – Gross Longs: | 818,849 | 2,990,625 | 336,630 |
| – Gross Shorts: | 826,094 | 2,751,414 | 568,596 |
| – Long to Short Ratio: | 1.0 to 1 | 1.1 to 1 | 0.6 to 1 |
| NET POSITION TREND: | |||
| – COT Index Score (3 Year Range Pct): | 82.4 | 40.8 | 10.9 |
| – COT Index Reading (3 Year Range): | Bullish-Extreme | Bearish | Bearish-Extreme |
| NET POSITION MOVEMENT INDEX: | |||
| – 6-Week Change in Strength Index: | -2.2 | 8.5 | -18.9 |
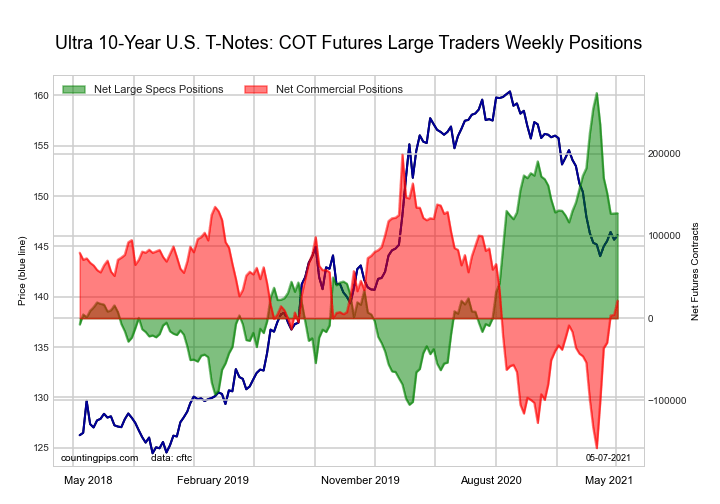
The Ultra 10-Year Notes large speculator standing this week resulted in a net position of 127,622 contracts in the data reported through Tuesday. This was a weekly advance of 257 contracts from the previous week which had a total of 127,365 net contracts.
This week’s current strength score (the trader positioning range over the past three years, measured from 0 to 100) shows the speculators are currently Bullish with a score of 61.4 percent. The commercials are Bullish with a score of 50.2 percent and the small traders (not shown in chart) are Bearish-Extreme with a score of 0.0 percent.
| Ultra 10-Year Notes Statistics | SPECULATORS | COMMERCIALS | SMALL TRADERS |
| – Percent of Open Interest Longs: | 19.7 | 72.1 | 7.8 |
| – Percent of Open Interest Shorts: | 11.4 | 70.7 | 17.5 |
| – Net Position: | 127,622 | 21,208 | -148,830 |
| – Gross Longs: | 301,615 | 1,103,948 | 119,679 |
| – Gross Shorts: | 173,993 | 1,082,740 | 268,509 |
| – Long to Short Ratio: | 1.7 to 1 | 1.0 to 1 | 0.4 to 1 |
| NET POSITION TREND: | |||
| – COT Index Score (3 Year Range Pct): | 61.4 | 50.2 | 0.0 |
| – COT Index Reading (3 Year Range): | Bullish | Bullish | Bearish-Extreme |
| NET POSITION MOVEMENT INDEX: | |||
| – 6-Week Change in Strength Index: | -38.6 | 50.2 | -26.8 |
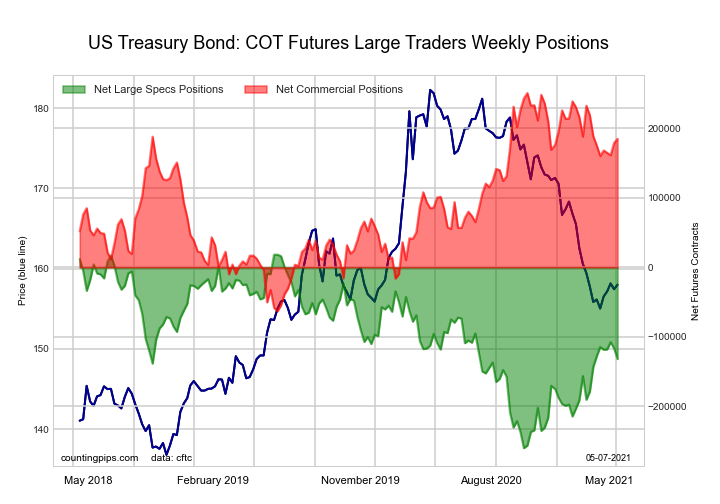
The US Treasury Bonds large speculator standing this week resulted in a net position of -131,786 contracts in the data reported through Tuesday. This was a weekly fall of -15,169 contracts from the previous week which had a total of -116,617 net contracts.
This week’s current strength score (the trader positioning range over the past three years, measured from 0 to 100) shows the speculators are currently Bearish with a score of 46.1 percent. The commercials are Bullish with a score of 79.0 percent and the small traders (not shown in chart) are Bearish-Extreme with a score of 13.7 percent.
| US Treasury Bonds Statistics | SPECULATORS | COMMERCIALS | SMALL TRADERS |
| – Percent of Open Interest Longs: | 7.0 | 77.9 | 12.8 |
| – Percent of Open Interest Shorts: | 18.1 | 62.4 | 17.3 |
| – Net Position: | -131,786 | 184,813 | -53,027 |
| – Gross Longs: | 83,644 | 928,191 | 152,503 |
| – Gross Shorts: | 215,430 | 743,378 | 205,530 |
| – Long to Short Ratio: | 0.4 to 1 | 1.2 to 1 | 0.7 to 1 |
| NET POSITION TREND: | |||
| – COT Index Score (3 Year Range Pct): | 46.1 | 79.0 | 13.7 |
| – COT Index Reading (3 Year Range): | Bearish | Bullish | Bearish-Extreme |
| NET POSITION MOVEMENT INDEX: | |||
| – 6-Week Change in Strength Index: | -1.5 | 3.1 | -4.3 |
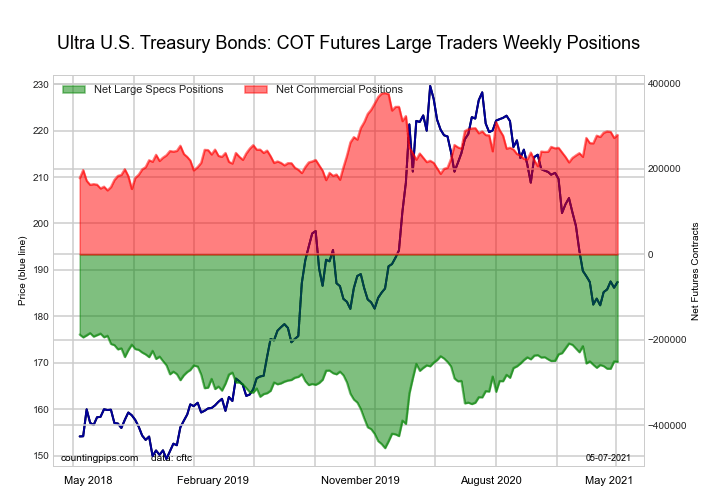
The Ultra US Treasury Bonds large speculator standing this week resulted in a net position of -251,517 contracts in the data reported through Tuesday. This was a weekly lowering of -689 contracts from the previous week which had a total of -250,828 net contracts.
This week’s current strength score (the trader positioning range over the past three years, measured from 0 to 100) shows the speculators are currently Bullish with a score of 75.1 percent. The commercials are Bullish with a score of 57.0 percent and the small traders (not shown in chart) are Bearish-Extreme with a score of 0.0 percent.
| Ultra US Treasury Bonds Statistics | SPECULATORS | COMMERCIALS | SMALL TRADERS |
| – Percent of Open Interest Longs: | 5.3 | 82.1 | 12.1 |
| – Percent of Open Interest Shorts: | 27.5 | 57.4 | 14.5 |
| – Net Position: | -251,517 | 279,812 | -28,295 |
| – Gross Longs: | 60,471 | 932,454 | 136,958 |
| – Gross Shorts: | 311,988 | 652,642 | 165,253 |
| – Long to Short Ratio: | 0.2 to 1 | 1.4 to 1 | 0.8 to 1 |
| NET POSITION TREND: | |||
| – COT Index Score (3 Year Range Pct): | 75.1 | 57.0 | 0.0 |
| – COT Index Reading (3 Year Range): | Bullish | Bullish | Bearish-Extreme |
| NET POSITION MOVEMENT INDEX: | |||
| – 6-Week Change in Strength Index: | 5.3 | 0.8 | -12.4 |
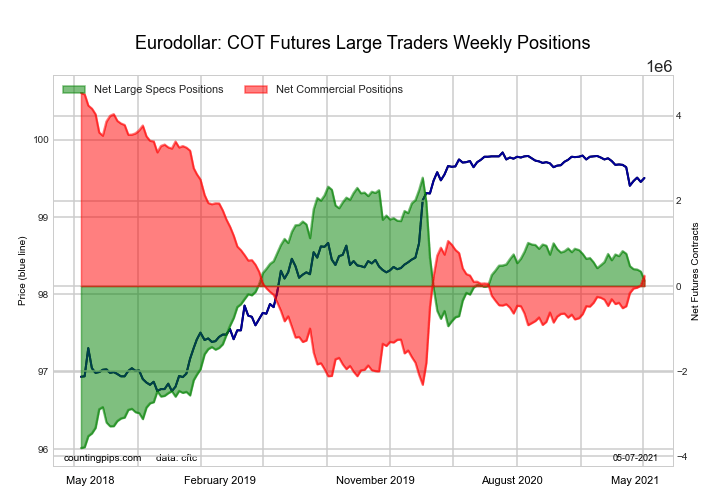
The 3-Month Eurodollars large speculator standing this week resulted in a net position of 125,153 contracts in the data reported through Tuesday. This was a weekly reduction of -217,068 contracts from the previous week which had a total of 342,221 net contracts.
This week’s current strength score (the trader positioning range over the past three years, measured from 0 to 100) shows the speculators are currently Bullish with a score of 61.9 percent. The commercials are Bearish with a score of 37.4 percent and the small traders (not shown in chart) are Bullish with a score of 55.1 percent.
| 3-Month Eurodollars Statistics | SPECULATORS | COMMERCIALS | SMALL TRADERS |
| – Percent of Open Interest Longs: | 21.9 | 50.4 | 4.9 |
| – Percent of Open Interest Shorts: | 20.8 | 48.4 | 7.9 |
| – Net Position: | 125,153 | 242,656 | -367,809 |
| – Gross Longs: | 2,662,831 | 6,139,211 | 590,518 |
| – Gross Shorts: | 2,537,678 | 5,896,555 | 958,327 |
| – Long to Short Ratio: | 1.0 to 1 | 1.0 to 1 | 0.6 to 1 |
| NET POSITION TREND: | |||
| – COT Index Score (3 Year Range Pct): | 61.9 | 37.4 | 55.1 |
| – COT Index Reading (3 Year Range): | Bullish | Bearish | Bullish |
| NET POSITION MOVEMENT INDEX: | |||
| – 6-Week Change in Strength Index: | -11.0 | 11.1 | -8.5 |
Article By CountingPips.com – Receive our weekly COT Reports by Email
*COT Report: The COT data, released weekly to the public each Friday, is updated through the most recent Tuesday (data is 3 days old) and shows a quick view of how large speculators or non-commercials (for-profit traders) were positioned in the futures markets.
The CFTC categorizes trader positions according to commercial hedgers (traders who use futures contracts for hedging as part of the business), non-commercials (large traders who speculate to realize trading profits) and nonreportable traders (usually small traders/speculators).
Find CFTC criteria here: (http://www.cftc.gov/MarketReports/CommitmentsofTraders/ExplanatoryNotes/index.htm).
By Jeffrey Young, Georgia Institute of Technology You’ve probably heard artificial intelligence models described as…
Source: Barry Dawes (7/23/26) Barry Dawes of Martin Place Securities shares his analysis of the…
By JustMarkets The US stock indices ended Thursday’s session with a notable decline amid a…
By Analytical Department RoboForex USD/JPY soared to 163.81 on Friday, marking a new 40-year high.…
By JustMarkets The US equities ended Wednesday’s session lower amid investor caution ahead of the…
By Analytical Department RoboForex EUR/USD rose to 1.1429 on Thursday, with the US dollar continuing…
This website uses cookies.