By CountingPips.com COT Home | Data Tables | Data Downloads | Newsletter
Here are the latest charts and statistics for the Commitment of Traders (COT) data published by the Commodities Futures Trading Commission (CFTC).
The latest COT data is updated through Tuesday April 20 2021 and shows a quick view of how large traders (for-profit speculators and commercial entities) were positioned in the futures markets.
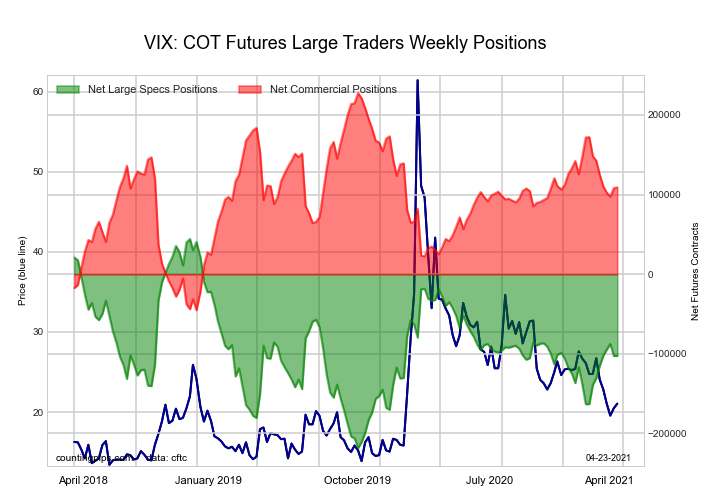
The VIX Volatility Futures large speculator standing this week recorded a net position of -102,507 contracts in the data reported through Tuesday. This was a weekly boost of 140 contracts from the previous week which had a total of -102,647 net contracts.
This week’s current strength score (the trader positioning range over the past three years, measured from 0 to 100) shows the speculators are currently Bearish with a score of 44.1 percent. The commercials are Bullish with a score of 56.6 percent and the small traders (not shown in chart) are Bearish with a score of 31.3 percent.
| VIX Volatility Futures Statistics | SPECULATORS | COMMERCIALS | SMALL TRADERS |
| – Percent of Open Interest Longs: | 15.2 | 58.0 | 5.4 |
| – Percent of Open Interest Shorts: | 41.9 | 29.6 | 7.1 |
| – Net Position: | -102,507 | 109,109 | -6,602 |
| – Gross Longs: | 58,418 | 222,809 | 20,616 |
| – Gross Shorts: | 160,925 | 113,700 | 27,218 |
| – Long to Short Ratio: | 0.4 to 1 | 2.0 to 1 | 0.8 to 1 |
| NET POSITION TREND: | |||
| – COT Index Score (3 Year Range Pct): | 44.1 | 56.6 | 31.3 |
| – COT Index Reading (3 Year Range): | Bearish | Bullish | Bearish |
| NET POSITION MOVEMENT INDEX: | |||
| – 6-Week Change in Strength Index: | 10.6 | -12.2 | 20.2 |
Free Reports:
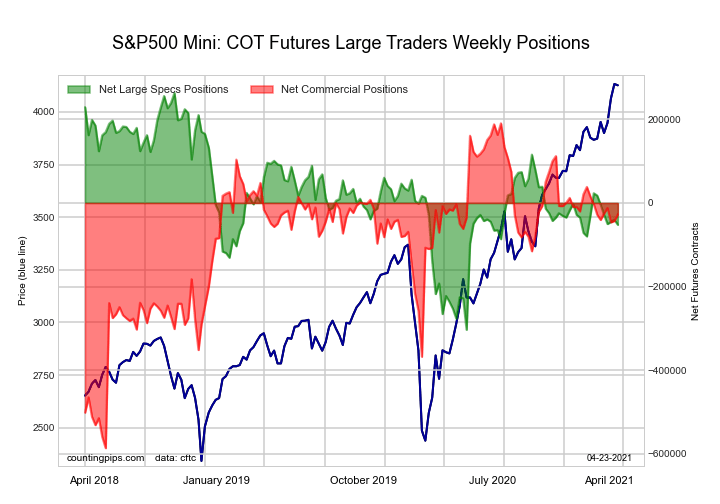
The S&P500 Mini Futures large speculator standing this week recorded a net position of -52,161 contracts in the data reported through Tuesday. This was a weekly fall of -12,065 contracts from the previous week which had a total of -40,096 net contracts.
This week’s current strength score (the trader positioning range over the past three years, measured from 0 to 100) shows the speculators are currently Bearish with a score of 44.3 percent. The commercials are Bullish with a score of 72.0 percent and the small traders (not shown in chart) are Bearish with a score of 37.8 percent.
| S&P500 Mini Futures Statistics | SPECULATORS | COMMERCIALS | SMALL TRADERS |
| – Percent of Open Interest Longs: | 13.6 | 72.5 | 11.8 |
| – Percent of Open Interest Shorts: | 15.5 | 73.5 | 8.8 |
| – Net Position: | -52,161 | -27,471 | 79,632 |
| – Gross Longs: | 364,997 | 1,947,557 | 316,802 |
| – Gross Shorts: | 417,158 | 1,975,028 | 237,170 |
| – Long to Short Ratio: | 0.9 to 1 | 1.0 to 1 | 1.3 to 1 |
| NET POSITION TREND: | |||
| – COT Index Score (3 Year Range Pct): | 44.3 | 72.0 | 37.8 |
| – COT Index Reading (3 Year Range): | Bearish | Bullish | Bearish |
| NET POSITION MOVEMENT INDEX: | |||
| – 6-Week Change in Strength Index: | -12.4 | 0.1 | 12.8 |
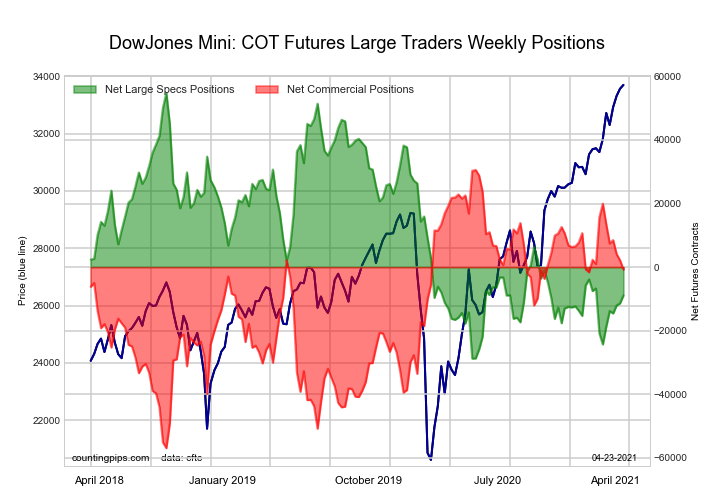
The Dow Jones Mini Futures large speculator standing this week recorded a net position of -8,887 contracts in the data reported through Tuesday. This was a weekly advance of 2,500 contracts from the previous week which had a total of -11,387 net contracts.
This week’s current strength score (the trader positioning range over the past three years, measured from 0 to 100) shows the speculators are currently Bearish with a score of 23.8 percent. The commercials are Bullish with a score of 64.2 percent and the small traders (not shown in chart) are Bullish-Extreme with a score of 100.0 percent.
| Dow Jones Mini Futures Statistics | SPECULATORS | COMMERCIALS | SMALL TRADERS |
| – Percent of Open Interest Longs: | 27.5 | 45.9 | 23.4 |
| – Percent of Open Interest Shorts: | 37.2 | 46.7 | 12.8 |
| – Net Position: | -8,887 | -741 | 9,628 |
| – Gross Longs: | 25,076 | 41,883 | 21,314 |
| – Gross Shorts: | 33,963 | 42,624 | 11,686 |
| – Long to Short Ratio: | 0.7 to 1 | 1.0 to 1 | 1.8 to 1 |
| NET POSITION TREND: | |||
| – COT Index Score (3 Year Range Pct): | 23.8 | 64.2 | 100.0 |
| – COT Index Reading (3 Year Range): | Bearish | Bullish | Bullish-Extreme |
| NET POSITION MOVEMENT INDEX: | |||
| – 6-Week Change in Strength Index: | 18.5 | -23.6 | 31.4 |
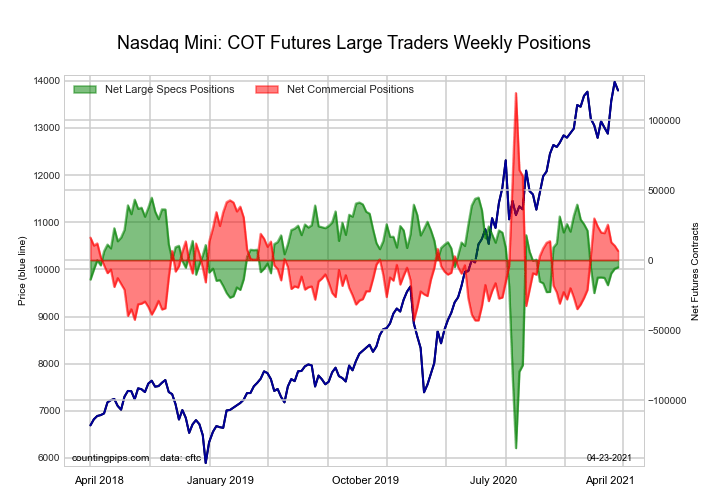
The Nasdaq Mini Futures large speculator standing this week recorded a net position of -5,125 contracts in the data reported through Tuesday. This was a weekly rise of 986 contracts from the previous week which had a total of -6,111 net contracts.
This week’s current strength score (the trader positioning range over the past three years, measured from 0 to 100) shows the speculators are currently Bullish with a score of 72.2 percent. The commercials are Bearish with a score of 30.6 percent and the small traders (not shown in chart) are Bearish with a score of 40.6 percent.
| Nasdaq Mini Futures Statistics | SPECULATORS | COMMERCIALS | SMALL TRADERS |
| – Percent of Open Interest Longs: | 25.3 | 55.2 | 17.1 |
| – Percent of Open Interest Shorts: | 27.7 | 52.2 | 17.8 |
| – Net Position: | -5,125 | 6,632 | -1,507 |
| – Gross Longs: | 55,287 | 120,484 | 37,377 |
| – Gross Shorts: | 60,412 | 113,852 | 38,884 |
| – Long to Short Ratio: | 0.9 to 1 | 1.1 to 1 | 1.0 to 1 |
| NET POSITION TREND: | |||
| – COT Index Score (3 Year Range Pct): | 72.2 | 30.6 | 40.6 |
| – COT Index Reading (3 Year Range): | Bullish | Bearish | Bearish |
| NET POSITION MOVEMENT INDEX: | |||
| – 6-Week Change in Strength Index: | 4.1 | -10.8 | 22.8 |
The Russell 2000 Mini Futures large speculator standing this week recorded a net position of -25,193 contracts in the data reported through Tuesday. This was a weekly reduction of -3,732 contracts from the previous week which had a total of -21,461 net contracts.
This week’s current strength score (the trader positioning range over the past three years, measured from 0 to 100) shows the speculators are currently Bearish with a score of 39.4 percent. The commercials are Bullish with a score of 58.0 percent and the small traders (not shown in chart) are Bullish with a score of 60.7 percent.
| Russell 2000 Mini Futures Statistics | SPECULATORS | COMMERCIALS | SMALL TRADERS |
| – Percent of Open Interest Longs: | 11.9 | 81.1 | 6.6 |
| – Percent of Open Interest Shorts: | 17.4 | 77.8 | 4.4 |
| – Net Position: | -25,193 | 15,396 | 9,797 |
| – Gross Longs: | 54,939 | 373,345 | 30,166 |
| – Gross Shorts: | 80,132 | 357,949 | 20,369 |
| – Long to Short Ratio: | 0.7 to 1 | 1.0 to 1 | 1.5 to 1 |
| NET POSITION TREND: | |||
| – COT Index Score (3 Year Range Pct): | 39.4 | 58.0 | 60.7 |
| – COT Index Reading (3 Year Range): | Bearish | Bullish | Bullish |
| NET POSITION MOVEMENT INDEX: | |||
| – 6-Week Change in Strength Index: | -18.5 | 18.4 | -2.9 |
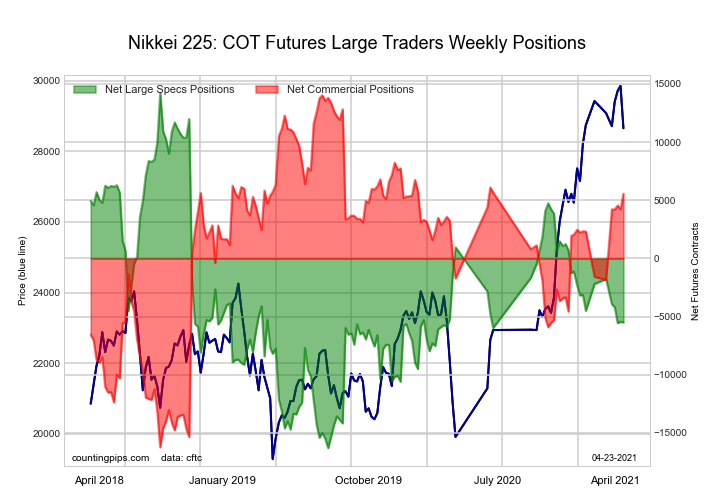
The Nikkei Stock Average (USD) Futures large speculator standing this week recorded a net position of -5,496 contracts in the data reported through Tuesday. This was a weekly lowering of -60 contracts from the previous week which had a total of -5,436 net contracts.
This week’s current strength score (the trader positioning range over the past three years, measured from 0 to 100) shows the speculators are currently Bearish with a score of 35.4 percent. The commercials are Bullish with a score of 72.0 percent and the small traders (not shown in chart) are Bearish-Extreme with a score of 17.7 percent.
| Nikkei Stock Average Futures Statistics | SPECULATORS | COMMERCIALS | SMALL TRADERS |
| – Percent of Open Interest Longs: | 14.2 | 61.0 | 24.8 |
| – Percent of Open Interest Shorts: | 50.2 | 24.6 | 25.2 |
| – Net Position: | -5,496 | 5,558 | -62 |
| – Gross Longs: | 2,171 | 9,318 | 3,784 |
| – Gross Shorts: | 7,667 | 3,760 | 3,846 |
| – Long to Short Ratio: | 0.3 to 1 | 2.5 to 1 | 1.0 to 1 |
| NET POSITION TREND: | |||
| – COT Index Score (3 Year Range Pct): | 35.4 | 72.0 | 17.7 |
| – COT Index Reading (3 Year Range): | Bearish | Bullish | Bearish-Extreme |
| NET POSITION MOVEMENT INDEX: | |||
| – 6-Week Change in Strength Index: | -10.8 | 23.6 | -45.3 |
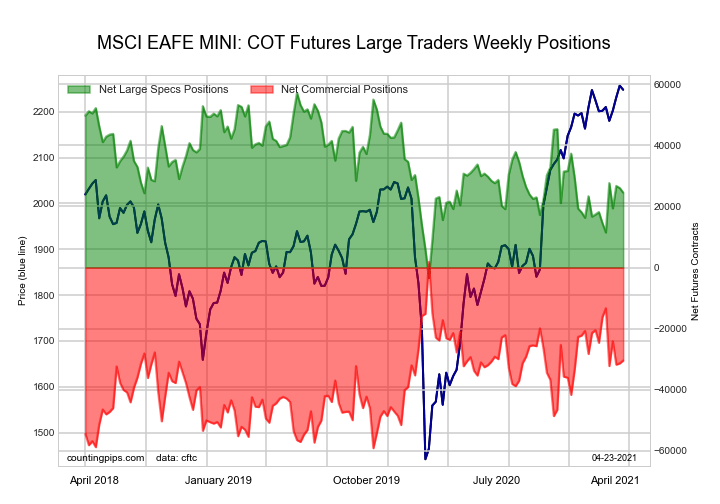
The MSCI EAFE Mini Futures large speculator standing this week recorded a net position of 24,542 contracts in the data reported through Tuesday. This was a weekly decline of -1,528 contracts from the previous week which had a total of 26,070 net contracts.
This week’s current strength score (the trader positioning range over the past three years, measured from 0 to 100) shows the speculators are currently Bearish with a score of 46.1 percent. The commercials are Bearish with a score of 47.0 percent and the small traders (not shown in chart) are Bullish with a score of 69.7 percent.
| MSCI EAFE Mini Futures Statistics | SPECULATORS | COMMERCIALS | SMALL TRADERS |
| – Percent of Open Interest Longs: | 8.6 | 88.4 | 2.7 |
| – Percent of Open Interest Shorts: | 2.6 | 96.0 | 1.2 |
| – Net Position: | 24,542 | -30,469 | 5,927 |
| – Gross Longs: | 34,913 | 357,064 | 10,738 |
| – Gross Shorts: | 10,371 | 387,533 | 4,811 |
| – Long to Short Ratio: | 3.4 to 1 | 0.9 to 1 | 2.2 to 1 |
| NET POSITION TREND: | |||
| – COT Index Score (3 Year Range Pct): | 46.1 | 47.0 | 69.7 |
| – COT Index Reading (3 Year Range): | Bearish | Bearish | Bullish |
| NET POSITION MOVEMENT INDEX: | |||
| – 6-Week Change in Strength Index: | 16.4 | -23.2 | 38.4 |
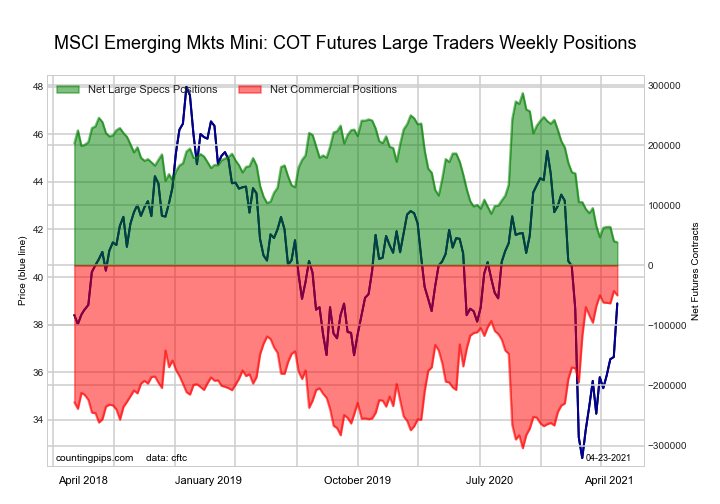
The MSCI Emerging Mkts Mini Futures large speculator standing this week recorded a net position of 38,211 contracts in the data reported through Tuesday. This was a weekly lowering of -2,219 contracts from the previous week which had a total of 40,430 net contracts.
This week’s current strength score (the trader positioning range over the past three years, measured from 0 to 100) shows the speculators are currently Bearish-Extreme with a score of 0.0 percent. The commercials are Bullish-Extreme with a score of 97.2 percent and the small traders (not shown in chart) are Bearish with a score of 40.4 percent.
| MSCI Emerging Mkts Mini Futures Statistics | SPECULATORS | COMMERCIALS | SMALL TRADERS |
| – Percent of Open Interest Longs: | 14.3 | 82.2 | 2.4 |
| – Percent of Open Interest Shorts: | 11.0 | 86.5 | 1.3 |
| – Net Position: | 38,211 | -49,886 | 11,675 |
| – Gross Longs: | 165,150 | 950,685 | 27,250 |
| – Gross Shorts: | 126,939 | 1,000,571 | 15,575 |
| – Long to Short Ratio: | 1.3 to 1 | 1.0 to 1 | 1.7 to 1 |
| NET POSITION TREND: | |||
| – COT Index Score (3 Year Range Pct): | 0.0 | 97.2 | 40.4 |
| – COT Index Reading (3 Year Range): | Bearish-Extreme | Bullish-Extreme | Bearish |
| NET POSITION MOVEMENT INDEX: | |||
| – 6-Week Change in Strength Index: | -11.0 | 6.8 | 7.3 |
Article By CountingPips.com – Receive our weekly COT Reports by Email
*COT Report: The COT data, released weekly to the public each Friday, is updated through the most recent Tuesday (data is 3 days old) and shows a quick view of how large speculators or non-commercials (for-profit traders) were positioned in the futures markets.
The CFTC categorizes trader positions according to commercial hedgers (traders who use futures contracts for hedging as part of the business), non-commercials (large traders who speculate to realize trading profits) and nonreportable traders (usually small traders/speculators).
Find CFTC criteria here: (http://www.cftc.gov/MarketReports/CommitmentsofTraders/ExplanatoryNotes/index.htm).
By Laura Russo, University of Tennessee A surprisingly large number and diversity of bee species…
By JustMarkets The US stock indices ended Tuesday with confident gains, fully driven by a…
By Analytical Department RoboForex Gold traded around 4,080 USD per ounce on Wednesday, having risen…
By JustMarkets The US stock indices started the week on a downbeat note. By the…
By Analytical Department RoboForex GBP/USD fell to 1.3437 on Tuesday as investors assessed the appointment…
By JustMarkets The US stock indices ended Friday’s session in the red. By the end…
This website uses cookies.