By CountingPips.com COT Home | Data Tables | Data Downloads | Newsletter
Here are the latest charts and statistics for the Commitment of Traders (COT) data published by the Commodities Futures Trading Commission (CFTC).
The latest COT data is updated through Tuesday April 13 2021 and shows a quick view of how large traders (for-profit speculators and commercial entities) were positioned in the futures markets.
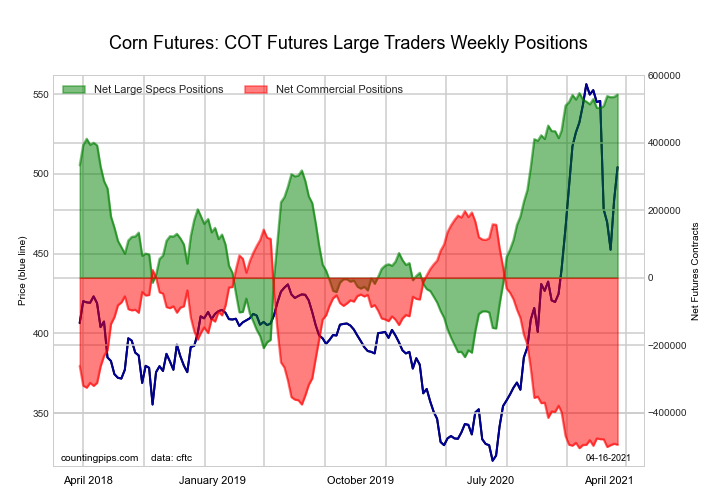
The CORN large speculator standing this week equaled a net position of 543,286 contracts in the data reported through Tuesday. This was a weekly lift of 7,134 contracts from the previous week which had a total of 536,152 net contracts.
This week’s current strength score (the trader positioning range over the past three years, measured from 0 to 100) shows the speculators are currently Bullish-Extreme with a score of 99.4 percent. The commercials are Bearish-Extreme with a score of 1.5 percent and the small traders (not shown in chart) are Bearish with a score of 20.4 percent.
| CORN Futures Statistics | SPECULATORS | COMMERCIALS | SMALL TRADERS |
| – Percent of Open Interest Longs: | 34.6 | 44.7 | 8.4 |
| – Percent of Open Interest Shorts: | 4.3 | 72.2 | 11.1 |
| – Net Position: | 543,286 | -494,687 | -48,599 |
| – Gross Longs: | 619,846 | 800,786 | 149,766 |
| – Gross Shorts: | 76,560 | 1,295,473 | 198,365 |
| – Long to Short Ratio: | 8.1 to 1 | 0.6 to 1 | 0.8 to 1 |
| NET POSITION TREND: | |||
| – COT Index Score (3 Year Range Pct): | 99.4 | 1.5 | 20.4 |
| – COT Index Reading (3 Year Range): | Bullish-Extreme | Bearish-Extreme | Bearish |
| NET POSITION MOVEMENT INDEX: | |||
| – 6-Week Change in Strength Index: | 5.0 | -2.6 | -11.3 |
Free Reports:
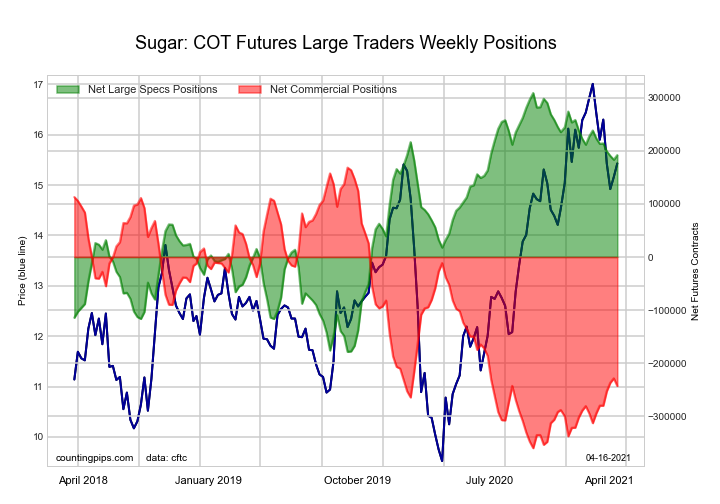
The SUGAR large speculator standing this week equaled a net position of 191,617 contracts in the data reported through Tuesday. This was a weekly lift of 8,612 contracts from the previous week which had a total of 183,005 net contracts.
This week’s current strength score (the trader positioning range over the past three years, measured from 0 to 100) shows the speculators are currently Bullish with a score of 76.0 percent. The commercials are Bearish with a score of 22.2 percent and the small traders (not shown in chart) are Bullish with a score of 70.9 percent.
| SUGAR Futures Statistics | SPECULATORS | COMMERCIALS | SMALL TRADERS |
| – Percent of Open Interest Longs: | 23.3 | 55.0 | 9.5 |
| – Percent of Open Interest Shorts: | 5.1 | 78.1 | 4.6 |
| – Net Position: | 191,617 | -242,593 | 50,976 |
| – Gross Longs: | 245,108 | 579,236 | 99,633 |
| – Gross Shorts: | 53,491 | 821,829 | 48,657 |
| – Long to Short Ratio: | 4.6 to 1 | 0.7 to 1 | 2.0 to 1 |
| NET POSITION TREND: | |||
| – COT Index Score (3 Year Range Pct): | 76.0 | 22.2 | 70.9 |
| – COT Index Reading (3 Year Range): | Bullish | Bearish | Bullish |
| NET POSITION MOVEMENT INDEX: | |||
| – 6-Week Change in Strength Index: | -6.5 | 9.8 | -25.0 |
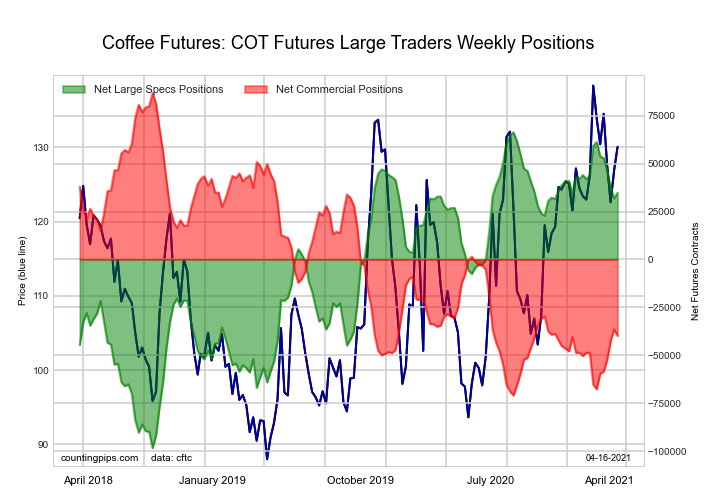
The COFFEE large speculator standing this week equaled a net position of 34,860 contracts in the data reported through Tuesday. This was a weekly gain of 2,956 contracts from the previous week which had a total of 31,904 net contracts.
This week’s current strength score (the trader positioning range over the past three years, measured from 0 to 100) shows the speculators are currently Bullish-Extreme with a score of 80.9 percent. The commercials are Bearish-Extreme with a score of 19.7 percent and the small traders (not shown in chart) are Bearish with a score of 23.3 percent.
| COFFEE Futures Statistics | SPECULATORS | COMMERCIALS | SMALL TRADERS |
| – Percent of Open Interest Longs: | 23.4 | 50.3 | 4.6 |
| – Percent of Open Interest Shorts: | 11.0 | 64.6 | 2.8 |
| – Net Position: | 34,860 | -39,910 | 5,050 |
| – Gross Longs: | 65,557 | 140,721 | 12,833 |
| – Gross Shorts: | 30,697 | 180,631 | 7,783 |
| – Long to Short Ratio: | 2.1 to 1 | 0.8 to 1 | 1.6 to 1 |
| NET POSITION TREND: | |||
| – COT Index Score (3 Year Range Pct): | 80.9 | 19.7 | 23.3 |
| – COT Index Reading (3 Year Range): | Bullish-Extreme | Bearish-Extreme | Bearish |
| NET POSITION MOVEMENT INDEX: | |||
| – 6-Week Change in Strength Index: | -16.0 | 17.6 | -9.7 |
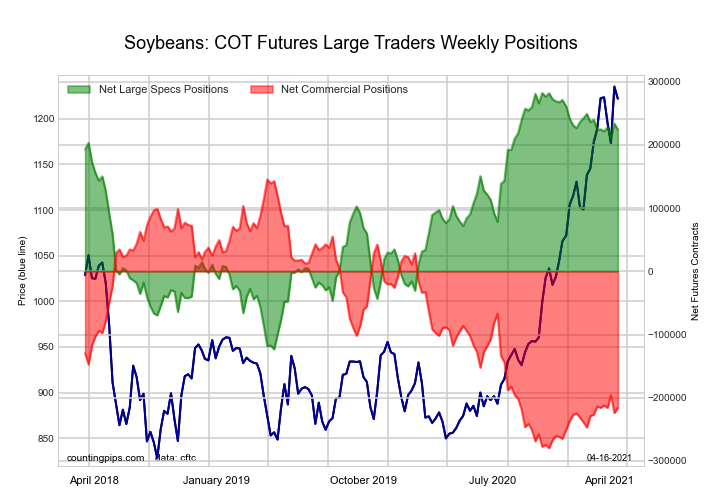
The SOYBEANS large speculator standing this week equaled a net position of 224,018 contracts in the data reported through Tuesday. This was a weekly decrease of -9,785 contracts from the previous week which had a total of 233,803 net contracts.
This week’s current strength score (the trader positioning range over the past three years, measured from 0 to 100) shows the speculators are currently Bullish-Extreme with a score of 85.7 percent. The commercials are Bearish-Extreme with a score of 15.0 percent and the small traders (not shown in chart) are Bullish with a score of 68.9 percent.
| SOYBEANS Futures Statistics | SPECULATORS | COMMERCIALS | SMALL TRADERS |
| – Percent of Open Interest Longs: | 30.5 | 45.0 | 7.9 |
| – Percent of Open Interest Shorts: | 5.2 | 69.4 | 8.8 |
| – Net Position: | 224,018 | -216,049 | -7,969 |
| – Gross Longs: | 270,077 | 398,385 | 70,008 |
| – Gross Shorts: | 46,059 | 614,434 | 77,977 |
| – Long to Short Ratio: | 5.9 to 1 | 0.6 to 1 | 0.9 to 1 |
| NET POSITION TREND: | |||
| – COT Index Score (3 Year Range Pct): | 85.7 | 15.0 | 68.9 |
| – COT Index Reading (3 Year Range): | Bullish-Extreme | Bearish-Extreme | Bullish |
| NET POSITION MOVEMENT INDEX: | |||
| – 6-Week Change in Strength Index: | 0.1 | -0.6 | 2.5 |
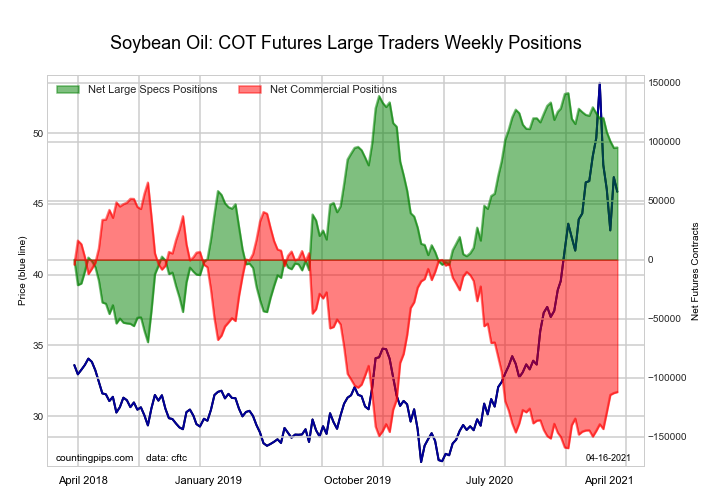
The SOYBEAN OIL large speculator standing this week equaled a net position of 95,103 contracts in the data reported through Tuesday. This was a weekly increase of 400 contracts from the previous week which had a total of 94,703 net contracts.
This week’s current strength score (the trader positioning range over the past three years, measured from 0 to 100) shows the speculators are currently Bullish with a score of 78.2 percent. The commercials are Bearish with a score of 21.1 percent and the small traders (not shown in chart) are Bullish with a score of 76.7 percent.
| SOYBEAN OIL Futures Statistics | SPECULATORS | COMMERCIALS | SMALL TRADERS |
| – Percent of Open Interest Longs: | 26.7 | 47.4 | 8.8 |
| – Percent of Open Interest Shorts: | 7.8 | 69.7 | 5.5 |
| – Net Position: | 95,103 | -112,069 | 16,966 |
| – Gross Longs: | 134,332 | 238,195 | 44,419 |
| – Gross Shorts: | 39,229 | 350,264 | 27,453 |
| – Long to Short Ratio: | 3.4 to 1 | 0.7 to 1 | 1.6 to 1 |
| NET POSITION TREND: | |||
| – COT Index Score (3 Year Range Pct): | 78.2 | 21.1 | 76.7 |
| – COT Index Reading (3 Year Range): | Bullish | Bearish | Bullish |
| NET POSITION MOVEMENT INDEX: | |||
| – 6-Week Change in Strength Index: | -13.7 | 14.6 | -14.7 |
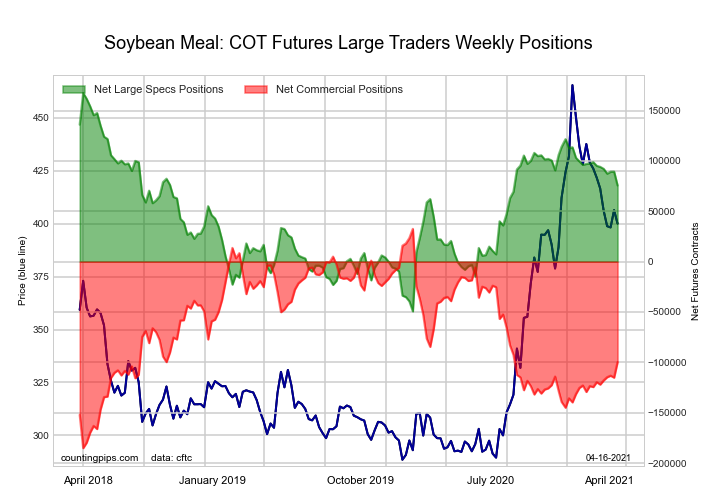
The SOYBEAN MEAL large speculator standing this week equaled a net position of 75,661 contracts in the data reported through Tuesday. This was a weekly lowering of -13,792 contracts from the previous week which had a total of 89,453 net contracts.
This week’s current strength score (the trader positioning range over the past three years, measured from 0 to 100) shows the speculators are currently Bullish with a score of 57.6 percent. The commercials are Bearish with a score of 39.3 percent and the small traders (not shown in chart) are Bullish with a score of 67.1 percent.
| SOYBEAN MEAL Futures Statistics | SPECULATORS | COMMERCIALS | SMALL TRADERS |
| – Percent of Open Interest Longs: | 24.0 | 48.7 | 12.7 |
| – Percent of Open Interest Shorts: | 5.8 | 72.7 | 6.9 |
| – Net Position: | 75,661 | -99,725 | 24,064 |
| – Gross Longs: | 99,727 | 202,391 | 52,772 |
| – Gross Shorts: | 24,066 | 302,116 | 28,708 |
| – Long to Short Ratio: | 4.1 to 1 | 0.7 to 1 | 1.8 to 1 |
| NET POSITION TREND: | |||
| – COT Index Score (3 Year Range Pct): | 57.6 | 39.3 | 67.1 |
| – COT Index Reading (3 Year Range): | Bullish | Bearish | Bullish |
| NET POSITION MOVEMENT INDEX: | |||
| – 6-Week Change in Strength Index: | -9.0 | 9.2 | -1.8 |
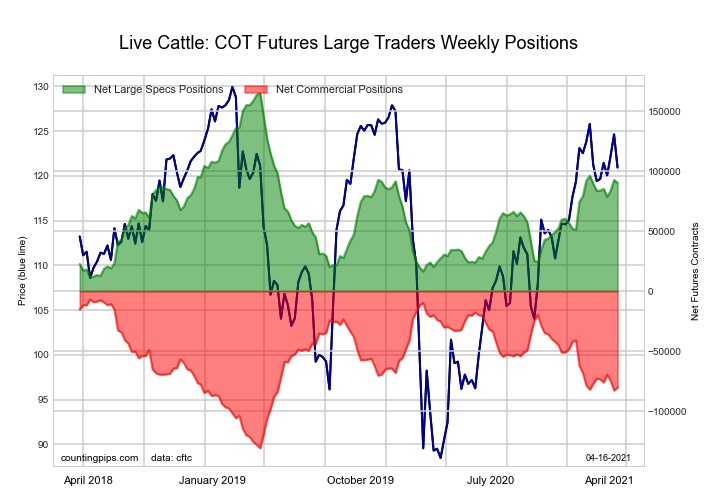
The LIVE CATTLE large speculator standing this week equaled a net position of 90,303 contracts in the data reported through Tuesday. This was a weekly decrease of -2,380 contracts from the previous week which had a total of 92,683 net contracts.
This week’s current strength score (the trader positioning range over the past three years, measured from 0 to 100) shows the speculators are currently Bullish with a score of 51.4 percent. The commercials are Bearish with a score of 40.7 percent and the small traders (not shown in chart) are Bullish with a score of 62.6 percent.
| LIVE CATTLE Futures Statistics | SPECULATORS | COMMERCIALS | SMALL TRADERS |
| – Percent of Open Interest Longs: | 39.6 | 35.1 | 9.0 |
| – Percent of Open Interest Shorts: | 12.9 | 58.8 | 12.0 |
| – Net Position: | 90,303 | -80,252 | -10,051 |
| – Gross Longs: | 133,829 | 118,684 | 30,503 |
| – Gross Shorts: | 43,526 | 198,936 | 40,554 |
| – Long to Short Ratio: | 3.1 to 1 | 0.6 to 1 | 0.8 to 1 |
| NET POSITION TREND: | |||
| – COT Index Score (3 Year Range Pct): | 51.4 | 40.7 | 62.6 |
| – COT Index Reading (3 Year Range): | Bullish | Bearish | Bullish |
| NET POSITION MOVEMENT INDEX: | |||
| – 6-Week Change in Strength Index: | 4.3 | -6.0 | 1.9 |
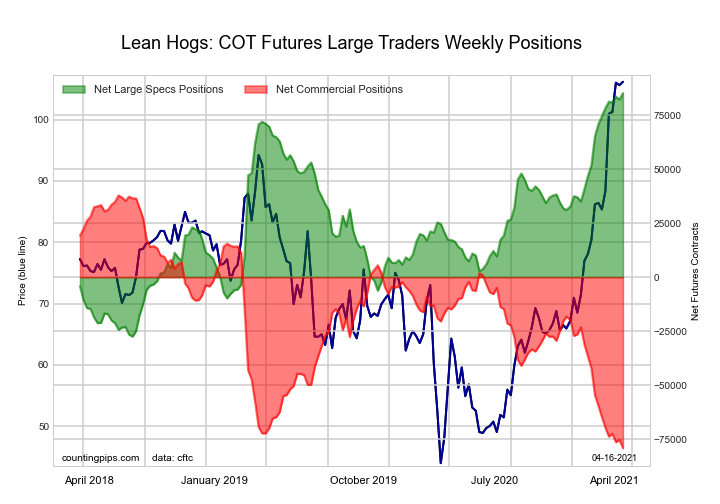
The LEAN HOGS large speculator standing this week equaled a net position of 85,207 contracts in the data reported through Tuesday. This was a weekly increase of 3,000 contracts from the previous week which had a total of 82,207 net contracts.
This week’s current strength score (the trader positioning range over the past three years, measured from 0 to 100) shows the speculators are currently Bullish-Extreme with a score of 100.0 percent. The commercials are Bearish-Extreme with a score of 0.0 percent and the small traders (not shown in chart) are Bearish with a score of 48.7 percent.
| LEAN HOGS Futures Statistics | SPECULATORS | COMMERCIALS | SMALL TRADERS |
| – Percent of Open Interest Longs: | 41.7 | 29.2 | 9.2 |
| – Percent of Open Interest Shorts: | 12.9 | 55.9 | 11.2 |
| – Net Position: | 85,207 | -79,096 | -6,111 |
| – Gross Longs: | 123,446 | 86,420 | 27,177 |
| – Gross Shorts: | 38,239 | 165,516 | 33,288 |
| – Long to Short Ratio: | 3.2 to 1 | 0.5 to 1 | 0.8 to 1 |
| NET POSITION TREND: | |||
| – COT Index Score (3 Year Range Pct): | 100.0 | 0.0 | 48.7 |
| – COT Index Reading (3 Year Range): | Bullish-Extreme | Bearish-Extreme | Bearish |
| NET POSITION MOVEMENT INDEX: | |||
| – 6-Week Change in Strength Index: | 9.4 | -12.3 | 17.6 |
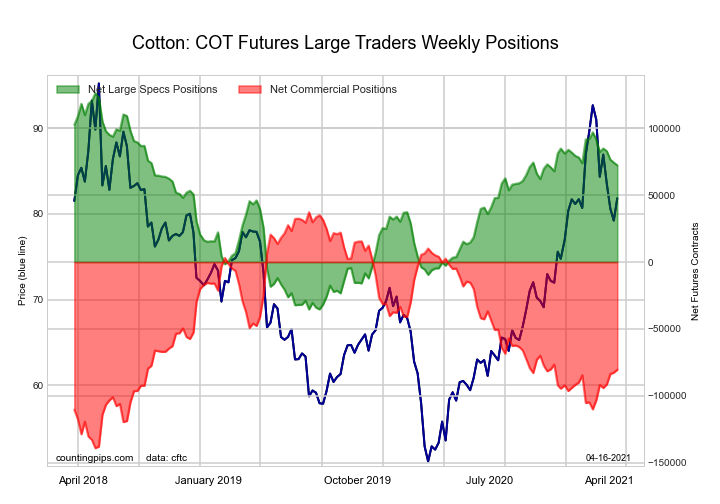
The COTTON large speculator standing this week equaled a net position of 72,380 contracts in the data reported through Tuesday. This was a weekly reduction of -2,008 contracts from the previous week which had a total of 74,388 net contracts.
This week’s current strength score (the trader positioning range over the past three years, measured from 0 to 100) shows the speculators are currently Bullish with a score of 66.6 percent. The commercials are Bearish with a score of 33.2 percent and the small traders (not shown in chart) are Bullish with a score of 59.8 percent.
| COTTON Futures Statistics | SPECULATORS | COMMERCIALS | SMALL TRADERS |
| – Percent of Open Interest Longs: | 37.5 | 42.2 | 7.2 |
| – Percent of Open Interest Shorts: | 4.9 | 78.3 | 3.5 |
| – Net Position: | 72,380 | -80,461 | 8,081 |
| – Gross Longs: | 83,368 | 93,873 | 15,973 |
| – Gross Shorts: | 10,988 | 174,334 | 7,892 |
| – Long to Short Ratio: | 7.6 to 1 | 0.5 to 1 | 2.0 to 1 |
| NET POSITION TREND: | |||
| – COT Index Score (3 Year Range Pct): | 66.6 | 33.2 | 59.8 |
| – COT Index Reading (3 Year Range): | Bullish | Bearish | Bullish |
| NET POSITION MOVEMENT INDEX: | |||
| – 6-Week Change in Strength Index: | -11.9 | 12.9 | -20.7 |
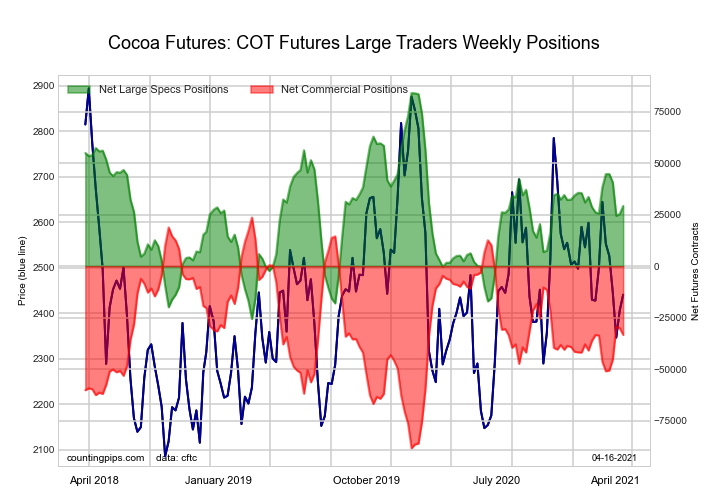
The COCOA large speculator standing this week equaled a net position of 29,252 contracts in the data reported through Tuesday. This was a weekly increase of 3,880 contracts from the previous week which had a total of 25,372 net contracts.
This week’s current strength score (the trader positioning range over the past three years, measured from 0 to 100) shows the speculators are currently Bullish with a score of 50.0 percent. The commercials are Bearish with a score of 49.2 percent and the small traders (not shown in chart) are Bullish with a score of 54.3 percent.
| COCOA Futures Statistics | SPECULATORS | COMMERCIALS | SMALL TRADERS |
| – Percent of Open Interest Longs: | 30.3 | 41.5 | 6.0 |
| – Percent of Open Interest Shorts: | 15.3 | 58.5 | 4.0 |
| – Net Position: | 29,252 | -33,279 | 4,027 |
| – Gross Longs: | 59,099 | 80,899 | 11,783 |
| – Gross Shorts: | 29,847 | 114,178 | 7,756 |
| – Long to Short Ratio: | 2.0 to 1 | 0.7 to 1 | 1.5 to 1 |
| NET POSITION TREND: | |||
| – COT Index Score (3 Year Range Pct): | 50.0 | 49.2 | 54.3 |
| – COT Index Reading (3 Year Range): | Bullish | Bearish | Bullish |
| NET POSITION MOVEMENT INDEX: | |||
| – 6-Week Change in Strength Index: | -8.3 | 11.7 | -45.7 |
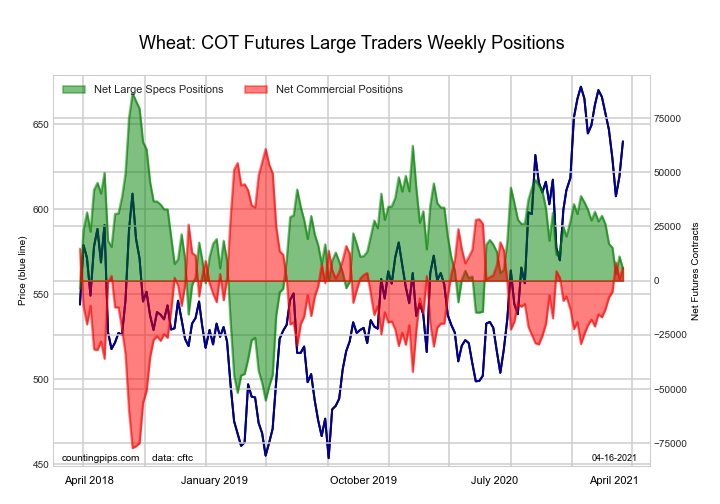
The WHEAT large speculator standing this week equaled a net position of 5,516 contracts in the data reported through Tuesday. This was a weekly fall of -5,688 contracts from the previous week which had a total of 11,204 net contracts.
This week’s current strength score (the trader positioning range over the past three years, measured from 0 to 100) shows the speculators are currently Bearish with a score of 42.8 percent. The commercials are Bullish with a score of 60.3 percent and the small traders (not shown in chart) are Bearish with a score of 46.5 percent.
| WHEAT Futures Statistics | SPECULATORS | COMMERCIALS | SMALL TRADERS |
| – Percent of Open Interest Longs: | 27.8 | 38.1 | 7.2 |
| – Percent of Open Interest Shorts: | 26.5 | 36.7 | 9.8 |
| – Net Position: | 5,516 | 6,007 | -11,523 |
| – Gross Longs: | 121,146 | 166,236 | 31,300 |
| – Gross Shorts: | 115,630 | 160,229 | 42,823 |
| – Long to Short Ratio: | 1.0 to 1 | 1.0 to 1 | 0.7 to 1 |
| NET POSITION TREND: | |||
| – COT Index Score (3 Year Range Pct): | 42.8 | 60.3 | 46.5 |
| – COT Index Reading (3 Year Range): | Bearish | Bullish | Bearish |
| NET POSITION MOVEMENT INDEX: | |||
| – 6-Week Change in Strength Index: | -17.2 | 16.5 | 7.6 |
Article By CountingPips.com – Receive our weekly COT Reports by Email
*COT Report: The COT data, released weekly to the public each Friday, is updated through the most recent Tuesday (data is 3 days old) and shows a quick view of how large speculators or non-commercials (for-profit traders) were positioned in the futures markets.
The CFTC categorizes trader positions according to commercial hedgers (traders who use futures contracts for hedging as part of the business), non-commercials (large traders who speculate to realize trading profits) and nonreportable traders (usually small traders/speculators).
Find CFTC criteria here: (http://www.cftc.gov/MarketReports/CommitmentsofTraders/ExplanatoryNotes/index.htm).
By Jeffrey Young, Georgia Institute of Technology You’ve probably heard artificial intelligence models described as…
Source: Barry Dawes (7/23/26) Barry Dawes of Martin Place Securities shares his analysis of the…
By JustMarkets The US stock indices ended Thursday’s session with a notable decline amid a…
By Analytical Department RoboForex USD/JPY soared to 163.81 on Friday, marking a new 40-year high.…
By JustMarkets The US equities ended Wednesday’s session lower amid investor caution ahead of the…
By Analytical Department RoboForex EUR/USD rose to 1.1429 on Thursday, with the US dollar continuing…
This website uses cookies.