By CountingPips.com – Receive our weekly COT Reports by Email
Here are the latest charts and statistics for the Commitment of Traders (COT) data published by the Commodities Futures Trading Commission (CFTC).
The latest COT data is updated through Tuesday April 06 2021 and shows a quick view of how large traders (for-profit speculators and commercial entities) were positioned in the futures markets.
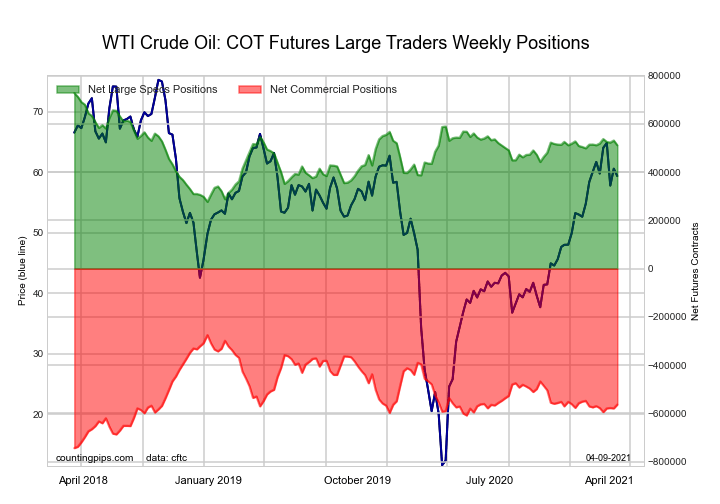
The WTI Crude Oil Futures: large speculator standing this week was a net position of 511,725 contracts in the data reported through Tuesday. This was a weekly reduction of -19,585 contracts from the previous week which had a total of 531,310 net contracts.
This week’s current strength score (the trader positioning range over the past three years, measured from 0 to 100) shows the speculators are currently Bullish with a score of 52.0 percent. The commercials are Bearish with a score of 38.5 percent and the small traders (not shown in chart) are Bullish-Extreme with a score of 88.2 percent.
| WTI Crude Oil Futures Statistics | SPECULATORS | COMMERCIALS | SMALL TRADERS |
| – Percent of Open Interest Longs: | 27.7 | 33.5 | 4.4 |
| – Percent of Open Interest Shorts: | 5.9 | 57.6 | 2.2 |
| – Net Position: | 511,725 | -563,474 | 51,749 |
| – Gross Longs: | 649,237 | 784,153 | 102,770 |
| – Gross Shorts: | 137,512 | 1,347,627 | 51,021 |
| – Long to Short Ratio: | 4.7 to 1 | 0.6 to 1 | 2.0 to 1 |
| NET POSITION TREND: | |||
| – COT Index Score (3 Year Range Pct): | 52.0 | 38.5 | 88.2 |
| – COT Index Reading (3 Year Range): | Bullish | Bearish | Bullish-Extreme |
| NET POSITION MOVEMENT INDEX: | |||
| – 6-Week Change in Strength Index: | -0.0 | 1.4 | -8.8 |
Free Reports:
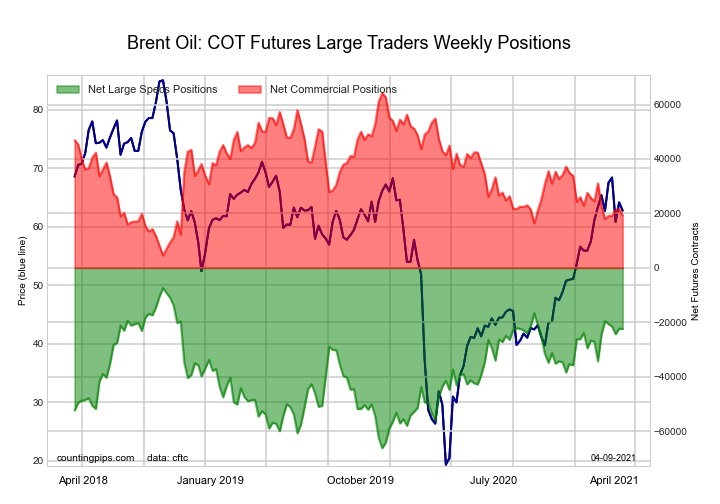
The Brent Crude Oil Futures (LAST DAY): large speculator standing this week was a net position of -22,410 contracts in the data reported through Tuesday. This was a weekly lowering of -89 contracts from the previous week which had a total of -22,321 net contracts.
This week’s current strength score (the trader positioning range over the past three years, measured from 0 to 100) shows the speculators are currently Bullish with a score of 74.5 percent. The commercials are Bearish with a score of 24.8 percent and the small traders (not shown in chart) are Bearish with a score of 43.5 percent.
| Brent Crude Oil Futures Statistics | SPECULATORS | COMMERCIALS | SMALL TRADERS |
| – Percent of Open Interest Longs: | 18.0 | 42.1 | 3.4 |
| – Percent of Open Interest Shorts: | 28.3 | 33.2 | 2.0 |
| – Net Position: | -22,410 | 19,323 | 3,087 |
| – Gross Longs: | 39,224 | 91,563 | 7,482 |
| – Gross Shorts: | 61,634 | 72,240 | 4,395 |
| – Long to Short Ratio: | 0.6 to 1 | 1.3 to 1 | 1.7 to 1 |
| NET POSITION TREND: | |||
| – COT Index Score (3 Year Range Pct): | 74.5 | 24.8 | 43.5 |
| – COT Index Reading (3 Year Range): | Bullish | Bearish | Bearish |
| NET POSITION MOVEMENT INDEX: | |||
| – 6-Week Change in Strength Index: | 3.5 | -5.4 | 7.1 |
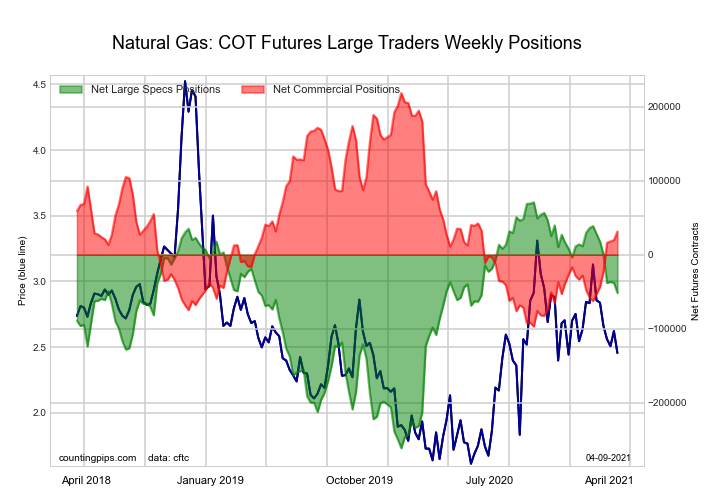
The Natural Gas Futures (CME): large speculator standing this week was a net position of -51,583 contracts in the data reported through Tuesday. This was a weekly lowering of -13,699 contracts from the previous week which had a total of -37,884 net contracts.
This week’s current strength score (the trader positioning range over the past three years, measured from 0 to 100) shows the speculators are currently Bullish with a score of 63.1 percent. The commercials are Bearish with a score of 40.7 percent and the small traders (not shown in chart) are Bearish-Extreme with a score of 11.7 percent.
| Natural Gas Futures Statistics | SPECULATORS | COMMERCIALS | SMALL TRADERS |
| – Percent of Open Interest Longs: | 20.3 | 43.9 | 4.5 |
| – Percent of Open Interest Shorts: | 24.5 | 41.3 | 2.9 |
| – Net Position: | -51,583 | 31,499 | 20,084 |
| – Gross Longs: | 247,254 | 535,668 | 55,021 |
| – Gross Shorts: | 298,837 | 504,169 | 34,937 |
| – Long to Short Ratio: | 0.8 to 1 | 1.1 to 1 | 1.6 to 1 |
| NET POSITION TREND: | |||
| – COT Index Score (3 Year Range Pct): | 63.1 | 40.7 | 11.7 |
| – COT Index Reading (3 Year Range): | Bullish | Bearish | Bearish-Extreme |
| NET POSITION MOVEMENT INDEX: | |||
| – 6-Week Change in Strength Index: | -24.0 | 26.8 | -15.9 |
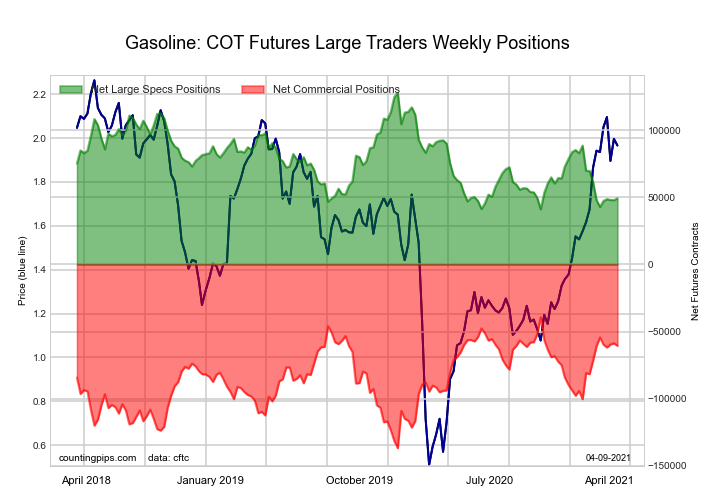
The Gasoline Blendstock Futures: large speculator standing this week was a net position of 49,320 contracts in the data reported through Tuesday. This was a weekly boost of 1,391 contracts from the previous week which had a total of 47,929 net contracts.
This week’s current strength score (the trader positioning range over the past three years, measured from 0 to 100) shows the speculators are currently Bearish-Extreme with a score of 9.4 percent. The commercials are Bullish with a score of 78.1 percent and the small traders (not shown in chart) are Bullish with a score of 78.8 percent.
| Nasdaq Mini Futures Statistics | SPECULATORS | COMMERCIALS | SMALL TRADERS |
| – Percent of Open Interest Longs: | 27.1 | 48.3 | 6.5 |
| – Percent of Open Interest Shorts: | 13.7 | 64.7 | 3.5 |
| – Net Position: | 49,320 | -60,575 | 11,255 |
| – Gross Longs: | 99,723 | 177,450 | 24,075 |
| – Gross Shorts: | 50,403 | 238,025 | 12,820 |
| – Long to Short Ratio: | 2.0 to 1 | 0.7 to 1 | 1.9 to 1 |
| NET POSITION TREND: | |||
| – COT Index Score (3 Year Range Pct): | 9.4 | 78.1 | 78.8 |
| – COT Index Reading (3 Year Range): | Bearish-Extreme | Bullish | Bullish |
| NET POSITION MOVEMENT INDEX: | |||
| – 6-Week Change in Strength Index: | 1.6 | 0.2 | -9.8 |
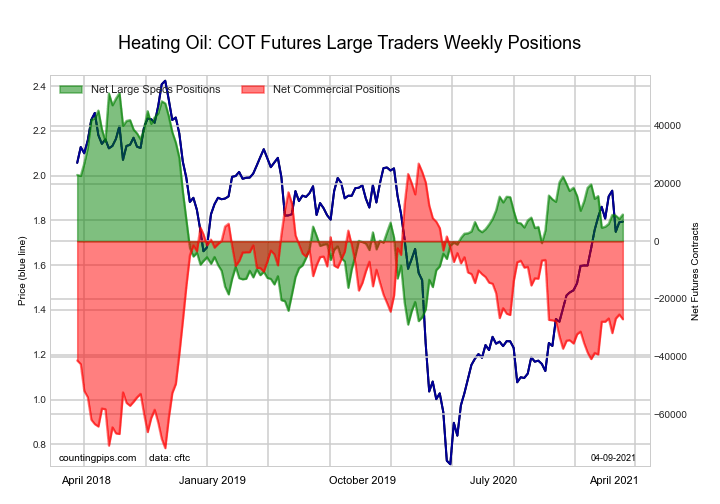
The #2 Heating Oil NY-Harbor Futures: large speculator standing this week was a net position of 9,292 contracts in the data reported through Tuesday. This was a weekly increase of 1,533 contracts from the previous week which had a total of 7,759 net contracts.
This week’s current strength score (the trader positioning range over the past three years, measured from 0 to 100) shows the speculators are currently Bearish with a score of 47.5 percent. The commercials are Bearish with a score of 45.3 percent and the small traders (not shown in chart) are Bullish with a score of 70.7 percent.
| Heating Oil Futures Statistics | SPECULATORS | COMMERCIALS | SMALL TRADERS |
| – Percent of Open Interest Longs: | 15.3 | 50.1 | 10.6 |
| – Percent of Open Interest Shorts: | 13.0 | 56.7 | 6.2 |
| – Net Position: | 9,292 | -27,007 | 17,715 |
| – Gross Longs: | 62,333 | 204,070 | 43,111 |
| – Gross Shorts: | 53,041 | 231,077 | 25,396 |
| – Long to Short Ratio: | 1.2 to 1 | 0.9 to 1 | 1.7 to 1 |
| NET POSITION TREND: | |||
| – COT Index Score (3 Year Range Pct): | 47.5 | 45.3 | 70.7 |
| – COT Index Reading (3 Year Range): | Bearish | Bearish | Bullish |
| NET POSITION MOVEMENT INDEX: | |||
| – 6-Week Change in Strength Index: | 5.7 | 0.9 | -22.2 |
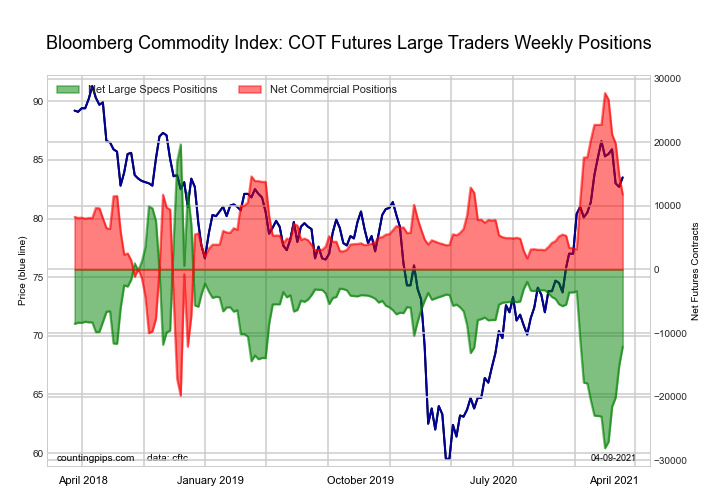
The Bloomberg Commodity Index Futures: large speculator standing this week was a net position of -12,147 contracts in the data reported through Tuesday. This was a weekly lift of 3,051 contracts from the previous week which had a total of -15,198 net contracts.
This week’s current strength score (the trader positioning range over the past three years, measured from 0 to 100) shows the speculators are currently Bearish with a score of 33.4 percent. The commercials are Bullish with a score of 66.4 percent and the small traders (not shown in chart) are Bullish with a score of 70.8 percent.
| Bloomberg Index Futures Statistics | SPECULATORS | COMMERCIALS | SMALL TRADERS |
| – Percent of Open Interest Longs: | 51.2 | 47.0 | 1.3 |
| – Percent of Open Interest Shorts: | 86.8 | 12.5 | 0.2 |
| – Net Position: | -12,147 | 11,758 | 389 |
| – Gross Longs: | 17,457 | 16,018 | 448 |
| – Gross Shorts: | 29,604 | 4,260 | 59 |
| – Long to Short Ratio: | 0.6 to 1 | 3.8 to 1 | 7.6 to 1 |
| NET POSITION TREND: | |||
| – COT Index Score (3 Year Range Pct): | 33.4 | 66.4 | 70.8 |
| – COT Index Reading (3 Year Range): | Bearish | Bullish | Bullish |
| NET POSITION MOVEMENT INDEX: | |||
| – 6-Week Change in Strength Index: | 23.0 | -23.1 | 2.6 |
Article By CountingPips.com – Receive our weekly COT Reports by Email
*COT Report: The COT data, released weekly to the public each Friday, is updated through the most recent Tuesday (data is 3 days old) and shows a quick view of how large speculators or non-commercials (for-profit traders) were positioned in the futures markets.
The CFTC categorizes trader positions according to commercial hedgers (traders who use futures contracts for hedging as part of the business), non-commercials (large traders who speculate to realize trading profits) and nonreportable traders (usually small traders/speculators).
Find CFTC criteria here: (http://www.cftc.gov/MarketReports/CommitmentsofTraders/ExplanatoryNotes/index.htm).
By Jeffrey Young, Georgia Institute of Technology You’ve probably heard artificial intelligence models described as…
Source: Barry Dawes (7/23/26) Barry Dawes of Martin Place Securities shares his analysis of the…
By JustMarkets The US stock indices ended Thursday’s session with a notable decline amid a…
By Analytical Department RoboForex USD/JPY soared to 163.81 on Friday, marking a new 40-year high.…
By JustMarkets The US equities ended Wednesday’s session lower amid investor caution ahead of the…
By Analytical Department RoboForex EUR/USD rose to 1.1429 on Thursday, with the US dollar continuing…
This website uses cookies.