Financial services: how London can take advantage of Brexit to become more successful

By David McMillan, University of Stirling 

– In the weeks since the Brexit free-trade deal was announced on December 24, people in the UK have been coming to terms with the fact that “free” does not mean completely free. But while much of the focus has been on the Northern Irish border and the row over vaccines, the financial services sector, centred around the City of London, is also going through substantial upheaval.

The sector contributed £132 billion or 7% of the UK economy in 2019 and employs over 1 million people, half of them in banking. It came out of the talks with what is essentially a “no deal”, since services were not covered at all.

During the announcement, the UK prime minister, Boris Johnson, said that the deal “perhaps does not go as far as we would like” for financial services. This was primarily a reference to “equivalence”, which is the way that EU regulators grant market access to firms from a country outside the bloc, on the basis of deciding that the financial rules are similar to their own (and will remain so).

There was no such commitment to equivalence in the deal – only a memorandum of understanding that talks would stay open and there would be an agreement on financial services regulation by March 31 that would hopefully include equivalence. The City of London has been calling on Brussels to grant equivalence in these negotiations, but there is not much optimism that it will happen either in that timeframe or in any comprehensive way.

One major consequence is that UK financial institutions must trade euro-denominated shares and bonds from within the euro-bloc. Some temporary measures are in place to keep trades moving, such as the UK’s Financial Conduct Authority allowing UK companies to trade EU derivatives until June, but this business will also probably be lost after that.

Shot of City of London from a distance
Jobs are going, but there are no signs of an exodus.
Lauris Rozentals, CC BY

One estimate from October 2020 suggested that even back then, £1.2 trillion in assets and 7,500 jobs had been moved in anticipation of what was to come. On the first day that trading shifted back to continental bourses on January 1, the volume amounted to nearly €6 billion (£5.3 billion).

There are still no signs of a mass exodus, however. For example, Deutsche Bank initially suggested that it may move up to 4,000 jobs to Frankfurt, but now that number looks more likely to be in the low hundreds. This could reflect a “wait-and-see” approach from financial institutions, or perhaps the benefits of being part of a cluster with a large support network of lawyers, accountants, risk specialists and so on, whose practices have evolved over decades to become world class.

Nonetheless, jobs relocated due to lack of equivalence are unlikely to come back if it is granted for particular market segments later, because routines and practices become settled. This could combine with the prospect of the “all-in-one-place” benefits of locating in London being diminished by the pandemic – if Zoom meetings are increasingly the norm, is being part of a cluster of connected businesses in one area still as important?

Professional strengths

But it’s not all bad news. One major City segment unaffected by Brexit is currency trading. While shares and bonds usually trade in the market where they are issued, currency trading takes place globally – mostly involving US dollar pairs, followed by pairs involving the euro and yen.

The UK has 43% of the global forex market, and this has increased by six percentage points in three years. The next highest is the US, with 16.5% and declining, while the Asian centres of Japan, Hong Kong and Singapore have predominantly been static.

In forex, London has several important advantages. The location and timezone are a midpoint between the US and Asia. It has scale in having such a significant number of international banks in one city, plus the network of supporting services. By comparison, EU expertise is scattered among centres such as Amsterdam, Frankfurt and Dublin. London also has the infrastructure required for state-of-the-art high-frequency trading, not least the transatlantic cabling landing stations and data centres.

Two professionals working behind laptops
London’s finance cluster remains hard to beat.
Scott Graham, CC BY-SA

So London will probably continue to dominate this market, and is well placed to benefit from a likely rise in the trade in emerging markets currencies. Their total trade now exceeds the yen, with the Chinese remnimbi the largest. Outside Hong Kong, more remnimbi are traded in London than anywhere else – more than £300 billion worth in 2019. London has also seen an increase in the issuance of remnimbi-denominated bonds issued outside of China (known as “dim sum bonds”).

In important areas like these, London will be competing much more with Asia than with Europe. London is also likely to continue to be a world leader in providing a place where disputes can be resolved and best practices can be monitored and maintained.

The right approach to the future

The pre-eminence in finance that London enjoys because of its cluster of specialists points to a vital issue as the UK emerges from Brexit: the key to the future is to maintain and enhance standards and regulatory oversight so that major firms continue to have confidence in London as a place to do business, resolve disputes and so on. Get this right and they will continue to invest.

No longer having to coordinate and agree with 27 EU countries should enable the UK to be more nimble in this regard, which could be a big advantage in attempting to corner emerging areas such as green investment and fintech. This could include developing and regulating new financial products that allow investors to positively engage with climate-change finance and cryptocurrencies. This would be a more beneficial approach to taking the financial sector forward than to focus on deregulation in a “big bang 2.0”.

The unavoidable reality is that financial services business and jobs will continue to be lost as a result of Brexit. But with a thoughtful, future-focused approach to managing the sector, there is also plenty of scope for it to rebound.The Conversation

About the Author:

David McMillan, Professor in Finance, University of Stirling

This article is republished from The Conversation under a Creative Commons license. Read the original article.


What To Keep In Mind Ahead Of US Jan Inflation Data

By Orbex

With demand still under pressure in the middle of a pandemic, it might seem odd to talk about inflation. Especially with jobs growth stagnating, as we saw with last Friday’s NFP report. But this is the scenario that an increasing number of analysts are considering. The price of bonds is reflecting that.

At the start of the week, the yield curve is at the steepest it’s been in years. The 30-year bond is closing in on a two-year high of 2.0%. This means that investors are banking on an increase in inflation soon, and also the Fed being forced to raise rates.

Why the uptick?

On Friday we saw both houses of Congress vote to push forward without Republican support on the $1.9T stimulus bill proposed by the Biden administration. We have to remember that so far the Fed and the Federal Government have already provided $9.7T in different forms of stimulus relief.

With the addition of the latest proposed round of stimulus, that would equate to over 54% of GDP – and not counting what state and local governments have done.

It’s understandable that there wouldn’t be an immediate uptick in inflation. Especially with the uncertainty of employment and business closures during the pandemic. Savings rates among Americans remain at record highs.

However, when restrictions are lifted, and the economy starts to normalize probably in the second half of the year, we could see a significant increase in demand. There is a consensus projecting around 7% annualized growth for the last two quarters of the year.

It’s not an unexpected pattern

In countries that have lifted lockdowns already, we’ve seen an uptick in consumer prices. As stores reopen, often there is a logistics backlog to meet the increased demand. Those increases in inflation have been transitory as supply lines balance.

On the other hand, those countries have not done stimulus spending for consumers on such a massive scale as the US has.

But, these factors that could lead to higher inflation are not set to take off just yet. The US is still the second in the race among large countries to get their population inoculated against covid.

However, so far, only 11.7% of the population has received at least one dose. This would put America on track to reaching herd immunity threshold sometime towards the end of the second quarter.

This would be on track with Treasury Secretary Yellen’s prediction that if the stimulus bill is passed, the US would reach full employment by the end of the year.

What we are looking for

Meanwhile, last month saw the height of the second round of lockdowns. This suggests muted inflationary pressures. With the Fed willing to let inflation overheat slightly, we could still have some room before CPI growth implies an increased chance of a change in monetary policy.

Core US Jan CPI is expected to come in at 0.2% month over month. Compared to December’s 0.1%, this is a marginal increase. On an annualized basis, this would be a repeat of the 1.6% seen last month.

By Orbex

Microsoft Holding Near Highs

By Orbex

Earnings Beat

Shares in Microsoft are trading a little lower ahead of the US open on Tuesday. Following the recent breakout from 2021 lows, the company’s stock price has rallied from around the 216 level to recent highs of 245. Price is currently sitting around the 242 level though. On the back of a strong Q4 earnings release, the outlook looks positive for Microsoft.

Microsoft reported Q4 earnings per share of $2.03, beating Wall Street’s $1.64 estimate. Revenues were a little weaker than expected at $37.15 billion, versus the $35.72 Wall Street was looking for. However, they were still 12% higher year on year.

Solid Cross-Sector Increases in Growth

Looking at the breakdown of the data, Azure was once again the company’s fastest-growing business, seeing a 48% jump in revenues, following on from 47% growth in the prior quarter.

This was comfortably above the 44% Wall Street was looking for and suggests that the recent downward trend in growth has bottomed. Microsoft’s cloud business as a whole saw revenues of $12.99 billion. This is a 20% jump from the prior year, beating estimates for a $12.73 billion return.

Elsewhere, the company’s productivity and business processes segment saw revenues of $12.32 billion, an 11% beat on the $11.78 the market was looking for.

Additionally, Microsoft noted that its Teams daily user number has now climbed above 115 million from the 75 million seen at the end of Q1 2020, marking steady growth.

The company’s More Personal Computing segment saw revenues of $11.85 billion. This marked a 6% annual jump and also beats the $11.18 billion Wall Street was looking for. Looking ahead, Microsoft is looking for growth in the “high 20% range” following the release of new Xbox consoles towards the end of 2020.

Weak Points

However, there were some weaker spots in the release. Licensing revenues were seen lower by 5% over the quarter with licensing for commercial devices falling by 22% as a result of the lockdowns and restrictions which have dramatically altered the working environment for many companies.

The firm’s search advertising business also declined over the quarter, falling by 10% with Microsoft forecasting further declines over the current quarter.

Revenues from commercial PCs were also much lower, falling 22%, as a result of the pandemic with Microsoft again forecasting further difficulties in the current quarter and over this year as a whole.

Microsoft Breakout Still Intact

microsoft shares

Microsoft shares have recently broken out of the contracting triangle pattern which had frame price action since Q3 2020. Price broke above the 232.60 former highs to trade new highs of 24.95 before reversing. While the former level holds as support, the bias remains bullish for now. Below there, the next support to note is down at 216.79.

By Orbex

Bitcoin, Dogecoin hit all-time highs driven by Elon Musk – but how to choose an exchange?

By George Prior

– Bitcoin was driven to new record highs Tuesday morning – trading above $48,000 – as investors continue to pile in on the news that Tesla bought $1.5bn worth of the cryptocurrency.

A filing with the U.S. financial regulator on Monday reveals that the electric car company run by the world’s richest person, Elon Musk, has made the massive purchase of the digital asset which has jumped more than 300% in a year.

The surge in the price of Bitcoin and other cryptocurrencies, including Dogecoin – which was also fuelled by an endorsement by Musk on Twitter over the weekend – comes as digital currencies become mainstream due to soaring interest from both retail and institutional investors, increasing levels of mass adoption, and as global interest rates remain at historic lows.

But how does a new crypto investor choose a platform on which to buy, sell, hold and exchange?

Nigel Green, an influential cryptocurrency expert and CEO of deVere Group, one of the world’s largest independent financial advisory and fintech organizations, says there are five fundamentals.

He says: “More and more people are wanting to invest into cryptocurrencies, knowing that they are the future of money.

“But many, even those who have extensive knowledge of the stock market, have concerns about selecting the right cryptocurrency exchange.

“The total capitalisation of the cryptocurrency market is now an estimated $1.2 trillion, but it is still lightly regulated. This means that it’s vital that investors know what to look for in an exchange.”

He continues: “There are five fundamentals for your checklist.

“First, security. The system of a private exchange for saving consumer documents as well as funds should be as decentralised as possible as if it’s all on a couple of web servers, that makes them easy hacking targets.

“Investors should also look for a system that utilises two-step verification throughout login, such as a password, and also quick-expiring codes received through the app.

“Avoid exchanges which offer cheap trade costs or services but are based in areas around the world where investor security is weak.

“In addition, investors ought to assess exchanges as well as the businesses behind them as they would certainly do with any other organisation that they would depend on to protect their money.”

“Second, costs. Some exchanges are proficient at addressing costs in advance, while others hide them. Go for the exchanges that are upfront and transparent.

“Third, simplicity and ease of use. Take into account that you’re not always going to trade from your desktop. In fact, finding an exchange that focuses on ‘on-the-move’ trading via a secure app is often a better option.

“Fourth, dependability. Does the exchange run efficiently when trading quantity is high, or when the currencies rate is see-sawing? Some exchanges are notorious for their system accidents and trading stops.

Fifth, client service. Make sure an exchange has a chat or fast communication service integrated.”

Mr Green concludes: “Whilst Elon Musk’s Tesla, and other institutional investors, including PayPal amongst others, will have teams of crypto experts behind them, retail investors can also get involved.

“Investing in cryptocurrencies remains highly speculative and it is not for everyone – but one of the keys to success would be selecting the right crypto exchange.”

About:

deVere Group is one of the world’s largest independent advisors of specialist global financial solutions to international, local mass affluent, and high-net-worth clients.  It has a network of more than 70 offices across the world, over 80,000 clients and $12bn under advisement.

Murrey Math Lines 09.02.2021 (AUDUSD, NZDUSD)

Article By RoboForex.com

AUDUSD, “Australian Dollar vs US Dollar”

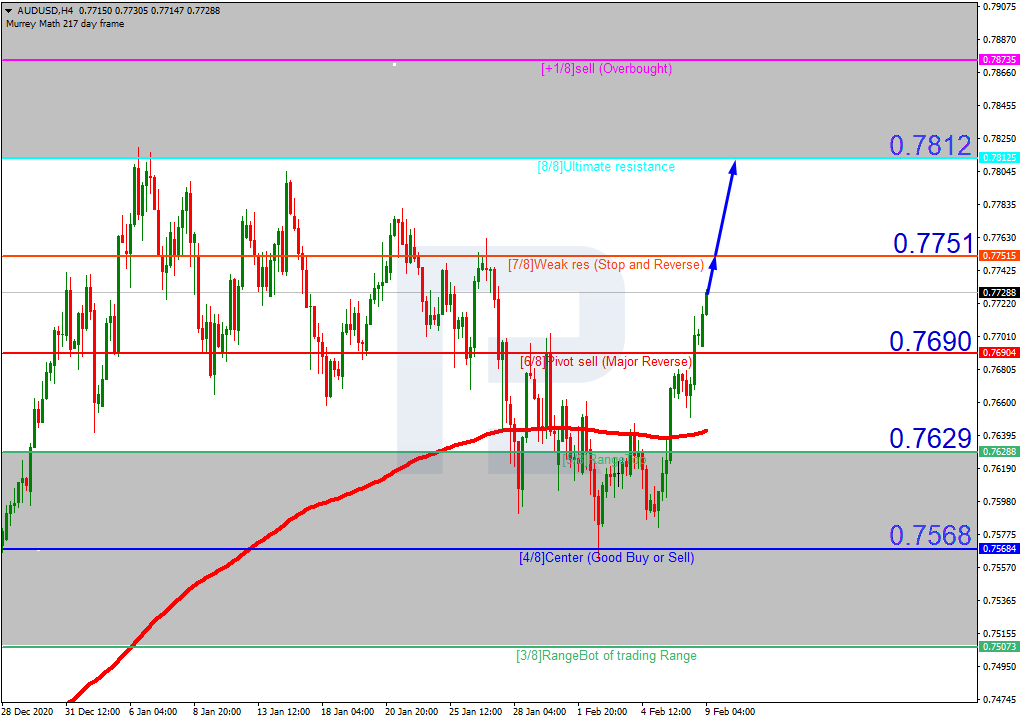
In the H4 chart, AUDUSD is trading above the 200-day Moving Average, thus indicating an ascending tendency. In this case, the price is expected to break 7/8 and then continue growing to reach the resistance at 8/8. However, this scenario may be canceled if the price breaks 6/8 to the downside. After that, the instrument may reverse and fall towards the support at 5/8.

AUDUSD_H4
Risk Warning: the result of previous trading operations do not guarantee the same results in the future

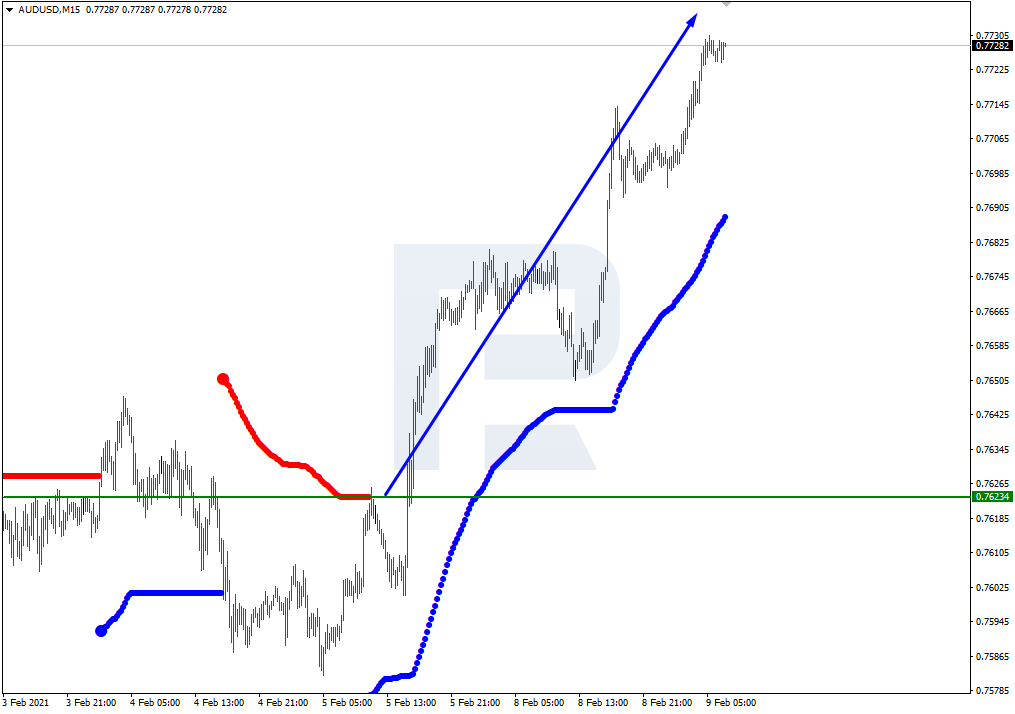
As we can see in the M15 chart, the pair has broken the upside line of the VoltyChannel indicator and, as a result, may continue trading upwards.

AUDUSD_M15
Risk Warning: the result of previous trading operations do not guarantee the same results in the future

NZDUSD, “New Zealand Dollar vs US Dollar”

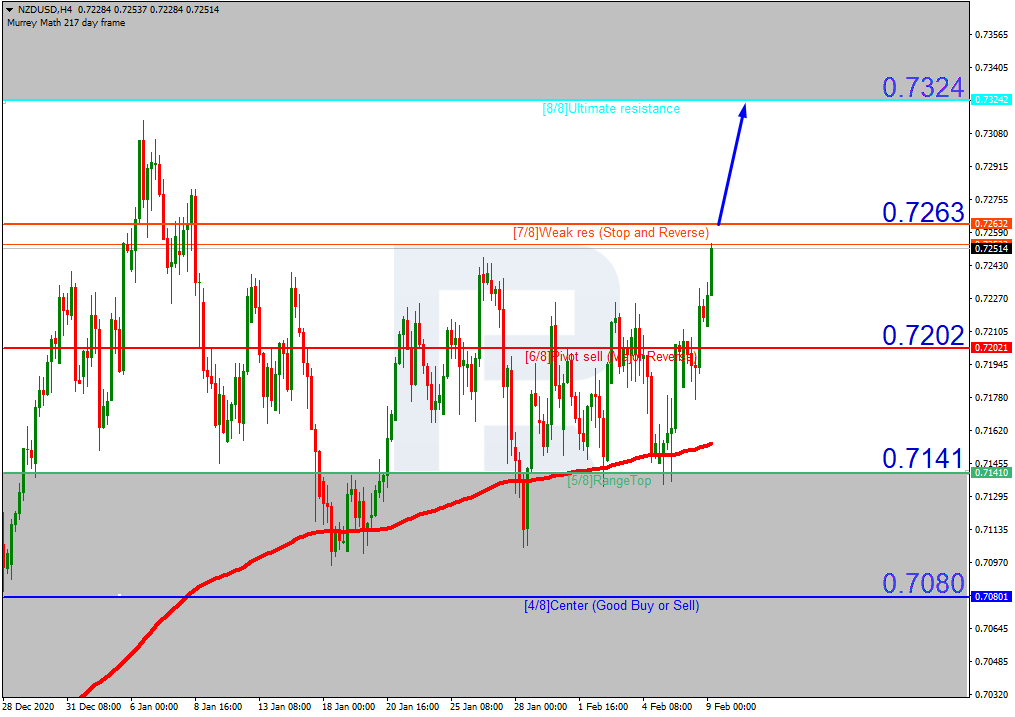
In the H4 chart, NZDUSD is also trading above the 200-day Moving Average, thus indicating an ascending tendency. downwards. In this case, the price is expected to break 7/8 and then continue growing towards the resistance at 8/8. However, this scenario may no longer be valid if the price breaks 6/8 to the downside. In this case, the instrument may continue falling to reach the support at 5/8.

NZDUSD_H4
Risk Warning: the result of previous trading operations do not guarantee the same results in the future

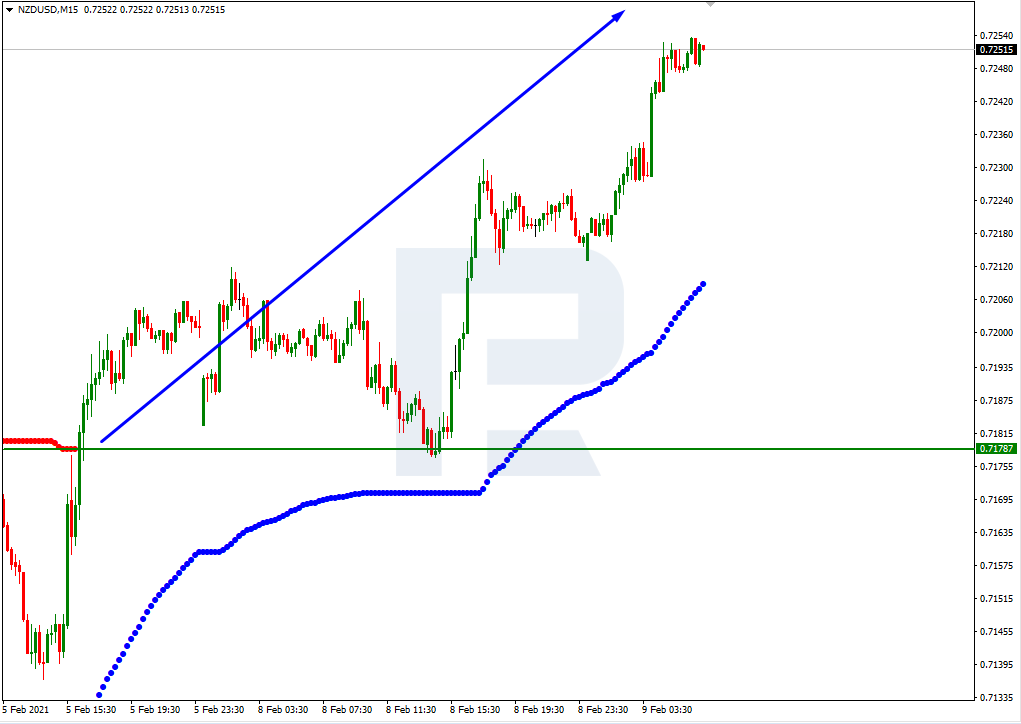
As we can see in the M15 chart, the price has broken the upside line of the VoltyChannel indicator and, as a result, may continue growing towards 8/8 from the H4 chart.

NZDUSD_M15

Article By RoboForex.com

Attention!
Forecasts presented in this section only reflect the author’s private opinion and should not be considered as guidance for trading. RoboForex LP bears no responsibility for trading results based on trading recommendations described in these analytical reviews.

Forex Technical Analysis & Forecast 09.02.2021

Article By RoboForex.com

EURUSD, “Euro vs US Dollar”

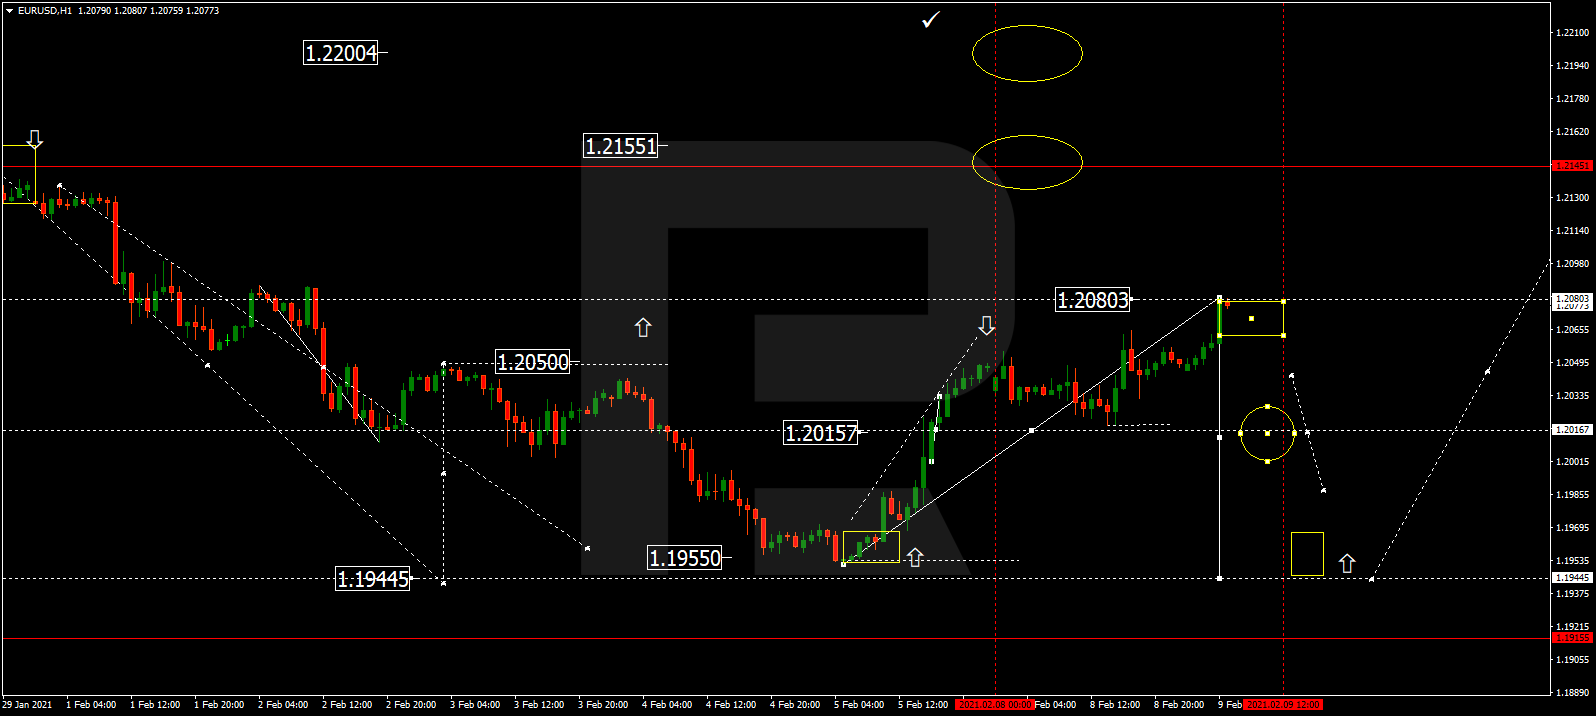
After forming another consolidation range around 1.2050, EURUSD has expanded it up to 1.2080. Later, the market may form a new descending structure to break 1.2015 and then continue falling with the target at 1.1944.

EURUSD
Risk Warning: the result of previous trading operations do not guarantee the same results in the future

GBPUSD, “Great Britain Pound vs US Dollar”

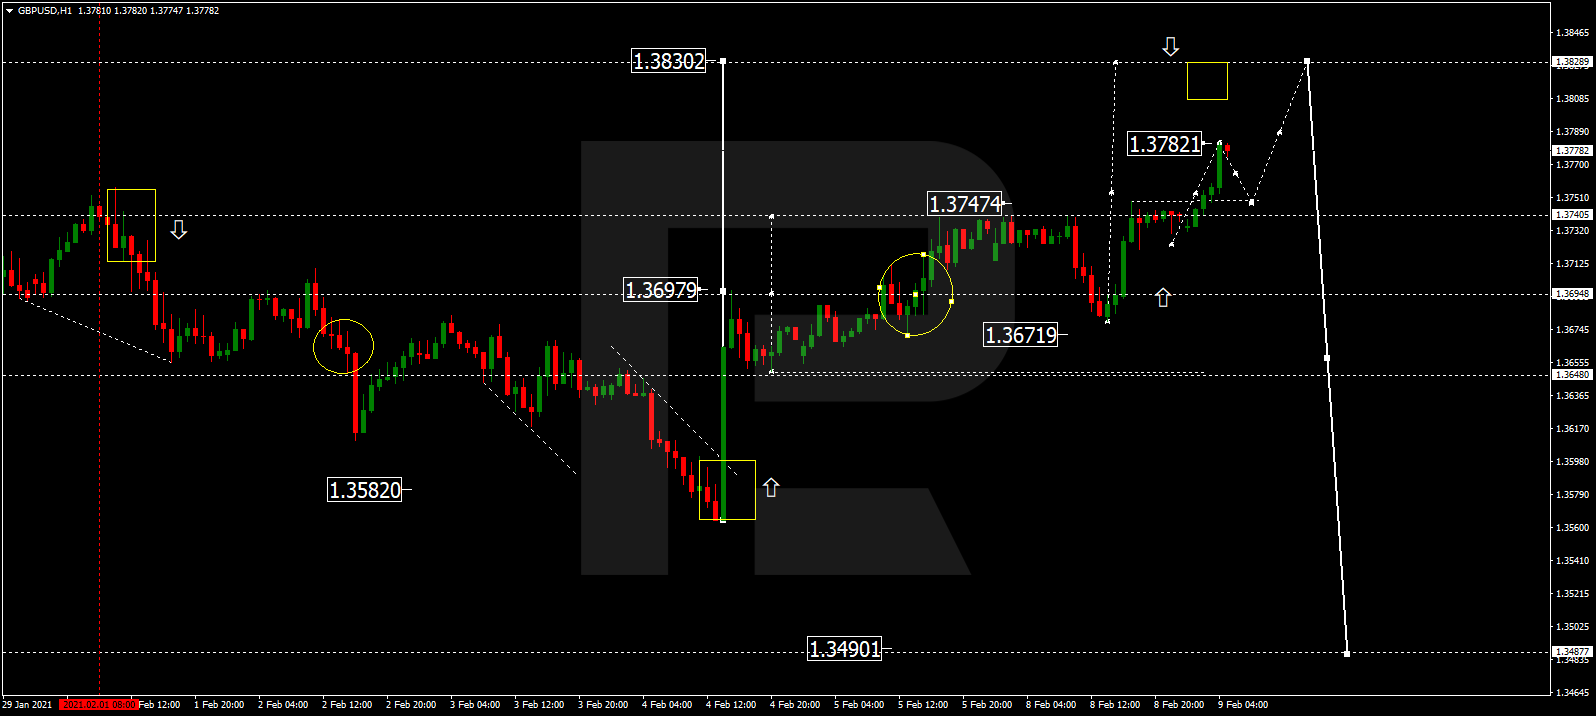
GBPUSD has expanded its consolidation range up to 1.3782. Possibly, today the pair may fall to reach 1.3740 and then form one more ascending structure towards 1.3820. 1.3671. After that, the instrument may start another decline to break 1.3672 and then continue trading downwards with the target at 1.3600.

GBPUSD
Risk Warning: the result of previous trading operations do not guarantee the same results in the future

USDRUB, “US Dollar vs Russian Ruble”

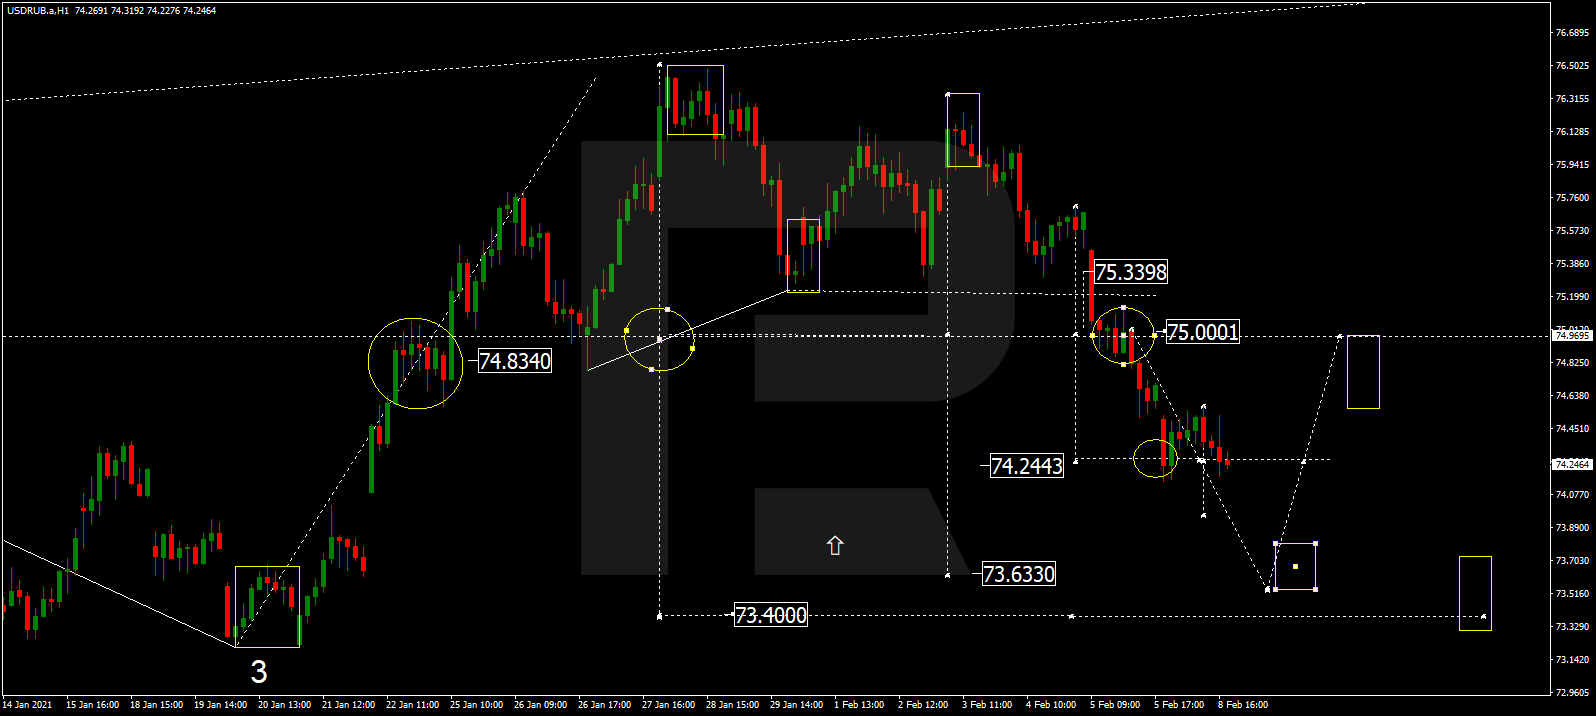
USDRUB has completed the descending wave at 74.24; right now, it is consolidating around this level. Possibly, the pair may break the range to the downside and then resume trading downwards with the short-term target at 73.63.

USDRUB
Risk Warning: the result of previous trading operations do not guarantee the same results in the future

USDJPY, “US Dollar vs Japanese Yen”

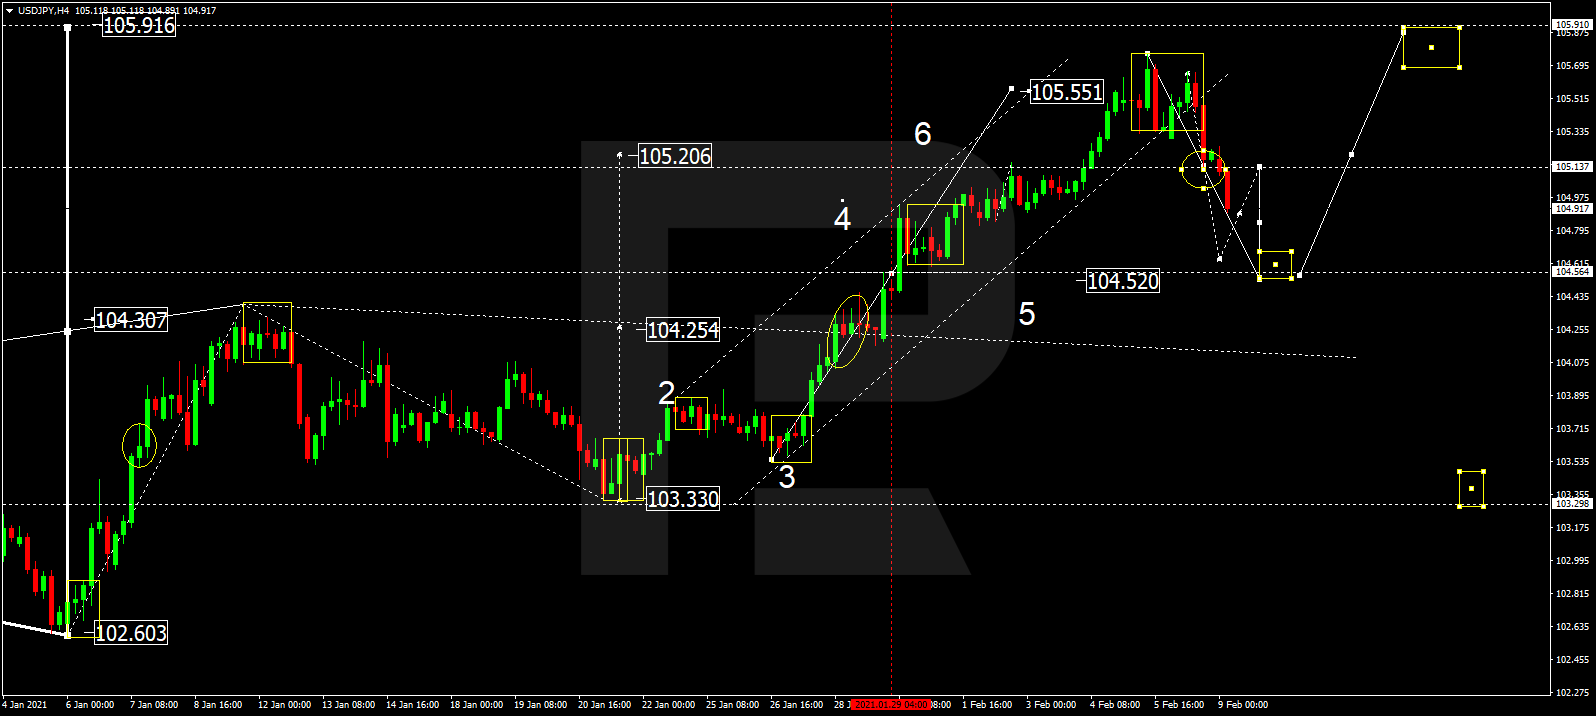
USDJPY is still falling towards 104.64. Later, the market may resume growing with the target at 105.10 and then form a new descending structure to reach 104.50.

USDJPY
Risk Warning: the result of previous trading operations do not guarantee the same results in the future

USDCHF, “US Dollar vs Swiss Franc”

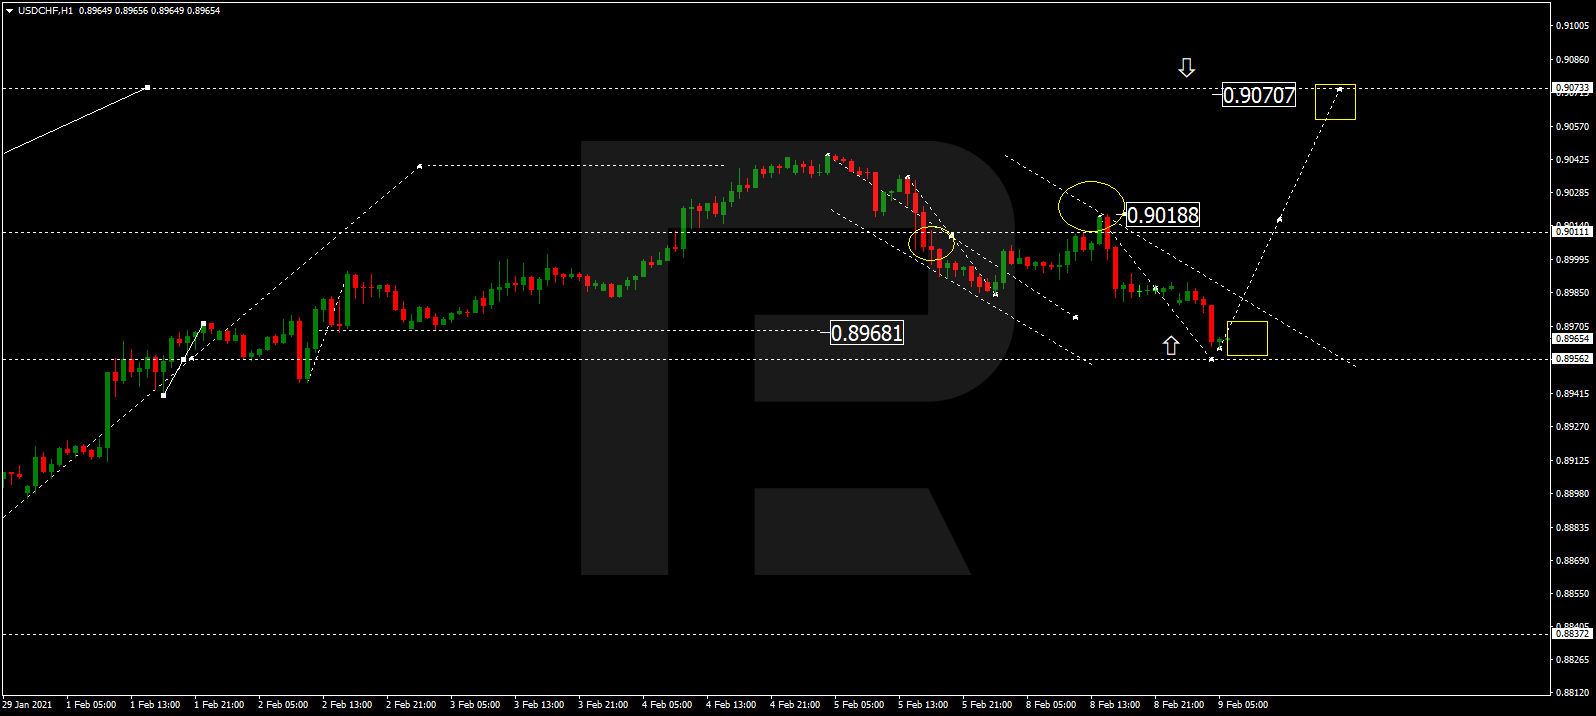
USDCHF has reached the key correctional target at 0.8969; right now, it is consolidating there. Possibly, the pair may expand the range down to 0.8955 and then form one more ascending structure with the target at 0.9070.

USDCHF
Risk Warning: the result of previous trading operations do not guarantee the same results in the future

AUDUSD, “Australian Dollar vs US Dollar”

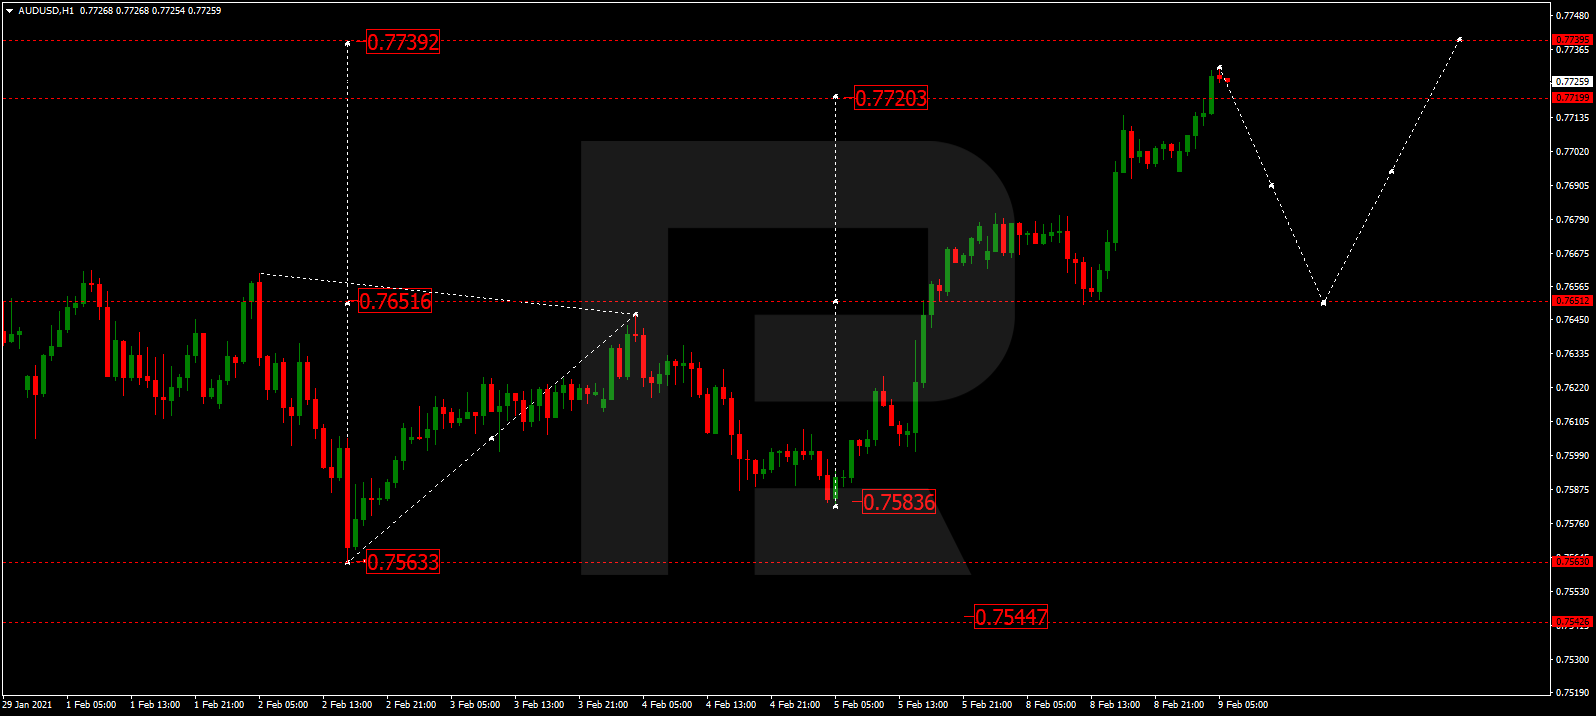
After reaching the short-term upside target at 0.7720, AUDUSD is expected to consolidate there. Later, the market may break the range to the downside and correct towards 0.7651. After that, the instrument may start another growth with the target at 0.7739.

AUDUSD
Risk Warning: the result of previous trading operations do not guarantee the same results in the future

BRENT

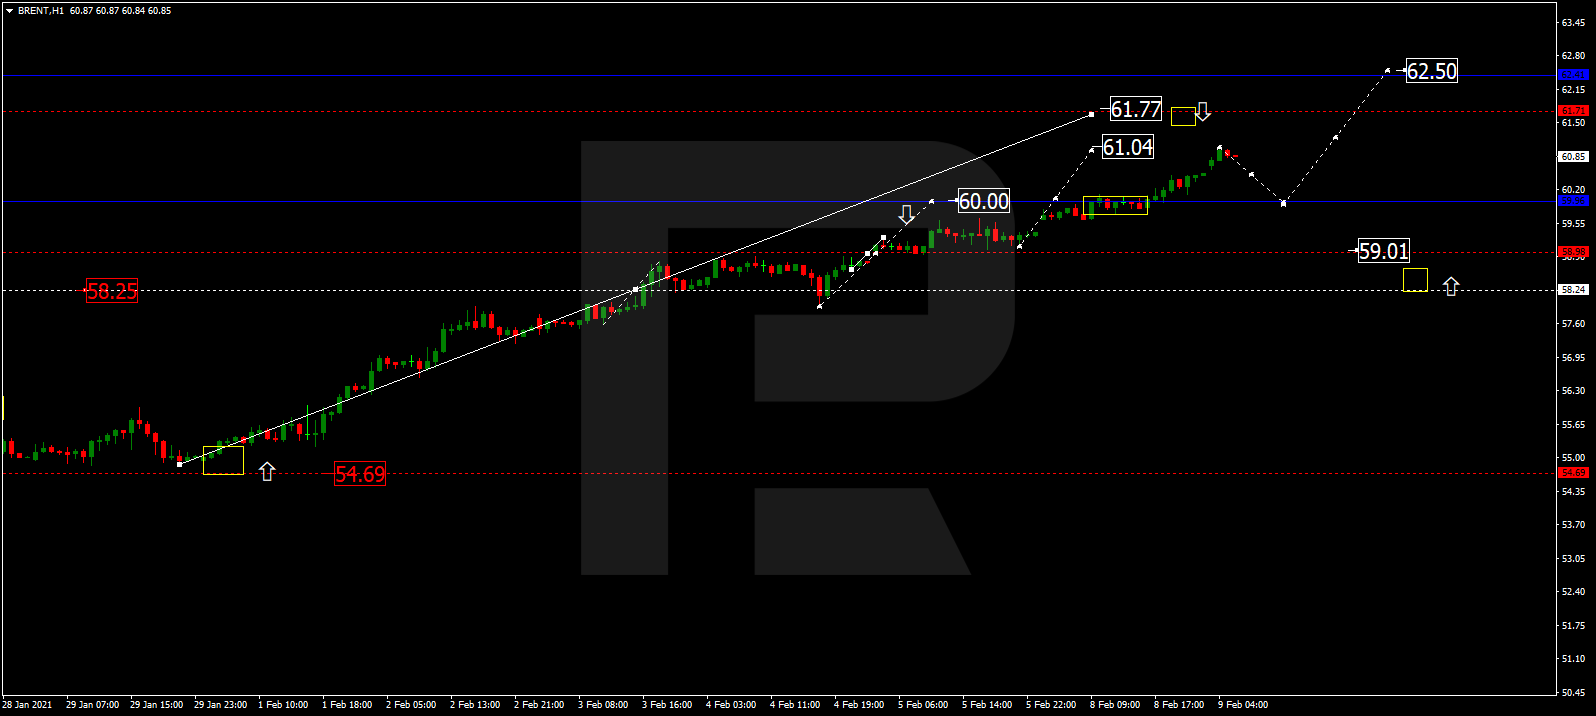
After reaching 60.00 and forming a new consolidation range there, Brent has broken it to the upside to reach 61.00. After that, the instrument may correct to return to 60.00. and then form one more ascending structure with the key target at 62.50.

BRENT
Risk Warning: the result of previous trading operations do not guarantee the same results in the future

XAUUSD, “Gold vs US Dollar”

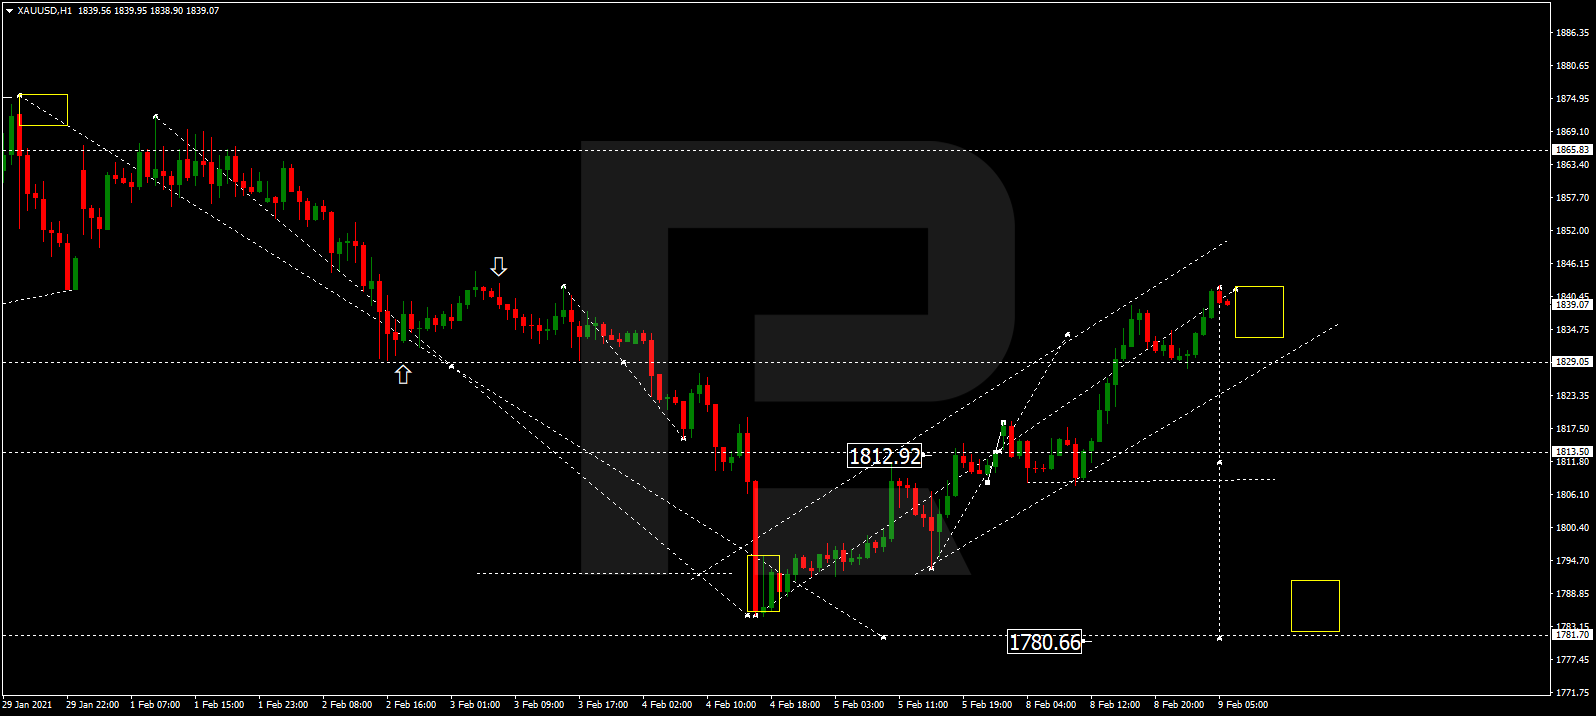
After forming another consolidation range around 1813.50 and breaking it to the upside, Gold has completed this ascending wave at 1842.22. Today, the metal may start consolidating around the latter level. Later, the market may break the range to the downside and resume trading downwards with the target at 1780.70.

GOLD
Risk Warning: the result of previous trading operations do not guarantee the same results in the future

BTCUSD, “Bitcoin vs US Dollar”

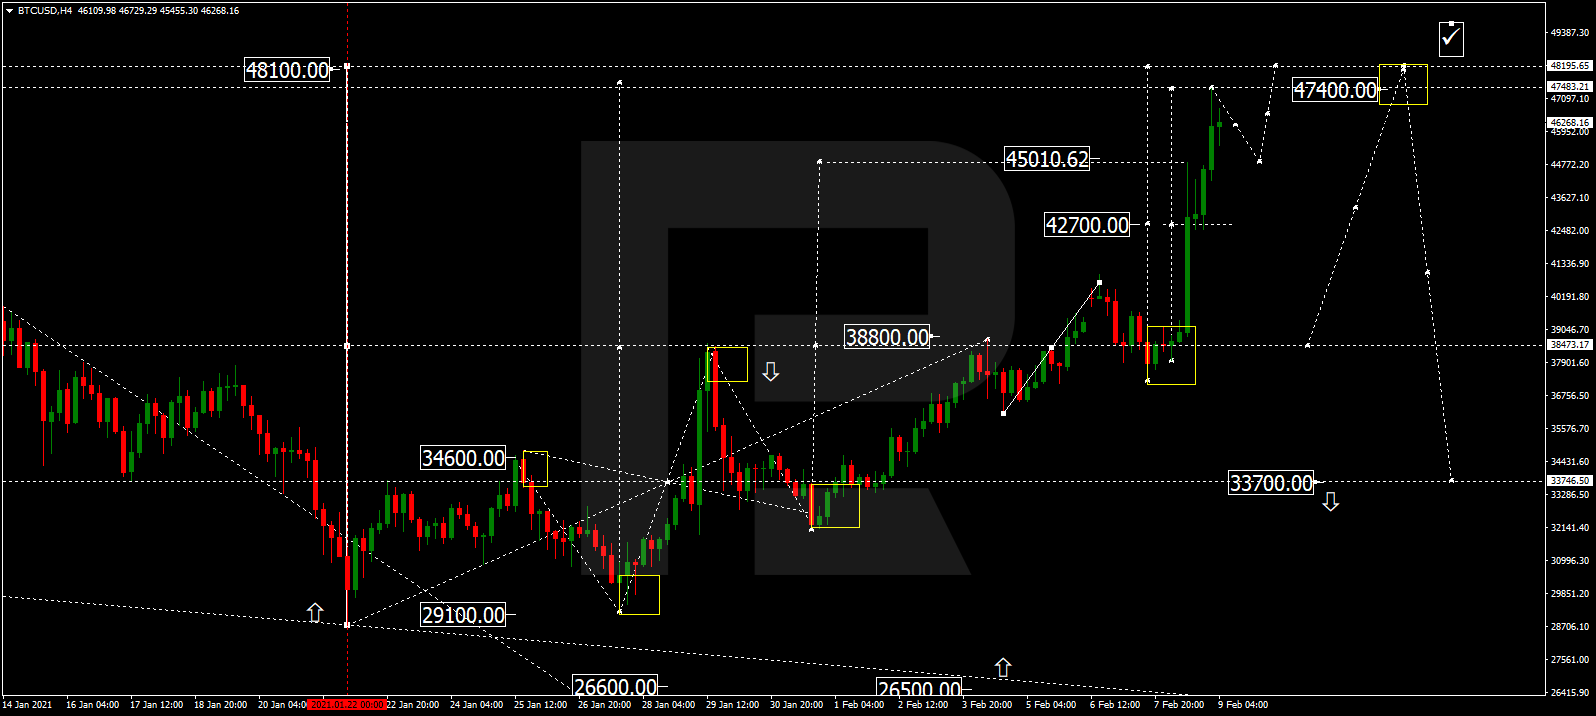
After forming a new consolidation range around38800.00 and breaking it to the upside, BTCUSD continues extending the current ascending wave with the target at 48100.00. After that, the instrument may resume falling with the target at 38800.00.

BITCOIN
Risk Warning: the result of previous trading operations do not guarantee the same results in the future

S&P 500

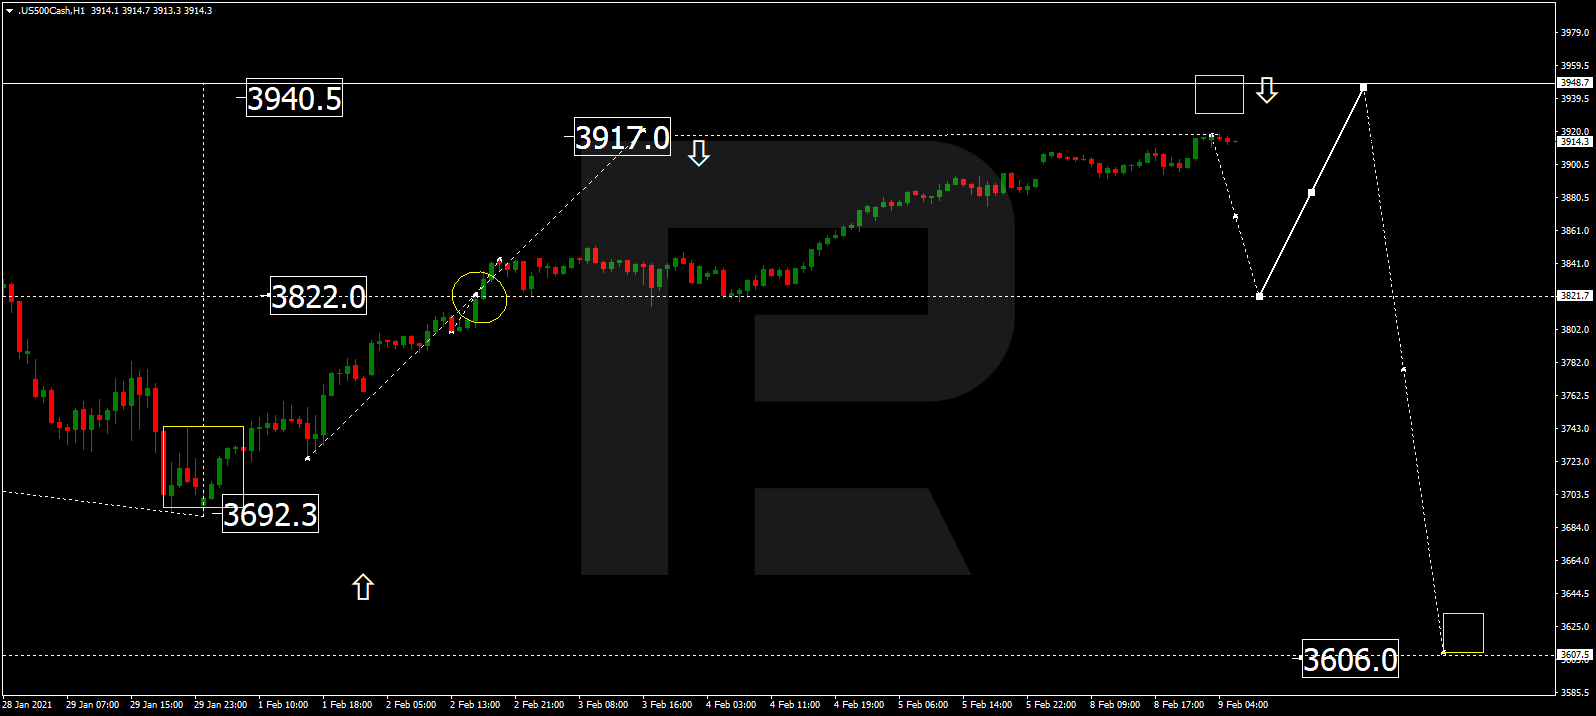
The S&P index has completed the ascending wave with the short-term target at 3917.0. Today, the asset may consolidate around this level. After breaking the range to the downside, the instrument may correct towards 3821.7 and then form one more ascending wave with the target at 3940.5.

S&P 500

Article By RoboForex.com

Attention!
Forecasts presented in this section only reflect the author’s private opinion and should not be considered as guidance for trading. RoboForex LP bears no responsibility for trading results based on trading recommendations described in these analytical reviews.

The Analytical Overview of the Main Currency Pairs on 2021.02.09

by JustForex

The EUR/USD currency pair

Technical indicators of the currency pair:
  • Prev Open: 1.2037
  • Prev Close: 1.2049
  • % chg. over the last day: +0.10%.

The EUR/USD continues to move north after Friday’s impulse. The price has consolidated above the important level of 1.2059, which means a trade transition to the upper range and the cancellation of the southern corrective movement. At the same time, the long-term southern trend of the dollar index remains.

Trading recommendations
  • Support levels: 1.2059, 1.1951
  • Resistance levels: 1.2155, 1.2189

The main scenario for trading the EUR/USD is buying. Technical indicators have rearranged northward. The ADX continues to show increasing upside potential. The moving averages turned upwards.

Alternative scenario: if the price consolidates below the level of 1.2033, the pair may return to 1.1951.

EUR/USD
There is no news feed for today.

The GBP/USD currency pair

Technical indicators of the currency pair:
  • Prev Open: 1.3712
  • Prev Close: 1.3737
  • % chg. over the last day: +0.18%

Today, during the Asian session, the sterling has managed to break through an important resistance level, making the northern trend stable and long-term. The only disturbing thing is that the breakthrough occurred during the Asian session in conditions of low liquidity. A price exit above 1.3757 could be speculative and traders need to be vigilant.

Trading recommendations
  • Support levels: 1.3757, 1.3680
  • Resistance levels: 1.3800, 1.3900

The main scenario for the GBP/USD is trading sideways between 1.3757 and 1.3800. Despite the seemingly strong northward momentum, the ADX showed little reaction. The MACD also ignores the movement – a divergence has been formed on the chart. These are signs that a breakthrough of the key level may turn out false.

Alternative scenario: if the pair consolidates above 1.3800, it is likely to continue rising to 1.3900. A breakthrough of 1.3757 will bring the pair back to the previous range.

GBP/USD
There is no news feed for today.

The USD/JPY currency pair

Technical indicators of the currency pair:
  • Prev Open: 105.34
  • Prev Close: 105.21
  • % chg. over the last day: -0.12%

The dollar-yen pair is showing a sudden reversal amid the falling dollar index and falling yields on major government bonds. The Japanese currency is growing, so are the defensive assets such as gold and the Swiss franc.

Trading recommendations
  • Support levels: 104.82, 104.40
  • Resistance levels: 105.77, 106.12

The main scenario is selling. The ADX rose sharply on the pair’s decline, indicating a likely reversal of the northern trend. Although, now the oscillator has reached the oversold area, and the price is in the area of the first support. In this case, a rollback is possible.

An alternative scenario implies the price-fixing above 105.36. In this case, the pair may rise to 105.68.

USD/JPY
There is no news feed for today.

The USD/CAD currency pair

Technical indicators of the currency pair:
  • Prev Open: 1.2756
  • Prev Close: 1.2735
  • % chg. over the last day: -0.17%

The Canadian dollar is showing robust growth amid continuing increases in oil prices. The H4 timeframe shows an increase in indicators in favor of bears in the USD/CAD, which indicates a stable mid-term southern trend. There are no fundamental drivers for the pair’s growth yet.

Trading recommendations
  • Support levels: 1.2686, 1.2590
  • Resistance levels: 1.2844, 1.2875

The main scenario is selling. The ADX on the H1 timeframe shows a high potential for a decline, while the oversold area is still far away. It means that the pair may not only reach the support level but also break it.

Alternative scenario: if the price manages to gain a foothold above 1.2781, the pair may resume its growth to the resistance level of 1.2844 or higher.

USD/CAD
There is no news feed for today.

by JustForex


This article reflects a personal opinion and should not be interpreted as an investment advice, and/or offer, and/or a persistent request for carrying out financial transactions, and/or a guarantee, and/or a forecast of future events.

The stock market is setting new records as the dollar index declines and commodity prices rise

by JustForex

On Monday and Tuesday’s Asian session, the dollar index continued to decline. Disappointing statistics on the labor market continue to affect the greenback negatively, and the movement in the commodity market only aggravates the position of the American currency.

The oil market continues to pick up speed. Brent crude exceeded $60 per barrel amid declining production and a gradual recovery in demand. Together with the expectation of new cash injections into the US economy, the growth of the commodity market puts upward pressure on inflationary expectations. The latter factor, in its turn, supports the quotes of gold, which has been growing for the third day in a row following the government bonds yield.

The precious metal showed the strongest gains since January 5 after Democrats released the first draft of a key bill that will include President Joe Biden’s COVID-19 economic aid bill. Economists are assessing the likelihood of accelerating inflation, prompting investors to seek refuge in gold.

Meanwhile, the Bank of France has published encouraging forecasts for economic growth. Economic activity in the country is 5% below pre-crisis levels, but economists estimate that it is doing better than expected. After decreasing by 7% below normal during the November lockdown, there was stabilization in December and the economy is expected to remain stable throughout February, according to the central bank’s monthly survey of 8,500 companies from January 27 to February 3.

Against the background of the growth of the raw materials market and bond yields, the northern trend is observed on the stock exchanges. The S&P 500 has surpassed the level of 3900.00. Treasury yields have stabilized at around 1.160%.

Main market quotes:

S&P 500 (F) 3,908.38 +0.28 (+0.01%)

Dow Jones 31,385.76 +237.52 (+0.76%)

DAX 14,039.40 -20.51 (-0.15%)

FTSE 100 6,525.75 +2.22 (+0.03%)

USD Index 90.688 -0.257 (-0.28%)

There is no news feed for today.

by JustForex


This article reflects a personal opinion and should not be interpreted as an investment advice, and/or offer, and/or a persistent request for carrying out financial transactions, and/or a guarantee, and/or a forecast of future events.

Twitter’s Q4 earnings come as share prices at 7-year high

By Han Tan, Market Analyst, ForexTime

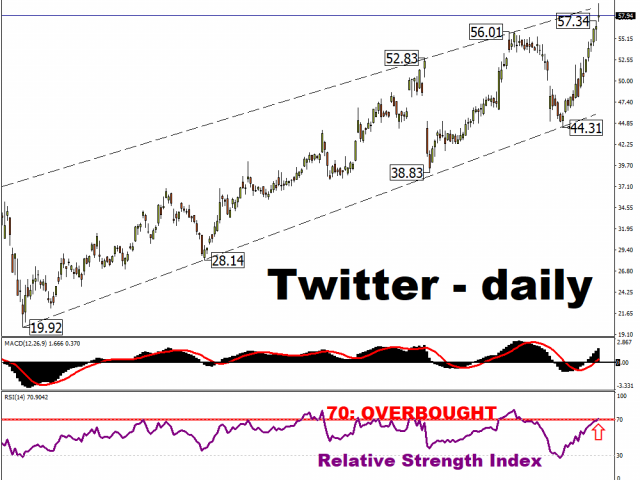
Twitter’s Q4 earnings are set to be released after US markets close on Tuesday, with its share prices currently at their highest levels since Feb 2014.

The stock has proven resilient even in the face of the pandemic and amidst political turbulence, having surged by more than 160% since the March 2020 bear market.

From a technical perspective, Twitter looks ripe for a sell-the-news event. After all, its 14-day relative strength index has already broken into overbought territory, which typically suggests that a pullback is in order, and possibly even healthy.

The catalyst for such a pullback could arrive when Twitter reveals its Q4 performance, which is set to unveil some strong numbers along the lines of what’s already been seen by other social media platforms such as Facebook and Snapchat for the same period.

Twitter’s forecasted Q4 results

The company’s top line is expected to come in at $1.19 billion, which is the second time its quarterly revenue has ever exceeded the $1 billion mark (the previous occasion was in Q4 2019). This was likely aided by the boost from the November 2020 US presidential election.

Twitter’s Q4 adjusted net income is set to register a year-on-year growth of 20.6 percent to $245 million, although it probably won’t be enough to offset a full-year loss of $307.6 million.

What will Twitter’s shareholders be paying attention to?

Shareholders are more likely to focus on how Twitter plans to enhance its mobile-ad products so as to help monetize its user base of over 190 million.

Twitter has clearly lagged other tech giants in being able to monetize its offerings. For context, Twitter’s 2020 revenue is expected to make up just 1/8th of Facebook’s net income for the year. According to EMarketer, Twitter’s market share for digital ads worldwide is a measly 0.8 percent.

Such is the disparity.

What are the downside risks to social media companies?

Social media platforms often get caught in the crossfires amid political chaos, from the US to Myanmar. From battling misinformation to removing accounts, such efforts require a tremendous amount of time and resources, which could weigh on Twitter’s bottom line.

And then there’s the public fallout to contend with as well. When Twitter banned former President Donald Trump from its platform on January 8th, many users pledged to jump ship too, prompting Twitter’s share prices to fall 12.2 percent in the week following the company’s decision. Although to be fair, the stock has recovered remarkably well since.

It remains to be seen how the likes of Twitter and the rest of Big Tech can handle the heightened scrutiny from lawmakers.

The risk of more regulations being imposed on social media platforms may serve as a headwind on these stocks over the near- to medium-term.

How might Twitter’s share price perform after its Q4 earnings are released?

Twitter’s stock has, on average, seen an absolute one-day move of 12.7% after its quarterly earnings are released.

For this Wednesday, which would be the first cash session after its imminent earnings announcement, markets are already pricing in a similar move of about 12% either upwards or downwards.

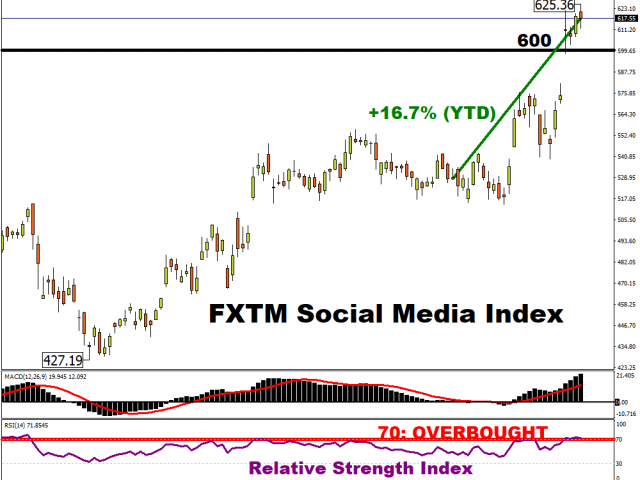
Such a move could have a major impact on the FXTM Social Media index, which is an evenly-weighted index comprising the stocks of Twitter, Facebook, Google, and Snapchat. The double-digit, year-to-date gains in the likes of Google and Snapchat have been able to offset the declines in Facebook’s share prices so far in 2021:

  • Facebook: -2.41%
  • Twitter: 7.48%
  • Google: 18.94%
  • Snap: 27.38%

Twitter is the last of the 4 constituents of the FXTM Social Media index to report its Q4 2020 earnings.

With the FXTM Social Media index trading near its record high, and having been in technically overbought territory over the past week, Twitter’s announcement could well determine whether the index has good reason push to a new record high in mid-week.


Disclaimer: The content in this article comprises personal opinions and should not be construed as containing personal and/or other investment advice and/or an offer of and/or solicitation for any transactions in financial instruments and/or a guarantee and/or prediction of future performance. ForexTime (FXTM), its affiliates, agents, directors, officers or employees do not guarantee the accuracy, validity, timeliness or completeness, of any information or data made available and assume no liability as to any loss arising from any investment based on the same.


Forex-Time-LogoArticle by ForexTime

ForexTime Ltd (FXTM) is an award winning international online forex broker regulated by CySEC 185/12 www.forextime.com

US-China Reset Key to Brighter Global Economic Prospects

By Dan Steinbock

– After four years of US-Sino tensions, the Biden administration could speed up US recovery, while restoring bilateral trust with China. That would foster global economic prospects. The reverse would undermine those prospects.

In the United States, the third wave of the COVID-19 peaked with 250,000 confirmed cases daily after the holiday period. Following the catastrophic mishandling of the pandemic by the Trump administration, total cases are approaching 27 million and the 440,000 deaths exceed US military fatalities in World War II.

After effective containment, confirmed cases in China remain below 90,000. With the Spring Festival holidays just days away, recent resurgences have renewed concerns about outbreaks and people have been urged to avoid travels during holidays. Despite some unease, public-health authorities believe a major outbreak is unlikely.

The key question is will China’s recovery prevail amid the dire global landscape and will US recovery begin later in the year. Due to the great size of the two economies, the former is vital to many emerging and developing countries, while the latter is critical to major advanced economies.

Both require restoring US-Sino trust after years of devastation.

US: growth in return for debt  

In the past year, US economy suffered a -3.5% contraction, despite ultra-low interest rates, low inflation, weak dollar and huge fiscal injections.

The CARES Act has kept economy humming between the lockdowns. However, exports have contracted. Industrial production has begun to recover, but even more slowly than consumption. Last November, US trade deficit in goods jumped to record high. Better days won’t return before a critical mass of vaccinations, around the 3rd quarter of the year.

Here’s the caveat: The consumption-led recovery is leveraged to the hilt, relying on costly stimuli and rapidly-rising debt. In the past four years, US national debt has soared to more than $28 trillion, which puts US federal debt-to-GDP ratio at 128%.

How will the Democrats cope with the debt burden?

Instead of focusing on the size of US debt, says Jason Furman, President Obama’s former lead economic adviser, “policymakers should assess fiscal capacity in terms of real interest payments, ensuring they remain comfortably below 2 percent of GDP.” That would ensure adequate fiscal support and needed public investments, while maintaining a sustainable public debt.

As a share of GDP, the cost of servicing US debt has fallen since 2000, even as federal debt has increased. Low interest rates make it easier to pay off debts. However, deficits will more than double from 2010-19 to 10.9% percent of GDP in 2041-50, according to the nonpartisan Congressional Budget Office. By 2050, debt as a percentage of GDP will amount close to 200% of the GDP, as net spending for interest as a share of GDP could quadruple over 2031-50.

That’s a ticking time bomb.

China: key indexes signal broad recovery  

In 2020, China’s real GDP growth of 2.3 percent exceeded expectations. It was the only major economy to avoid negative economic growth. The performance relied on fiscal and monetary support, but as recovery is accelerating, monetary easing no longer seems warranted.

Although consumption is still constrained, investment is likely to be buoyed by government-financed infrastructure projects and solid performance in the property market. In November, the indexes for manufacturing, service, trade and consumption were encouraging, while growth in the 4th quarter of last year rose to 6.5 percent year-on-year as consumers returned to malls, restaurants and cinemas.

Thanks to across-the-board recovery, the yuan has surged in strength against the US dollar and other major currencies.

Despite US-Sino tensions, foreign companies continue to pour money into China, thanks to the new foreign investment law to further open up the economy. In real terms, inbound foreign direct investment hit a record high of $144 billion in 2020.

In November, China signed the Regional Comprehensive Economic Partnership (RCEP) agreement with the 10 ASEAN member states, plus Japan, South Korea, Australia and New Zealand. That will boost regional trade and boost recovery.

The impressive increase in China’s exports pushed the trade surplus to a record high in December, with soaring demand for medical equipment to fight the pandemic. Thanks to the effective containment of the epidemic in the 2nd quarter 2020, Chinese factories could respond to the global demand for such products, while other countries struggled with quarantines and lockdowns.

Importantly, the integration of the Chinese financial market with the global financial markets has accelerated, thanks to China’s regulatory reforms have. Consequently, foreign ownership of onshore Chinese stocks and bonds is likely to increase in 2021.

From Cold War to partners and rivals

After decades of US-Sino progress, Trump let high-level dialogues crumble in economic, law enforcement, and cultural affairs as well as diplomatic and security relations. These multi-level dialogues should be restored to foster strategic trust that took four decades to build and four years to kill.

After the Phase-I deal, China was obliged to buy $200 billion in additional US imports over two years on top of pre-trade war purchase levels. That was impossible amid Trump protectionism and global pandemic. What is needed is a reset to re-build a new appropriate path of dialogue in bilateral trade and advanced technology.

Before the trade wars, US investment to China averaged $15 billion per year, whereas Chinese investment in the US soared to $45 billion. US investment to China has persisted and most US companies plan to stay there. Yet, Chinese investment in the US has been forced to plunge. It is time to restart bilateral investment talks to facilitate a new rapprochement.

Despite political differences, US-China military exchanges used to feature high-level visits, exchanges between defense officials, and functional interactions. As these engagements fell by two-thirds in the Trump era, bilateral tensions have surged in South and East China Sea and a major conflict may be just a matter of time. What’s needed is a restart in military dialogues, at all levels and in all arenas.

China fueling over a third of global growth prospects

This year China’s economic growth is expected to rise further to 7 to 8 percent, followed by stabilization to 5.5% in 2022. Rapid recovery has brought Chinese economy closer to the US economic output, which it could surpass by the late 2020s.

Assuming the Biden administration can avoid new economic and pandemic pitfalls, US growth could rise to 5.0 percent, followed by stabilization to 2.2 percent in 2022.

In both cases, positive spillover effects would support global economic recovery.

The question is whether the Biden administration will opt for a cooperative scenario, which would result in some tariffs, moderated protectionism and efforts to avoid redundant conflicts, which would facilitate US recovery and global economic prospects. A reverse scenario would push those very same prospects back to the edge of global depression.

In December, the Organization for Economic Co-operation and Development (OECD) forecast that global GDP will reach the pre-pandemic level by the end of 2021. In this view, China will account for over a third of world economic expansion.

That contribution is critical to global economy.

About the Author:

Dr. Dan Steinbock is an internationally recognized strategist of the multipolar world and the founder of Difference Group. He has served at the India, China and America Institute (USA), Shanghai Institutes for International Studies (China) and the EU Center (Singapore). For more, see https://www.differencegroup.net 

The commentary was released by China-US Focus on Feb. 8, 2021