Forex Technical Analysis & Forecast 15.02.2021

Article By RoboForex.com

EURUSD, “Euro vs US Dollar”

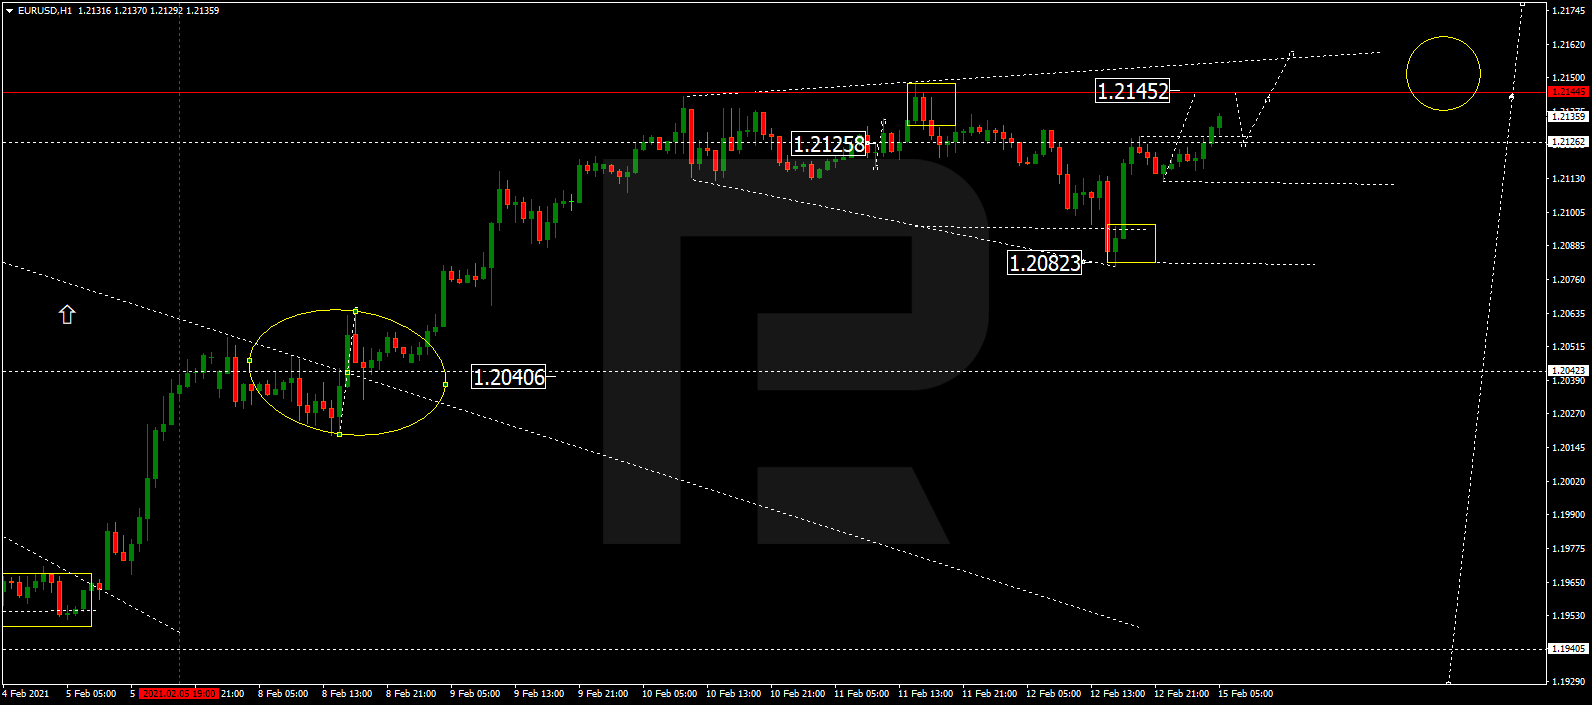
After finishing the correctional structure at 1.2082 and then returning to 1.2125, EURUSD continues consolidating. Possibly, today the pair may expand the range up to 1.2145 and then start another decline to reach 1.2121. Later, the market may form one more ascending structure with the target at 1.2155.

EURUSD
Risk Warning: the result of previous trading operations do not guarantee the same results in the future

GBPUSD, “Great Britain Pound vs US Dollar”

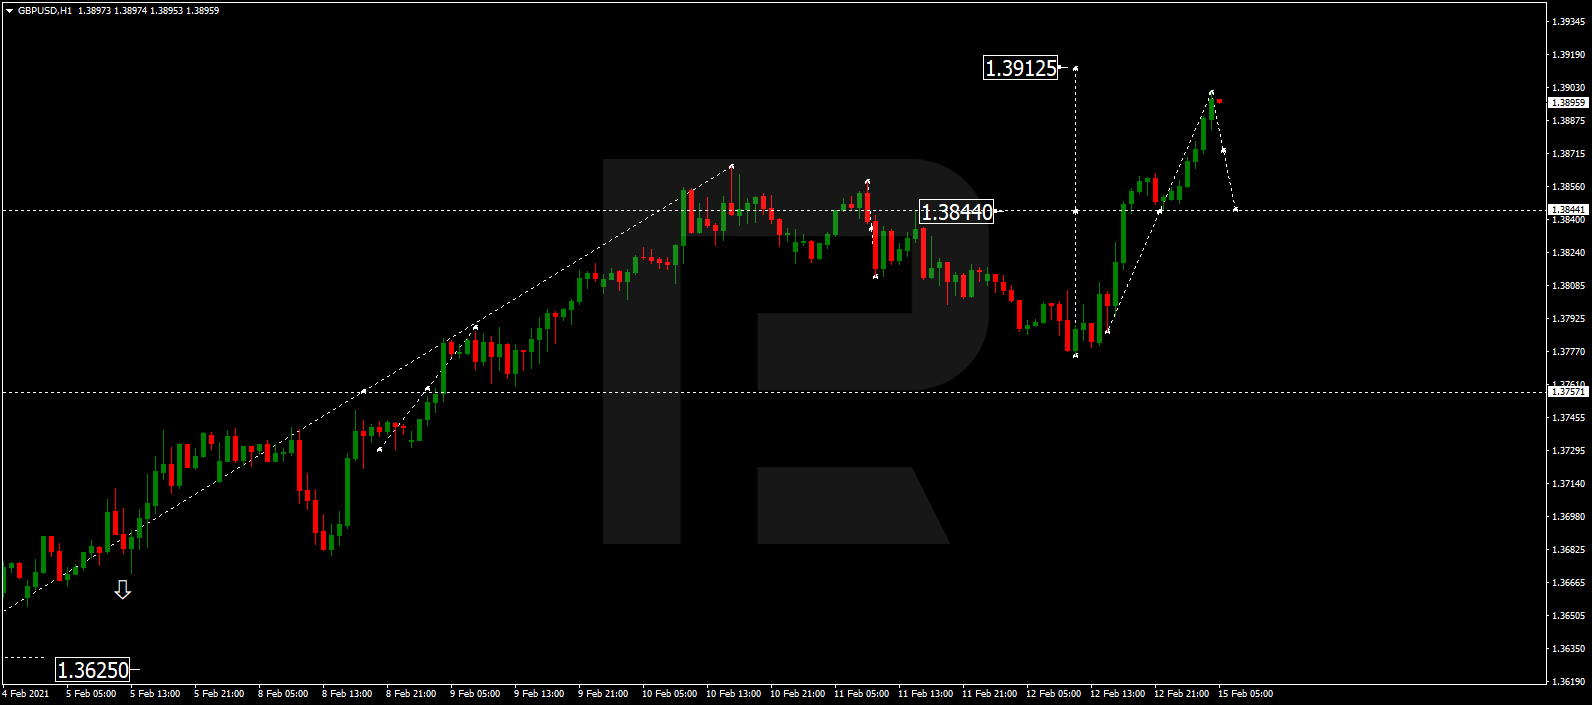
After completing the correctional structure at 1.3775, GBPUSD is moving upwards to reach 1.3812. After that, the instrument may resume falling with the target at 1.3770.

GBPUSD
Risk Warning: the result of previous trading operations do not guarantee the same results in the future

USDRUB, “US Dollar vs Russian Ruble”

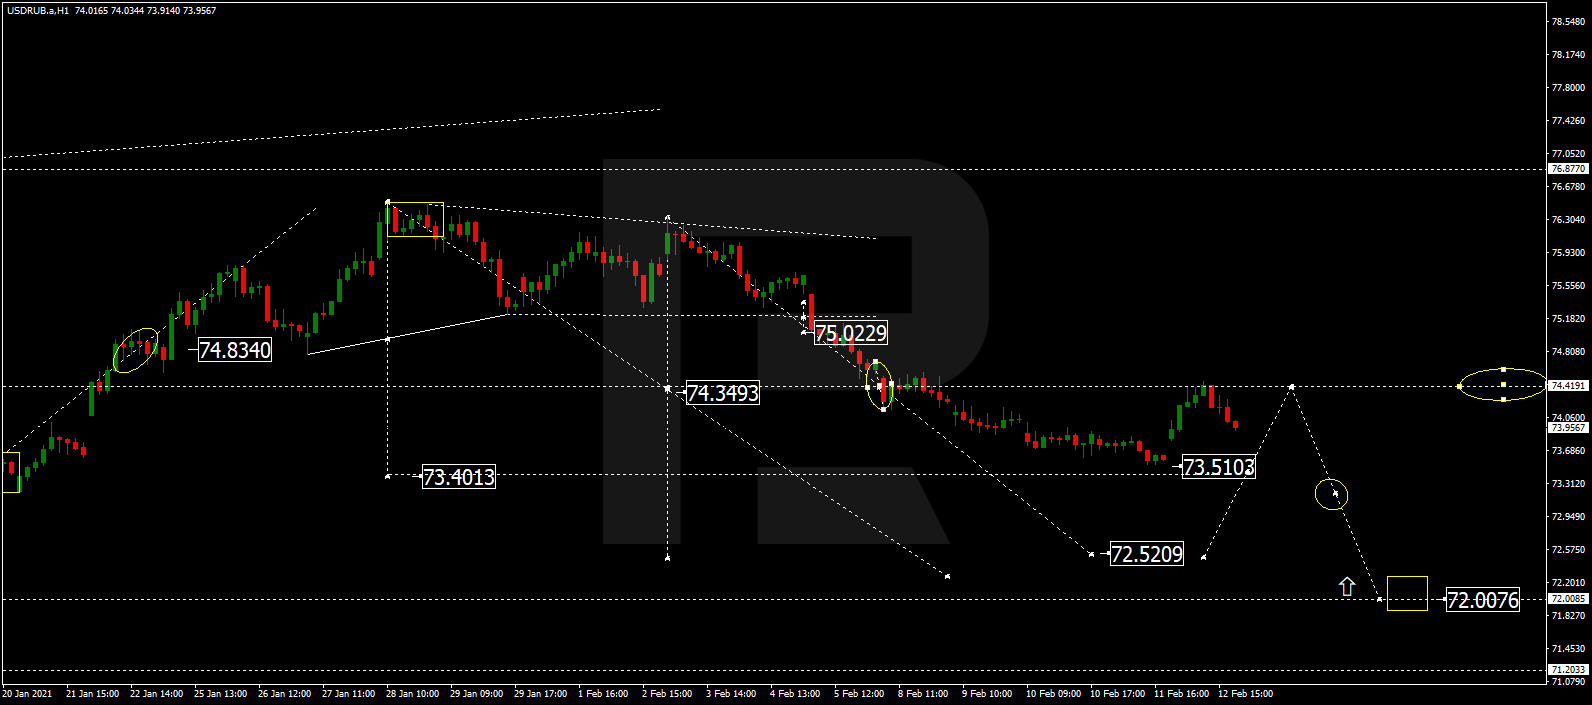
After finishing the correction at 74.4 and rebounding from this level to the downside, USDRUB is still falling towards 72.50. After that, the instrument may break this level and then continue trading downwards with the target at 72.00.

USDRUB
Risk Warning: the result of previous trading operations do not guarantee the same results in the future

USDJPY, “US Dollar vs Japanese Yen”

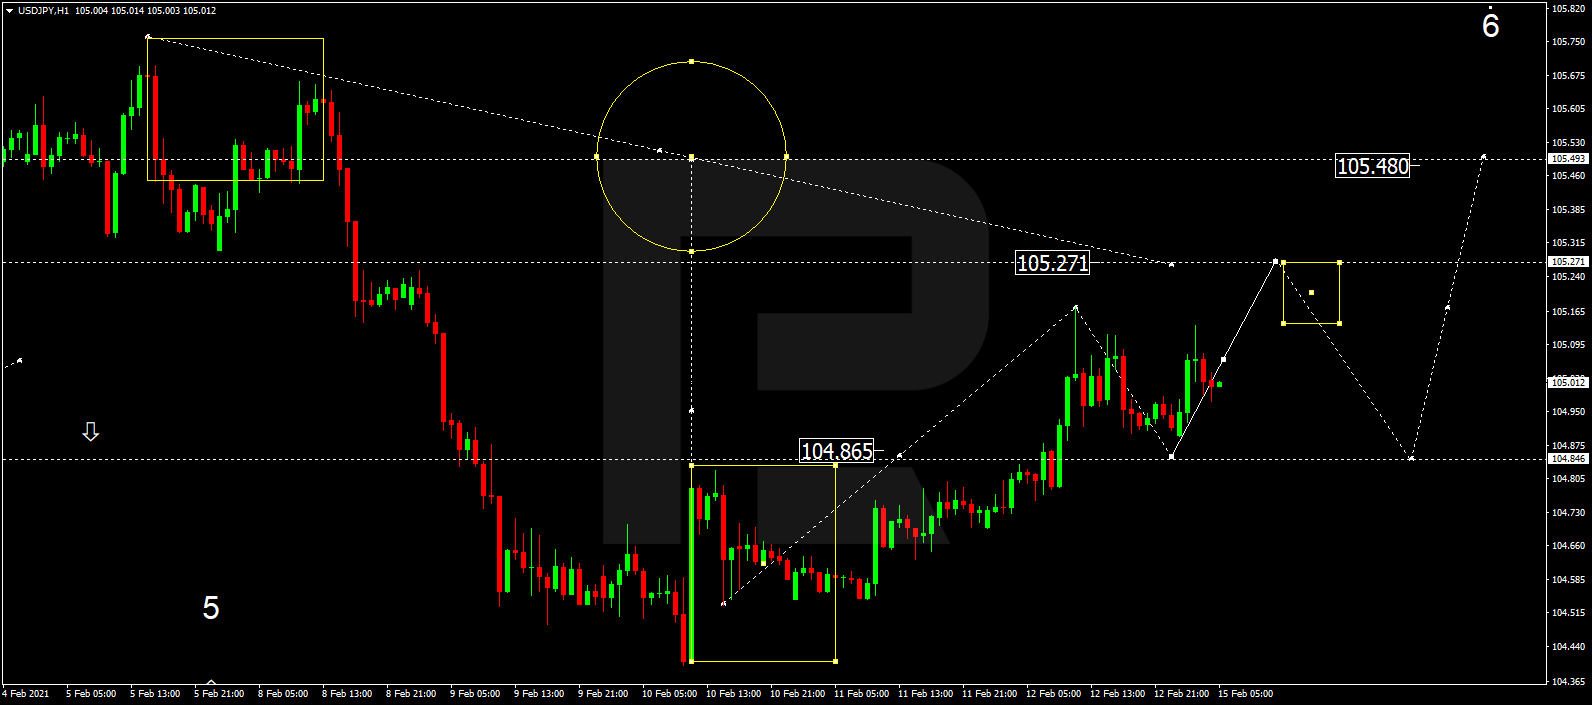
USDJPY is still consolidating above 104.84. Possibly, the pair may test this level from above and then resume growing to break 105.25. Later, the market may continue trading upwards with the target at 105.85.

USDJPY
Risk Warning: the result of previous trading operations do not guarantee the same results in the future

USDCHF, “US Dollar vs Swiss Franc”

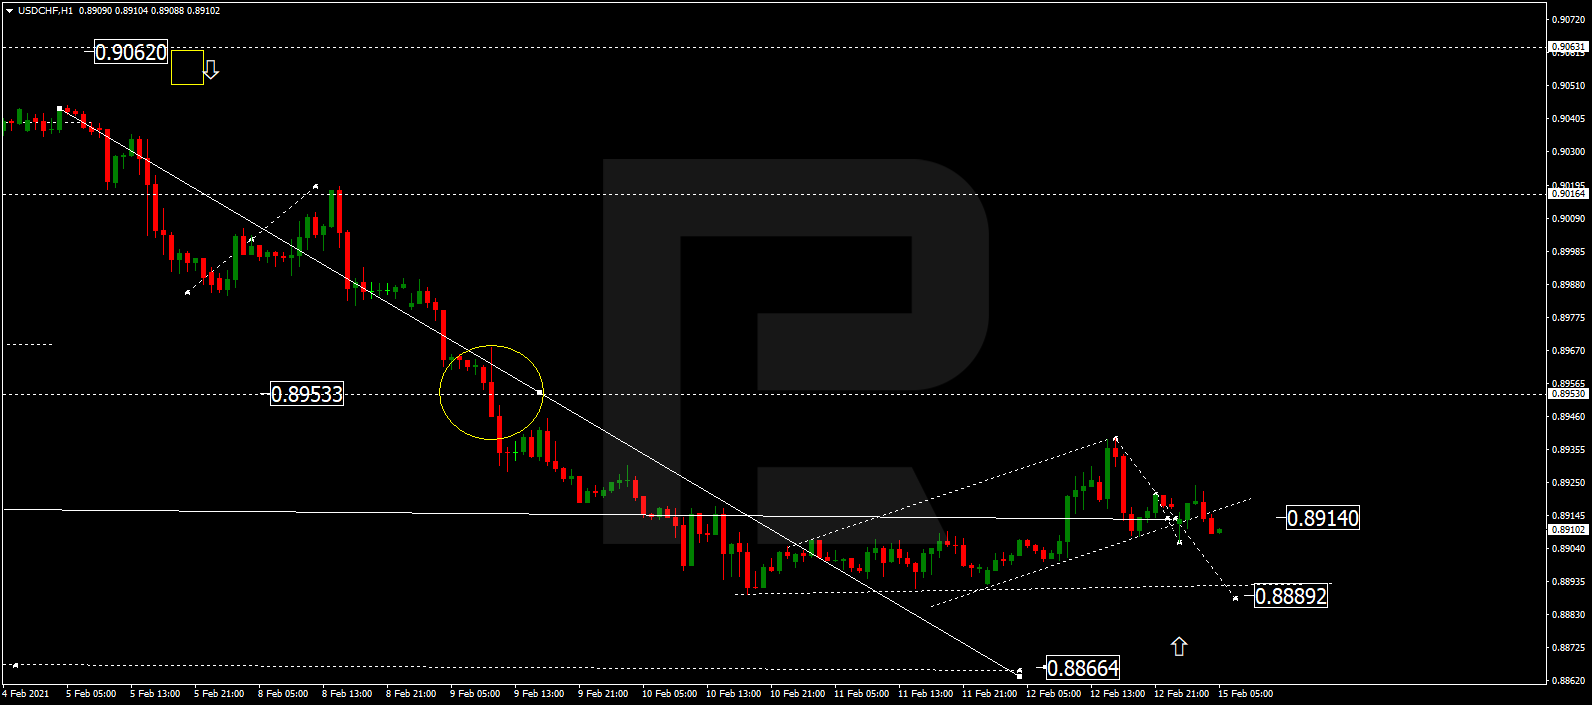
USDCHF is consolidating around 0.8914. If later the price breaks this range to the upside, the market may form one more ascending structure to reach 0.8955; if to the downside – resume trading downwards with the target at 0.8888.

USDCHF
Risk Warning: the result of previous trading operations do not guarantee the same results in the future

AUDUSD, “Australian Dollar vs US Dollar”

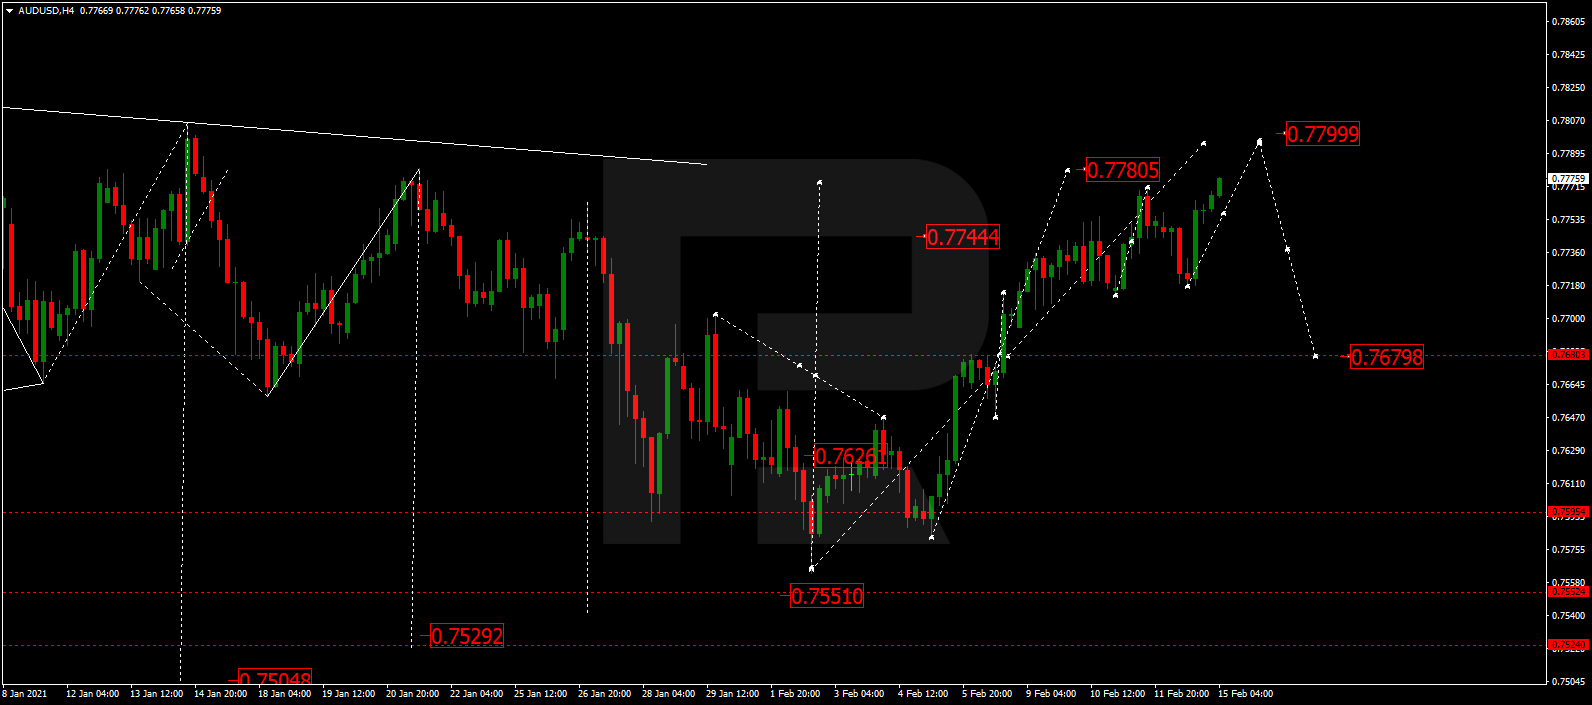
AUDUSD is growing towards 0.7799. Today, the pair may reach this level and then resume trading downwards with the target at 0.7679.

AUDUSD
Risk Warning: the result of previous trading operations do not guarantee the same results in the future

BRENT

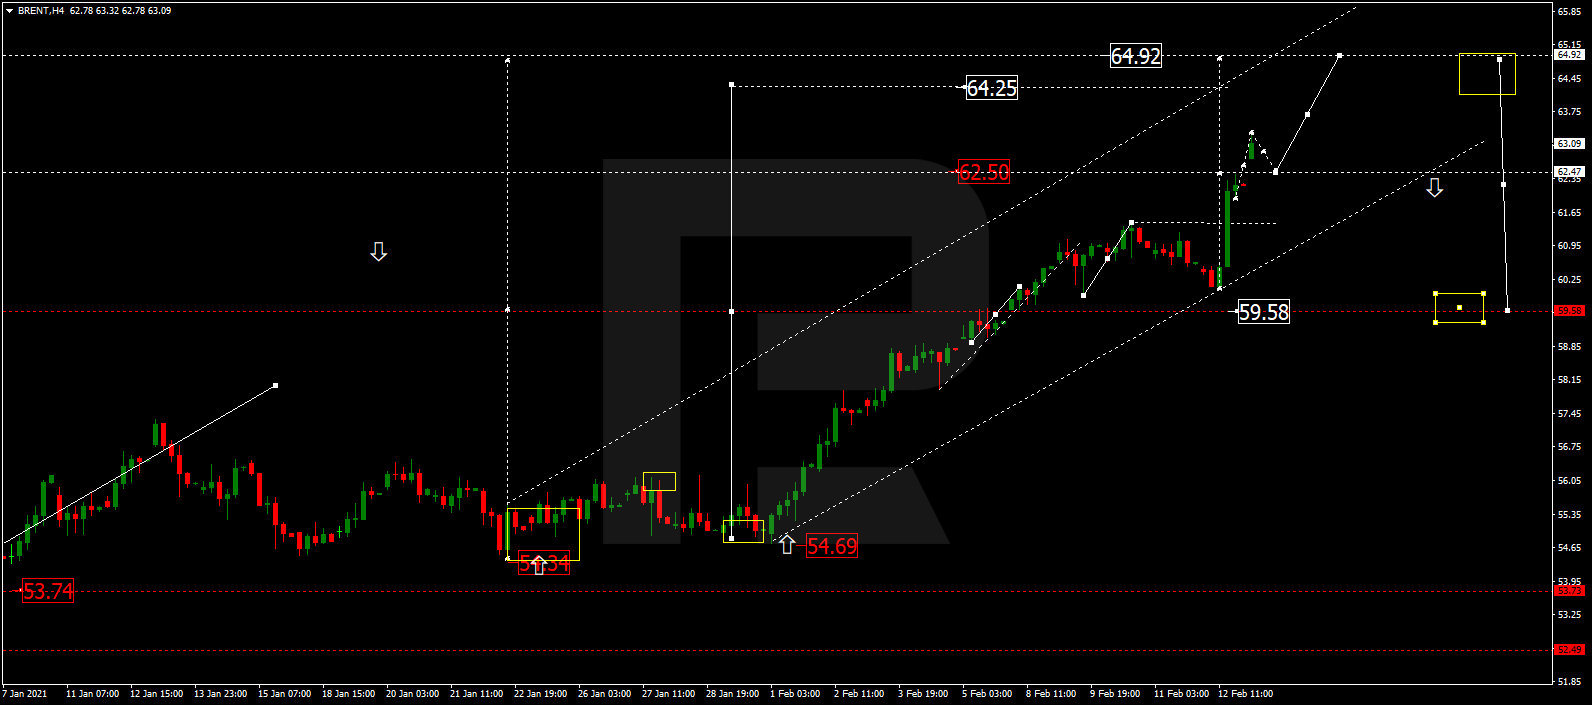
After completing the ascending structure at 62.50 and then breaking it to the upside, Brent is expected to continue growing towards 64.90. After that, the instrument may break start a new correction with the target at 59.59.

BRENT
Risk Warning: the result of previous trading operations do not guarantee the same results in the future

XAUUSD, “Gold vs US Dollar”

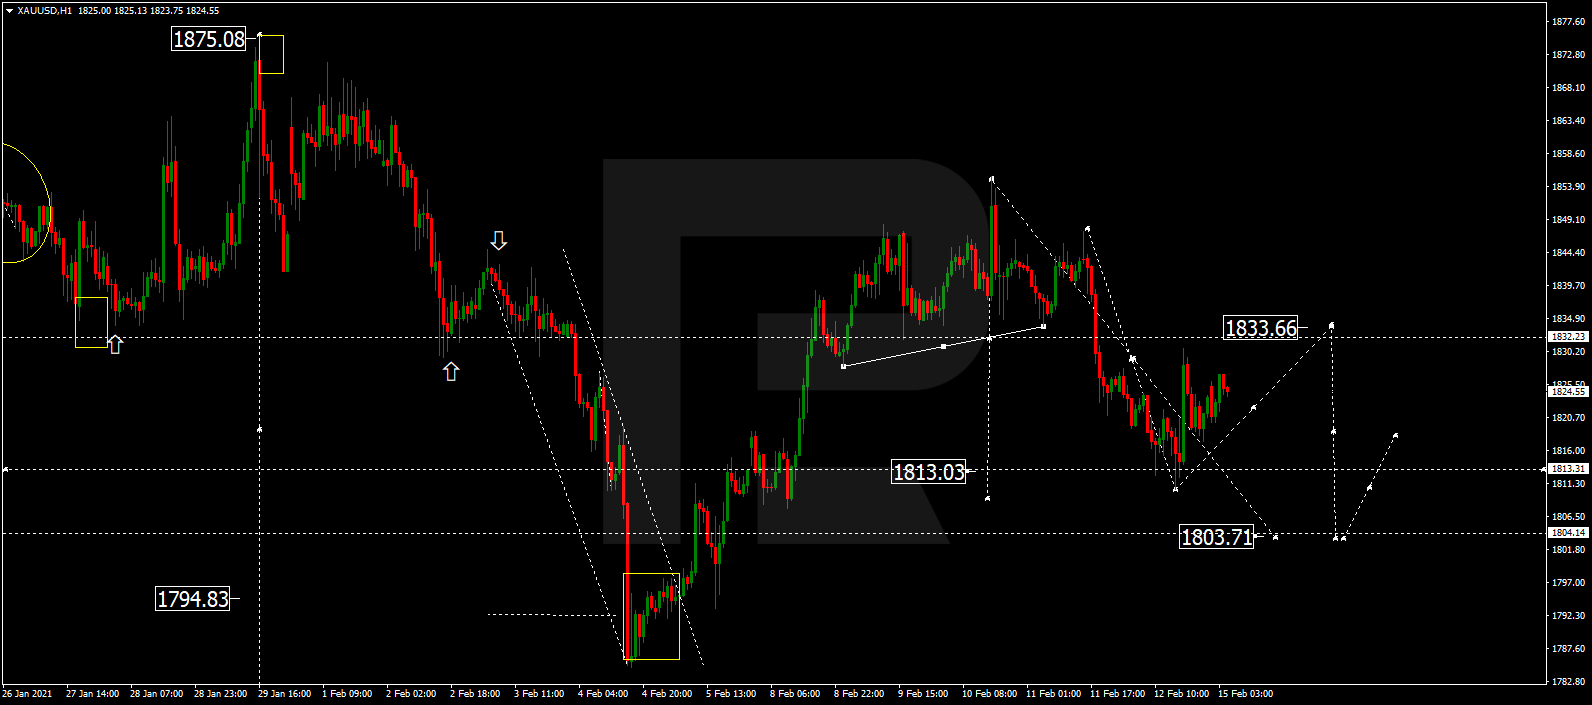
Gold has finished the descending wave at 1813.00. Today, the metal may start another growth to reach 1833.60 and then form a new descending structure with the target at 1803.70.

GOLD
Risk Warning: the result of previous trading operations do not guarantee the same results in the future

BTCUSD, “Bitcoin vs US Dollar”

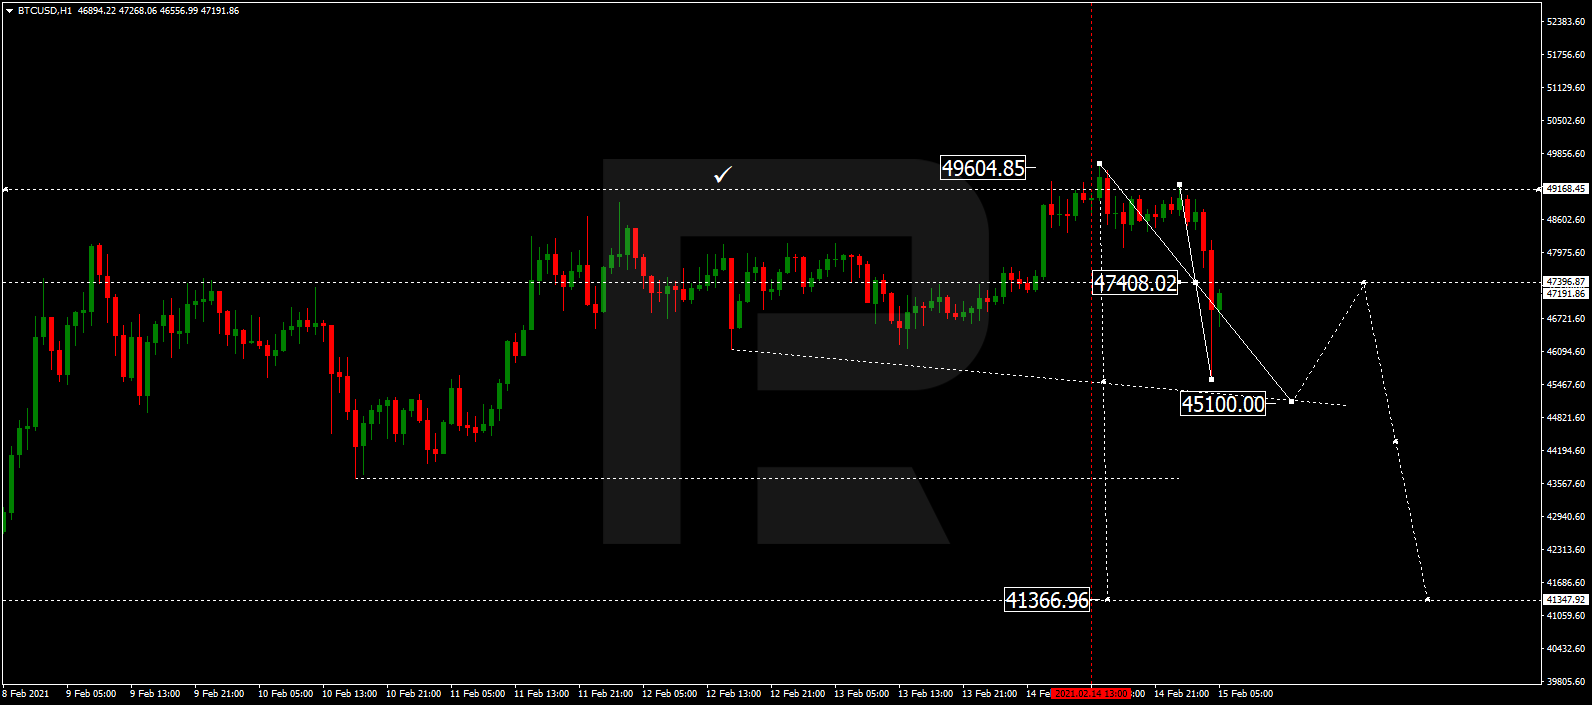
After completing another ascending wave at 49000.00, BTCUSD is forming a new descending structure towards 45100.00. After that, the instrument may correct to reach 47400.00 and then resume trading downwards with the short-term target at 41400.00.

BITCOIN
Risk Warning: the result of previous trading operations do not guarantee the same results in the future

S&P 500

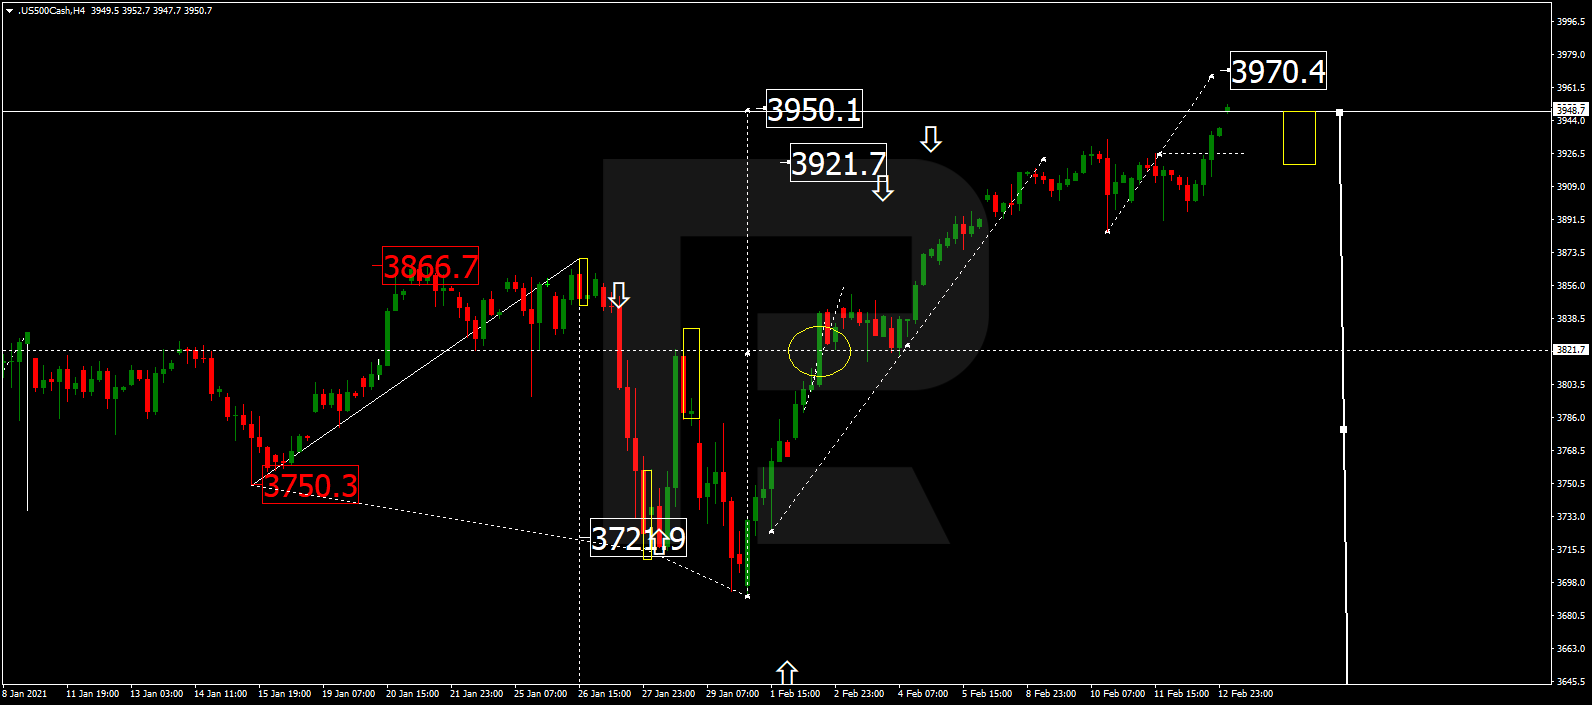
After finishing the ascending wave at 3950.2, the S&P index is expected to consolidate there. Later, the market may break the range to the downside and start a new decline with the target at 3700.0.

S&P 500

Article By RoboForex.com

Attention!
Forecasts presented in this section only reflect the author’s private opinion and should not be considered as guidance for trading. RoboForex LP bears no responsibility for trading results based on trading recommendations described in these analytical reviews.

Japanese Candlesticks Analysis 15.02.2021 (USDCAD, AUDUSD, USDCHF)

Article By RoboForex.com

USDCAD, “US Dollar vs Canadian Dollar”

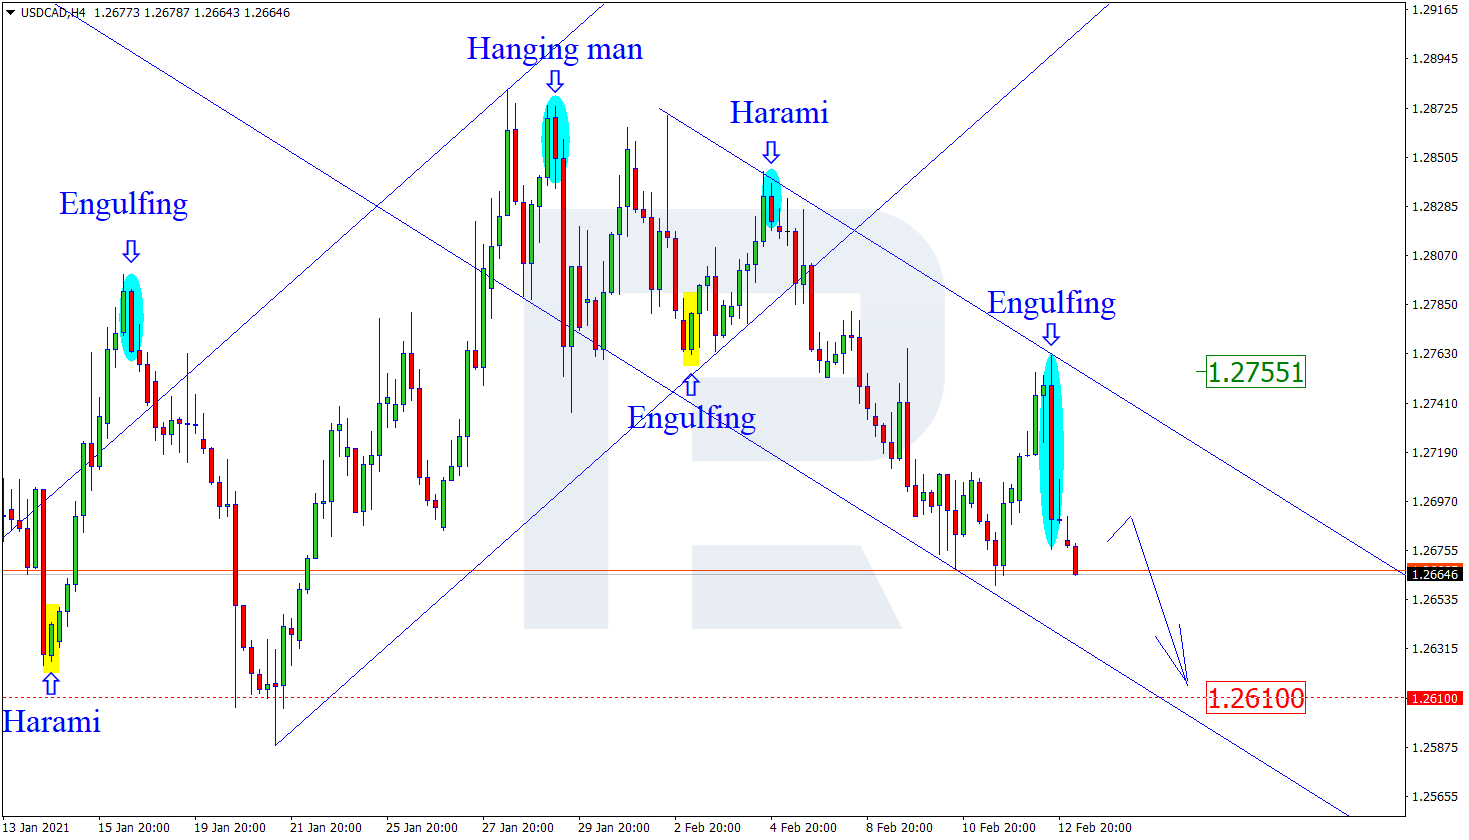
As we can see in the H4 chart, after forming an Engulfing reversal pattern not far from the resistance level, USDCAD is reversing and falling towards the support level. In this case, the downside target is at 1.2610. After that, the asset may continue forming the descending impulse. However, an alternative scenario implies a further pullback towards 1.2755 before the asset resumes the descending tendency.

USDCAD
Risk Warning: the result of previous trading operations do not guarantee the same results in the future

AUDUSD, “Australian Dollar vs US Dollar”

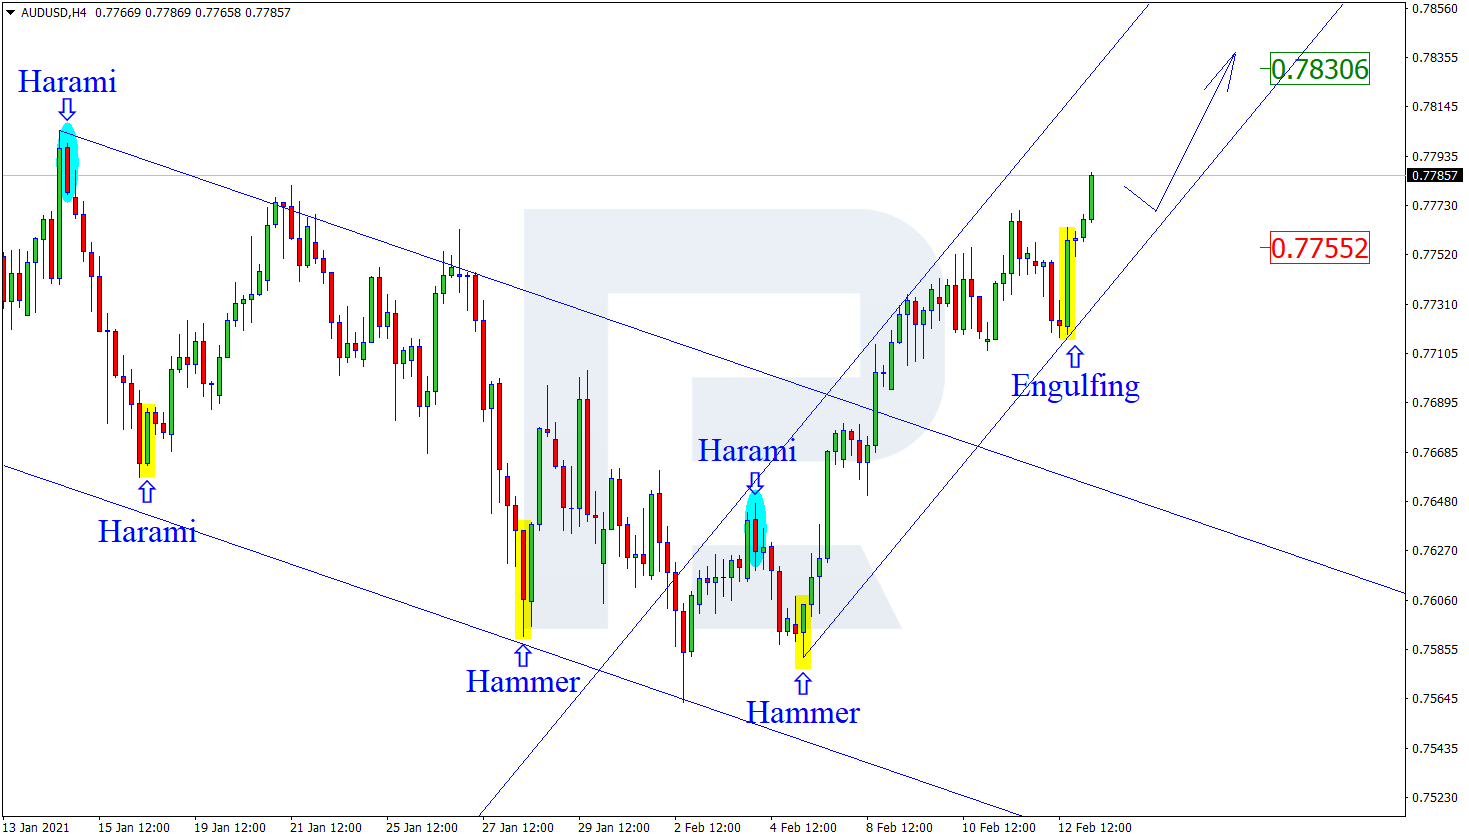
As we can see in the H4 chart, the uptrend continues. Right now, after forming several reversal patterns, such as Engulfing, not far from the support area, the pair may reverse and resume growing to reach the resistance level at 0.7830. At the same time, an opposite scenario says that the price may correct towards 0.7755 before resuming its growth.

AUDUSD
Risk Warning: the result of previous trading operations do not guarantee the same results in the future

USDCHF, “US Dollar vs Swiss Franc”

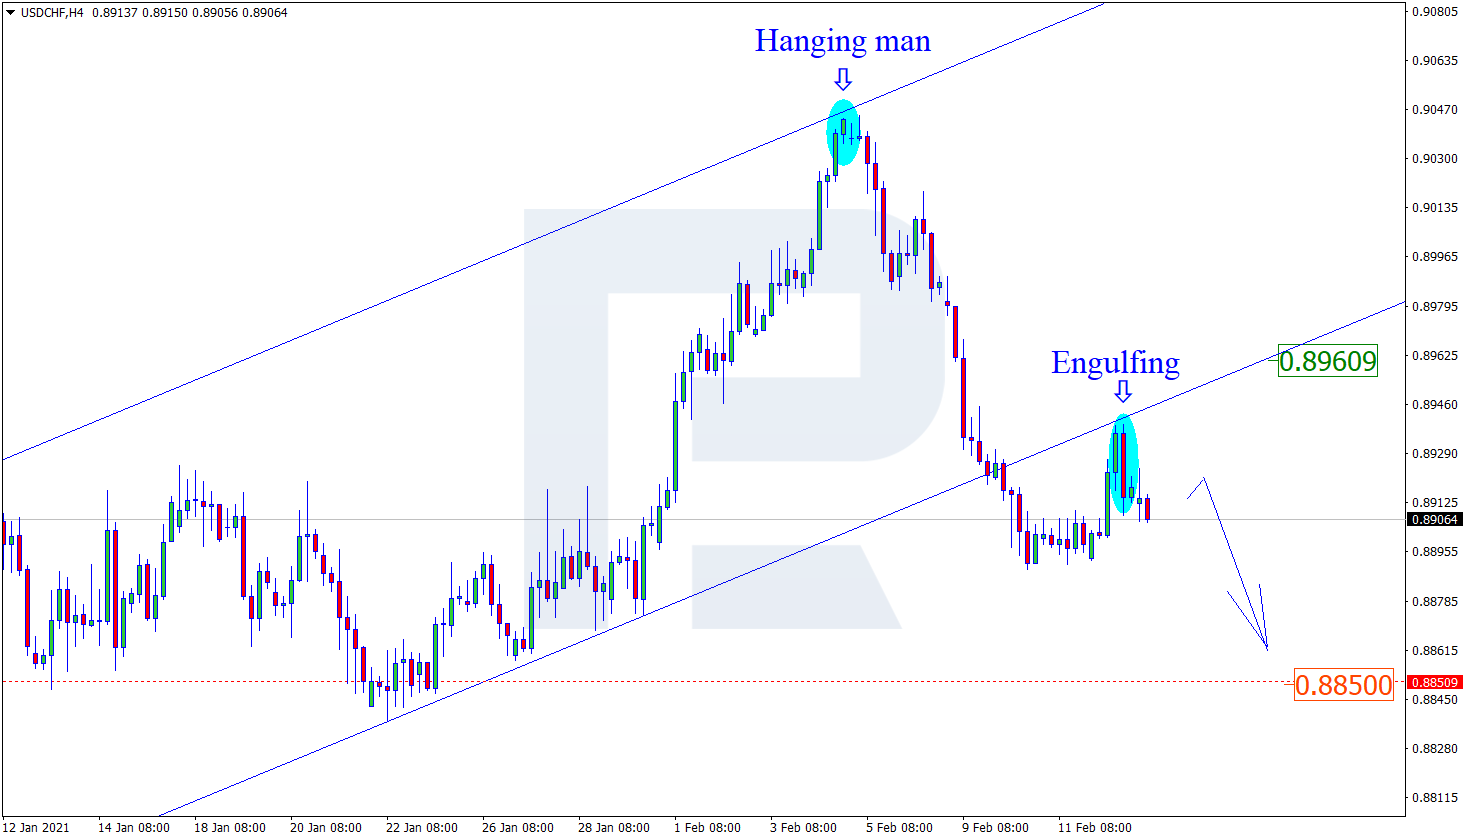
As we can see in the H4 chart, the downtrend continues. At the moment, after forming an Engulfing reversal pattern not far from the resistance area, USDCHF is reversing. The downside target is the support level at 0.8850. Still, there might be an alternative scenario, according to which the asset may return to 0.8960 before testing the support area.

USDCHF

Article By RoboForex.com

Attention!
Forecasts presented in this section only reflect the author’s private opinion and should not be considered as guidance for trading. RoboForex LP bears no responsibility for trading results based on trading recommendations described in these analytical reviews.

EURUSD Recovers From A Three-Day Low

By Orbex

eurusd

The euro currency touched a three-day low on Friday at 1.2080 before recovering. Price action is subdued for the past three sessions with a lower high currently forming.

This comes after price slipped to a three-month low at 1.1951 on February 5th. The downside bias is starting to build up.

The common currency will need to rise above the recent swing high of 1.2187 in order for the upside bias to hold.

Failure to do so could potentially open the way for further declines, especially if the swing low of 1.1951 gives way.

For the moment, the support area near 1.2050 will be critical to the downside. The Stochastics oscillator is moving up and could signal another test to the resistance area near 1.2144 – 1.2177.

By Orbex

Treasury yields and the stock market rose following oil prices

by JustForex

A sudden change in the weather in Texas was a surprise for traders. An arctic cyclone sweeping some areas of the US threatens to restrict supplies from one of the world’s leading oil producers. West Texas Intermediate crude oil futures increased by 2.5% and surpassed $60 a barrel for the first time since January last year. Meanwhile, Brent crude oil price rose to $64 in London. Traders estimate that production of several hundred thousand barrels per day in Texas could be affected by wells shutdown, disfunction of road transport, and electrical power outage to extreme weather conditions.

As a result of the jump in oil prices, US 10-year Treasuries yield rose to 1.21%. The stock market was next to react. The S&P 500 set a new all-time high at the level of 3947. The Stoxx 600 rose primarily on gains in banking and commodities stocks. The Nikkei 225 reached 30,000 for the first time since 1990. The latest statistics showed that Japan’s economic growth exceeded expectations.

An additional growth driver for risky assets is a decrease in the level of daily coronavirus infections. The rate of distribution in the US continues to slow down. The weekly national average fell to its lowest level in nearly four months. All of these factors bolster hopes for an early recovery from the pandemic.

Against this background, the dollar index continues to decline. The greenback, as a defensive asset, continues to be under pressure from rising stock prices, the commodity market, and negative statistics. The latest US consumer sentiment data has hit the dollar. Consumer sentiment in the US dropped unexpectedly to a six-month low at the beginning of February because of the decline in income and the development of inflation. The University of Michigan Sentiment Index fell to 76.2 from 79 in January. Consumers expect inflation to rise 3.3%, the highest since July 2014.

Main market quotes:

S&P 500 (F) 3,946.62 +15.62 (+0.40%)

Dow Jones 31,458.40 +27.70 (+0.09%)

DAX 14,103.15 +53.26 (+0.38%)

FTSE 100 6,664.16 +74.37 (+1.13%)

USD Index 90.323 -0.147 (-0.16%)

Important events:
  • – Japan GDP (q/q) (q4) at 01:50 (GMT+2).

by JustForex


This article reflects a personal opinion and should not be interpreted as an investment advice, and/or offer, and/or a persistent request for carrying out financial transactions, and/or a guarantee, and/or a forecast of future events.

The Week Ahead: Critical Support

By Orbex

USDJPY bounces as risk assets overheat

usdjpy

The greenback has come to the moment of truth, after rallying to a three-month high, will there be enough buyers to sustain the momentum? Lousy job market and near-zero inflation may continue to hammer the buck as the central bank is unlikely to shift from its dovish stance soon.

However, one should not disregard the power of buying the dip as the US dollar bounced back from last March’s low. Covering from a heavily loaded short side may have prompted traders to reassess the sentiment.

If the pair stays above 103.30, more buying interests could join in for a U-turn, if not, the latest rally could be a mere flag consolidation.

AUDNZD recovers on domestic resilience

The Australian dollar has recouped most of its losses against its neighbor despite the ongoing trade war between China and Australia. Investors seem to be unfazed by Beijing’s hefty tariffs and the fact that the country represents nearly 40% of Australia’s goods exports.

This would mean that their attention has shifted to Australia’s economic recovery. If the labor and inflation data continue to show resilience this week, the currency could see more upside.

The pair is heading towards the previous high of 1.0840 and a bullish breakout would resume the uptrend. Failing that 1.0540 is a key support level in case of a retracement.

CADJPY rise backed by oil rally

The loonie is grinding towards a twelve-month high as the rally in oil prices has provided the currency a strong tailwind. Canada’s weak jobs report earlier this month barely jittered the market.

It was a sign that the underlying momentum has remained robust, and it would take a lot of disappointment in the upcoming inflation figures to put a dent in the bullish sentiment, which seems unlikely according to the consensus.

The uptrend would be intact as long as price action stayed above the psychological level of 81.00. If the pair overcomes the intermediate hurdle of 83.00, the next target would be last February’s high of 84.60.

EURGBP slides to a 10-month low

The euro continues to lose ground to the pound much due to technical rather than fundamental selling. It is worthwhile to note that the UK and EU are still wrestling on trade relations, especially in regards to financial services equivalence, which accounts for 40% of service exports to the EU. Volatility is currently subdued as traders are yet to commit their chips, but news of Brexit 2.0 will surely make a comeback.

In the meantime, growth and inflation data from both sides may trigger some intraday whipsaws near April’s low of 0.8680. Should the support stand firm short coverings could help the pair rebound to 0.8900.
By Orbex

Brent crude passes $63 as risk-on sentiment soars

By Hussein Sayed Chief Market Strategist (Gulf & MENA), ForexTime

Oil prices kicked off the week on a strong footing, hitting a new 13-month high in early Asian trade. The robust recovery in oil prices and industrial metals over the past couple of months is driving the idea of a new commodities supercycle in which prices remain above-trend for many years to come.

At the time of writing, Brent Crude is trading at $63.70, a level last seen on January 22. Rising tensions in the Middle East is one of the justifications for the spike in prices as a Saudi-led coalition said it had intercepted an explosive-laden drone fired by Yemen’s Houthi rebels. However, these kinds of incidents normally have a short-lived impact on prices as risk premiums evaporate quickly.

The main factors contributing to the rally are an abating pandemic with vaccine rollouts allowing countries to gradually ease lockdowns, improving outlook for business activity, prospects of the $1.9 trillion US stimulus package and the disciplined supply curbs from OPEC+ members led by Saudi Arabia. US shale companies are very satisfied with current prices and may ramp up their production significantly in near future, but in the next few days freezing weather conditions will make it hard to do this, which means supply will be tight.

Unlike most other commodities, the supply side of the equation is pushing oil prices higher and from a technical perspective, crude is sitting at its most overbought price in more than two decades with the 14-day RSI near 84.

The tighter oil market conditions have led the Brent April future contract to trade at $4.30 premium to those of December delivery. This suggests global oil inventories will be depleted at a faster pace than anticipated by OPEC or the IEA. OPEC has proved many times in the past that it can put a floor on prices and once again it has succeeded with its new allies. Now the question is whether OPEC+ responds to the shifting dynamics by increasing output or continue to hold supply a little further before acting. The risks are that the oil market becomes even tighter and prices surge further, allowing US shale and non-OPEC producers to ramp up production and capture more of the market share.

Despite prices being in extremely overbought territory, we may see further strong gains if OPEC+ do not take action to raise output in the next few weeks. However, the higher prices go from here the steeper the correction could be. The last time the RSI traded near 80 was back in October 2018, in which prices fell from a high of $86.70 to $50, or a peak to trough move of over 41%.


Disclaimer: The content in this article comprises personal opinions and should not be construed as containing personal and/or other investment advice and/or an offer of and/or solicitation for any transactions in financial instruments and/or a guarantee and/or prediction of future performance. ForexTime (FXTM), its affiliates, agents, directors, officers or employees do not guarantee the accuracy, validity, timeliness or completeness, of any information or data made available and assume no liability as to any loss arising from any investment based on the same.


Forex-Time-LogoArticle by ForexTime

ForexTime Ltd (FXTM) is an award winning international online forex broker regulated by CySEC 185/12 www.forextime.com

The Analytical Overview of the Main Currency Pairs on 2021.02.15

by JustForex

The EUR/USD currency pair

Technical indicators of the currency pair:
  • Prev Open: 1.2129
  • Prev Close: 1.2119
  • % chg. over the last day: -0.08%.

The EUR/USD on Friday fell to the support level, but the disappointing data from the University of Michigan brought the pair back to weekly highs. Inflation expectations in the US are growing much faster, which puts pressure on the US dollar.

Trading recommendations
  • Support levels: 1.2081, 1.2059
  • Resistance levels: 1.2155, 1.2189

The main scenario for trading the EUR/USD is buying on a decline. The ADX has slightly reacted to the rise of the pair in the Asian session, but the oscillator is directed upwards. This indicates the likelihood of gradual growth. As long as the price is above the moving averages, long positions will be relevant.

Alternative scenario: if the price manages to consolidate below the level of 1.2118, the pair may return to the area of 1.2081  – 1.2059.

EUR/USD
There is no news feed for today.

The GBP/USD currency pair

Technical indicators of the currency pair:
  • Prev Open: 1.3812
  • Prev Close: 1.3847
  • % chg. over the last day: +0.25%

The sterling continues to set its annual highs, gradually moving towards the round 1.4000. The market continues to ignore the negative data in the UK, but growth is accelerating due to the decline in the dollar. As a result, the pound remains the leader in the foreign exchange market, showing the largest gains against the dollar.

Trading recommendations
  • Support levels: 1.3775, 1.3757
  • Resistance levels: 1.3900, 1.4000

The main scenario for trading the GBP/USD is buying on a decline. The decline on Friday was interrupted during the American session. At the end of the day, a bullish engulfing pattern was formed on the daily candlestick. This indicates strong upward momentum. But the ADX has already entered the short-term overbought area, which increases the likelihood of a pullback to the moving averages in the 1.3830 area.

Alternative scenario: if the pair consolidates below 1.3830, it may return to 1.3775.

GBP/USD
There is no news feed for today.

The USD/JPY currency pair

Technical indicators of the currency pair:
  • Prev Open: 104.72
  • Prev Close: 104.92
  • % chg. over the last day: +0.19%

The dollar-yen showed a slight increase on Friday. Despite the decline in the dollar index, the pair managed to close the day in positive territory amid rising bond yields and the stock market. The risky assets set a new record, which supported the growth of quotations.

Trading recommendations
  • Support levels: 104.40, 103.56
  • Resistance levels: 105.68, 106.12

The main scenario is trading in a sideways range between 104.95 – 104.40. Specifications have barely changed since Friday. There are slight signs of growth, but the move is likely to be slow. The ADX shows almost no reaction to price growth.

An alternative scenario assumes the price-fixing above 104.95. In this case, the pair may rise to 105.68. A breakеthrough of 104.40 could send the pair down to 103.56.

USD/JPY
There is no news feed for today.

The USD/CAD currency pair

Technical indicators of the currency pair:
  • Prev Open: 1.2700
  • Prev Close: 1.2686
  • % chg. over the last day: -0.11%

After a correctional pullback, the pair moved to a sharp decline. The oil market saw a surge in prices, as a result of which the black gold rose in price by about 2.5%. The Canadian dollar strengthened, and a bearish engulfing pattern was formed on the daily chart.

Trading recommendations
  • Support levels: 1.2666, 1.2590
  • Resistance levels: 1.2781, 1.2844

The main scenario is selling. The ADX and the MACD showed a significant reaction to the last wave of decline. Although the price has stopped near the 1.2666 support level, forming a local “double bottom” pattern, the probability of a breakdown and further decline remains.

Alternative scenario: if the price manages to gain a foothold above 1.2701, the pair may resume its growth to the resistance level of 1.2762.

USD/CAD
There is no news feed for today.

by JustForex


This article reflects a personal opinion and should not be interpreted as an investment advice, and/or offer, and/or a persistent request for carrying out financial transactions, and/or a guarantee, and/or a forecast of future events.

Oil Rally Continues

By Dmitriy Gurkovskiy, Chief Analyst at RoboForex

On Monday, February 15th, Brent is moving upwards after an unsuccessful correction. The asset is trading at $63.62, the highest level since January 23rd, 2020.

The key reason why investors continue buying oil is their assurance that the demand for energies will go up pretty soon. Also, they continue keeping a close eye on what is happening with the approval of the American stimulus plan and the news is making them quite happy so far. At the same time, market players pay no attention to the International Energy Agency and the OPEC forecasts of the demand for energies for this year and prefer to focus on positive aspects.

In the meantime, the International Energy Agency is sure that the oil supply is still going to be higher than the demand. The OPEC believes that the demand recovery in 2021 will be slower and reduces its expectations for the daily output by 110K down to 5.79 million barrels.

Sooner or later, investors will have to pay attention to the fundamental background, which is looking rather alarming. However, so far, the rally continues.

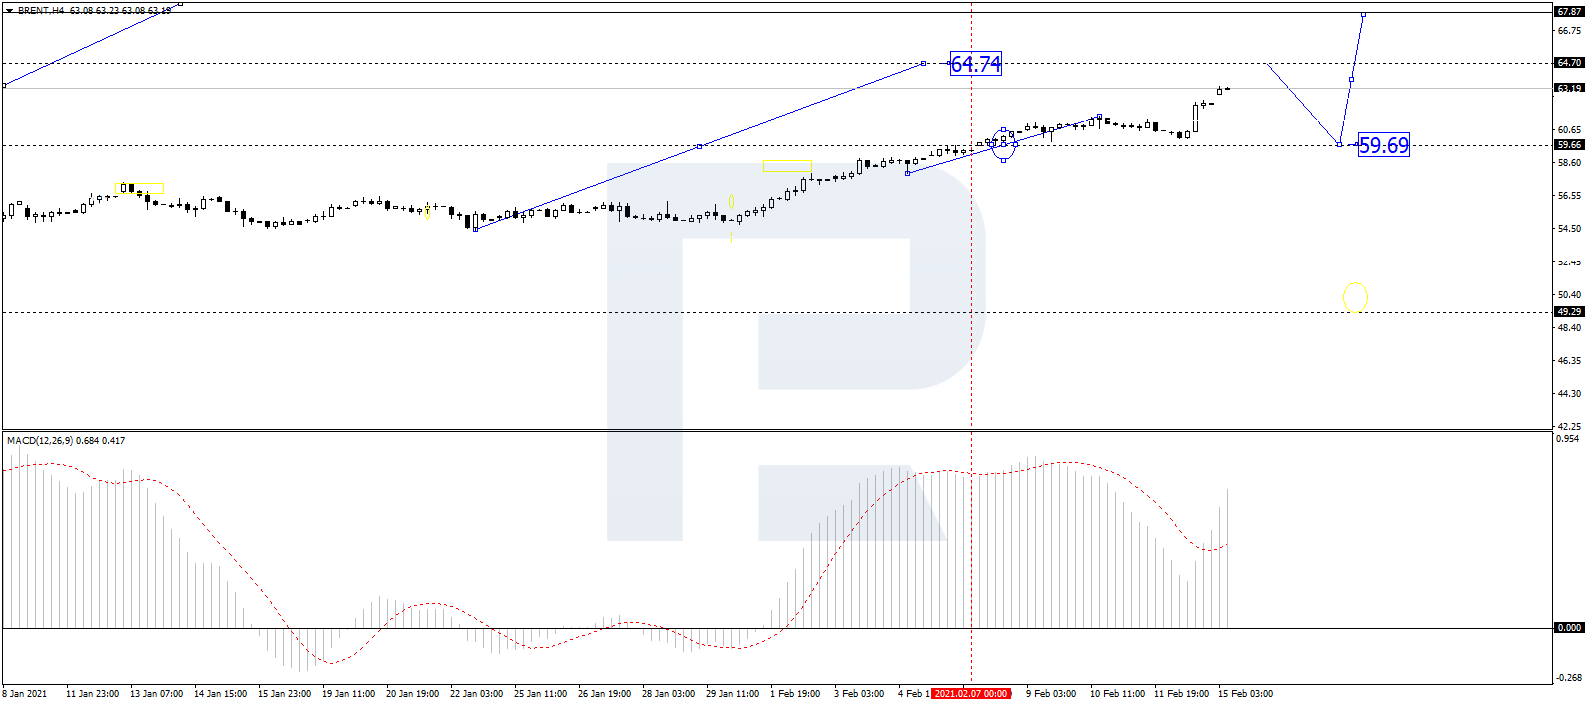
In the H4 chart, after reaching 62.50 and breaking this level to the upside, Brent is expected to continue moving upwards and reach 64.74. After that, the instrument may start another correction with the target at 59.69. From the technical point of view, this scenario is confirmed by MACD Oscillator: its signal line is steadily moving to the upside within the histogram area.

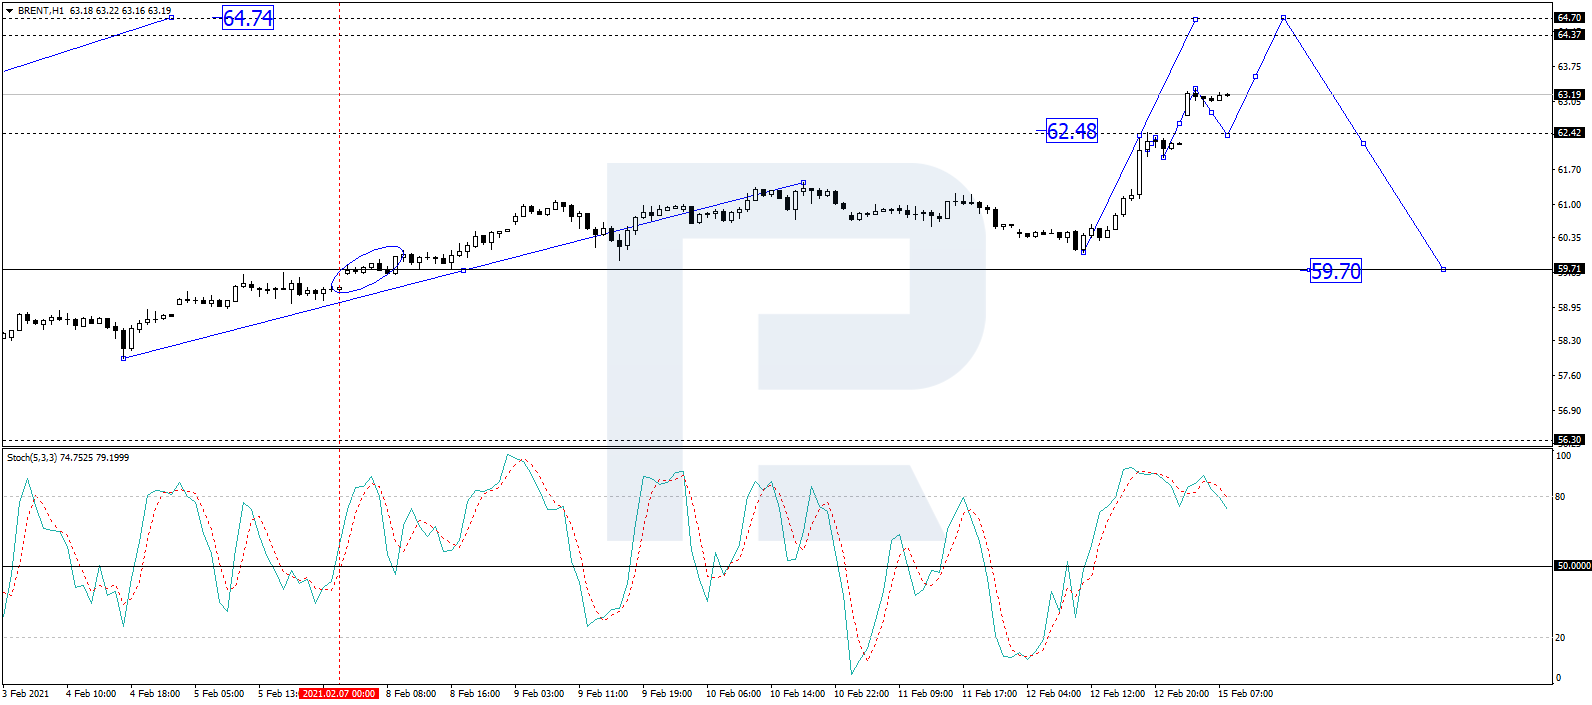
As we can see in the H1 chart, after completing the ascending wave at 62.50 and breaking it to the upside, Brent may test this level from above and then resume growing with the target at 64.74. From the technical point of view, this idea is confirmed by Stochastic Oscillator: its signal line is moving above 80, which means that the market is trading within the “overbought area” and may start a new descending correction towards 50. Later, the line may rise to return to 80.

Disclaimer

Any forecasts contained herein are based on the author’s particular opinion. This analysis may not be treated as trading advice. RoboForex bears no responsibility for trading results based on trading recommendations and reviews contained herein.

Key events this week: Risk sentiment to remain buoyed amid holiday-shortened week

By Han Tan Market Analyst, ForexTime

Last week, investors looked past the political drama surrounding former President Donald Trump’s second impeachment trial, sending global stocks to fresh record highs. US futures are currently pointing higher, which suggests more record highs for the likes of the S&P 500 and the Nasdaq 100 when US markets resume trading on Tuesday.

Such gains in risk assets could be helped along by these key events this week:

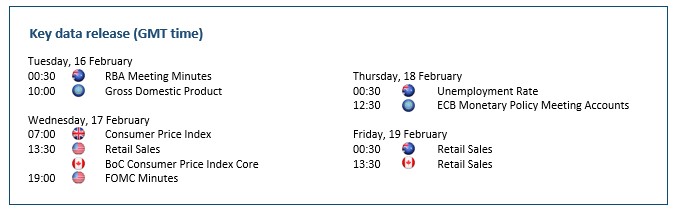
  • Monday, 15 February: US markets closed for Presidents’ Day; Euro-area industrial production
  • Tuesday, 16 February: Euro-area Q4 GDP; German ZEW survey expectations
  • Wednesday, 17 February: FOMC minutes; US retail sales and industrial production
  • Thursday, 18 February: GameStop saga hearing before House committee; ECB meeting minutes; Walmart Q4 earnings
  • Friday, 19 February: Markit PMIs for US, Euro-area, UK

Asian stocks return on risk-on note

The new trading week is already kicking off on a positive note for Asian markets, with the Nikkei 225 touching the psychologically-important 30,000 mark for the first time since 1990! Japan’s stock benchmark index has climbed about 8.8 percent already so far in 2021, which is line with the MSCI Asia Pacific Index’s 9 percent year-to-date gain.

There appears to be plenty of reasons to be positive over Japanese stocks over the near-term.

On Monday morning, it announced a better-than-expected Q4 GDP growth of 12.7 percent compared to the previous quarter. Although for the full-year, the economy contracted by 4.8 percent, that is still less than 2009’s 5.7 percent decline following the global financial crisis.

This is testament to the Japanese economy’s ability to recover, once virus-curbing measures are removed.

Japan has imposed a state of emergency on Tokyo and other big cities, which suggests another economic contraction for this quarter. However, with vaccination efforts set to begin starting this Wednesday, the world’s third largest economy could well rebound in the coming quarter, especially if it can demonstrate the same resilience that it had shown in the final quarter of 2020.

Post-Lunar New Year catch up?

Although Hong Kong and China’s stock markets will not reopen until later this week, they too could join the risk-on party, should this momentum hold over the coming days.

With the Hang Seng index having already broken out of its downtrend which began in early 2018, it is now coming up to a key resistance level around the 30,250 mark. This resistance region held fast in April 2019 and it remains to be seen whether the same pattern will play out once more over the near-term.

Disclaimer: The content in this article comprises personal opinions and should not be construed as containing personal and/or other investment advice and/or an offer of and/or solicitation for any transactions in financial instruments and/or a guarantee and/or prediction of future performance. ForexTime (FXTM), its affiliates, agents, directors, officers or employees do not guarantee the accuracy, validity, timeliness or completeness, of any information or data made available and assume no liability as to any loss arising from any investment based on the same.


Forex-Time-LogoArticle by ForexTime

ForexTime Ltd (FXTM) is an award winning international online forex broker regulated by CySEC 185/12 www.forextime.com

Vaccine Nationalism Is a Multilateral, Neocolonial Failure

By Dan Steinbock

– In the coming months, vaccine nationalism is likely to compound COVID-19 economic damage and penalize more lives. It reflects the utter failure of multilateralism. It is old colonialism in a new disguise.

After mid-January, WHO chief Dr Tedros warned that, due to unequal COVID-19 vaccine policies, “the world is on the brink of a catastrophic moral failure and the price of this failure will be paid with lives and livelihoods in the world’s poorest countries.”

And yet, in contrast, The Economist reported it was “Asian governments” that “are needlessly hampering vaccination drives,” due to their “nationalism and geopolitics.”

The simple reality is that by mid-January almost 40 million vaccine doses had been given in nearly 50 rich-income economies, whereas one poor nation had only 25 doses. As a result, 9 out of 10 people in poor countries are set to miss out on COVID-19 vaccine in 2021, according to Oxfam.

Exorbitant economic and human costs of unilateralism

Last year, the pandemic relief efforts soared to an estimated $20 trillion, according to Bank of America. That is likely to unleash a series of debt crises in the future.

Thanks to misguided COVID-19 unipolarity, particularly by the Trump administration, the outcome has been historical economic and human damage. Despite the worst recorded global contraction, more than 110 million pandemic cases and over 2.5 million deaths, more will follow.

What has dramatically compounded the pandemic crisis has been the failure of the major advanced economies to implement the WHO’s multilateral preparedness plan.

Before fall 2020, that plan represented barely 0.01% of the world’s cumulative output loss, as measured by the costs of the global contraction. By shunning multilateral cooperation, developed countries chose exorbitant costs that will penalize both them but particularly the poorest economies.

Usually, neocolonialism is defined as the use of economic, political, cultural, or other pressures to control or influence other countries, especially former dependencies. Vaccine nationalism is a case in point.

Recently, Philippine president Rodrigo Duterte accused the European Union (EU) of holding up supplies of COVID-19 vaccines: “This is a fight among the highest bidders, who can pay first.” Actually, he has a point. And it’s not just the EU that has been hoarding vaccines.

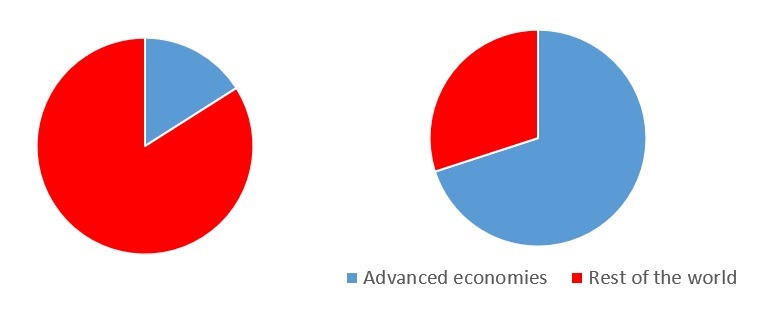
On the basis of public records, governments in high-income economies, representing barely 16% of the global population, have struck pre-orders covering at least 4·2 billion doses of COVID-19 vaccines. According to a just-released report by Lancet, these countries have secured at least 70% of doses available in 2021 of five leading vaccine candidates, on the basis of known deals (Figure).

High-income countries have bought most of COVID-19 vaccines for 2021


Major economies representing Have bought up to 70% of

less than 16% of world population COVID-19 vaccines
Source: Data from Lancet

Multilateralism is moral, safer and cheaper

By late November 2020, Canada and the US had already pre-ordered up 8-9 doses of vaccines per person. The UK, Australia and the EU followed in the footprints with 5-6 doses per person. That contributes to higher prices, which hurts all countries, but particularly the poorest ones.

What we need is multilateral cooperation across all differences. Here’s why: It is moral, safer, and cheaper.

Multilateral cooperation is moral. It’s the right thing to do. And it reduces the current gap between high-income economies’ rhetoric and the devastating realities in the poorer economies, which may have adverse political repercussions over time.

Multilateral cooperation is safer. During global pandemics, we are only as safe as our weakest links. Like its precursors from the Black Death to the Spanish Flu, COVID-19 is democratic. Ultimately, it will spare no one. However, if containment involves all nations, it will minimize cases, deaths, and potentially fatal mutations.

Multilateral cooperation is cheaper. Due to vaccine nationalism, vaccines are still distributed too slowly, remain in short supply and mainly reserved for high-income economies. Recent research suggests that up to 49% of the global economic costs of the pandemic in 2021 could be borne by the advanced economies, even if they achieve universal vaccination in their own countries.

Undermined living standards, and a lost decade

Unsurprisingly, the pandemic has drastically boosted inequality. If it is allowed to increase after the crisis, this will have a profound long-term impact on poverty levels, according to World Bank.

If all countries’ Gini indices increases by just two percentage points annually, the worst-case scenario would result in global growth contraction of 8%. That would mean that over 500 million more people would be living on less than $5.50 a day still in 2030 (compared with a scenario with no increase in inequality).

As a result, global poverty levels would soar higher than they were prior to the pandemic still in 2030.

Last August, I released a COVID-19 report that reflected similar outcomes: years of lost progress, undermined living standards in all economies, lost decades in poorest countries, increasing domestic divisions, and elevated famines and conflicts in failed states.

New variants, new long-term challenges

Thanks to the failure of multilateral cooperation, the number of COVID-19 cases and deaths is now far, far higher than initially anticipated. In turn, the greater spread of the global pandemic has ensured a greater number of mutations.

Most of these mutations tend to be benign, but huge numbers contribute to rising probability of adverse outcomes. In recent months, new variants of the original virus have been spotted in different countries – UK, Brazil, South Africa, US – and seem to cause major changes in the way the pathogen acts, including its contagiousness.

Scientists in the U.K. had been watching the B.1.1.7 variant for some time before announcing in December that it might be at least 50% more transmissible than the original form. Moreover, scientists are concerned about another mutation in South Africa in which a genetic change may help the virus evade the immune system and vaccines. Similar concerns involve new variants in Brazil and the US.

The longer the crisis lingers, the greater remains the probability for potentially malignant outcomes.

With more than a hundred million infected people (and the real number may be substantially higher) creating antibodies against the virus, still other versions are likelier to emerge that could evade the immune system, reinfect even recovered persons and then become more widespread in a population.

That would represent still another outcome of the failure of multilateralism.

About the Author:

Dr. Dan Steinbock is an internationally recognized strategist of the multipolar world and the founder of Difference Group. He has served at the India, China and America Institute (USA), Shanghai Institutes for International Studies (China) and the EU Center (Singapore). For more, see https://www.differencegroup.net