
By Dmitriy Gurkovskiy, Chief Analyst at RoboForex
On Monday, February 15th, Brent is moving upwards after an unsuccessful correction. The asset is trading at $63.62, the highest level since January 23rd, 2020.
The key reason why investors continue buying oil is their assurance that the demand for energies will go up pretty soon. Also, they continue keeping a close eye on what is happening with the approval of the American stimulus plan and the news is making them quite happy so far. At the same time, market players pay no attention to the International Energy Agency and the OPEC forecasts of the demand for energies for this year and prefer to focus on positive aspects.
In the meantime, the International Energy Agency is sure that the oil supply is still going to be higher than the demand. The OPEC believes that the demand recovery in 2021 will be slower and reduces its expectations for the daily output by 110K down to 5.79 million barrels.
Sooner or later, investors will have to pay attention to the fundamental background, which is looking rather alarming. However, so far, the rally continues.
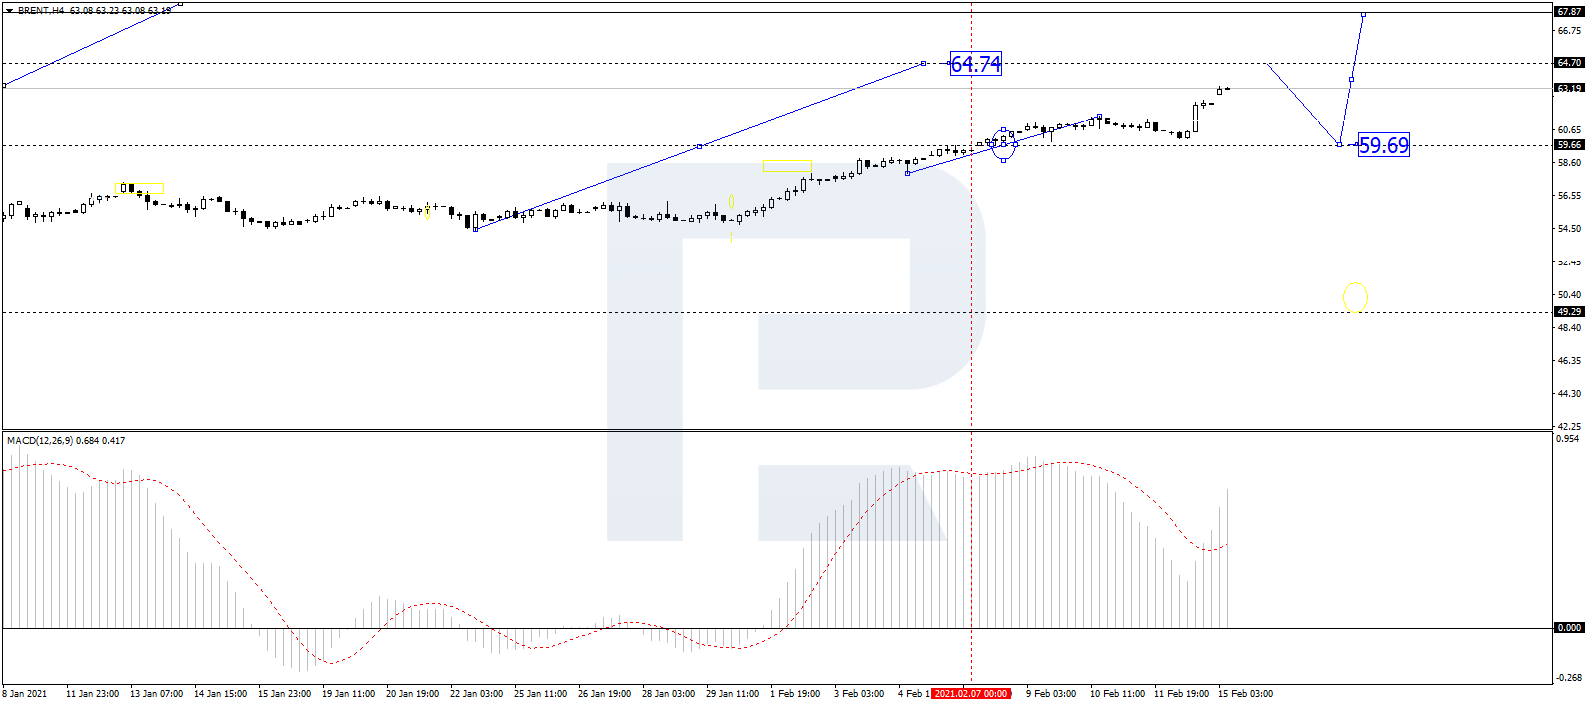
In the H4 chart, after reaching 62.50 and breaking this level to the upside, Brent is expected to continue moving upwards and reach 64.74. After that, the instrument may start another correction with the target at 59.69. From the technical point of view, this scenario is confirmed by MACD Oscillator: its signal line is steadily moving to the upside within the histogram area.
Free Reports:
 Get our Weekly Commitment of Traders Reports - See where the biggest traders (Hedge Funds and Commercial Hedgers) are positioned in the futures markets on a weekly basis.
 Sign Up for Our Stock Market Newsletter – Get updated on News, Charts & Rankings of Public Companies when you join our Stocks Newsletter
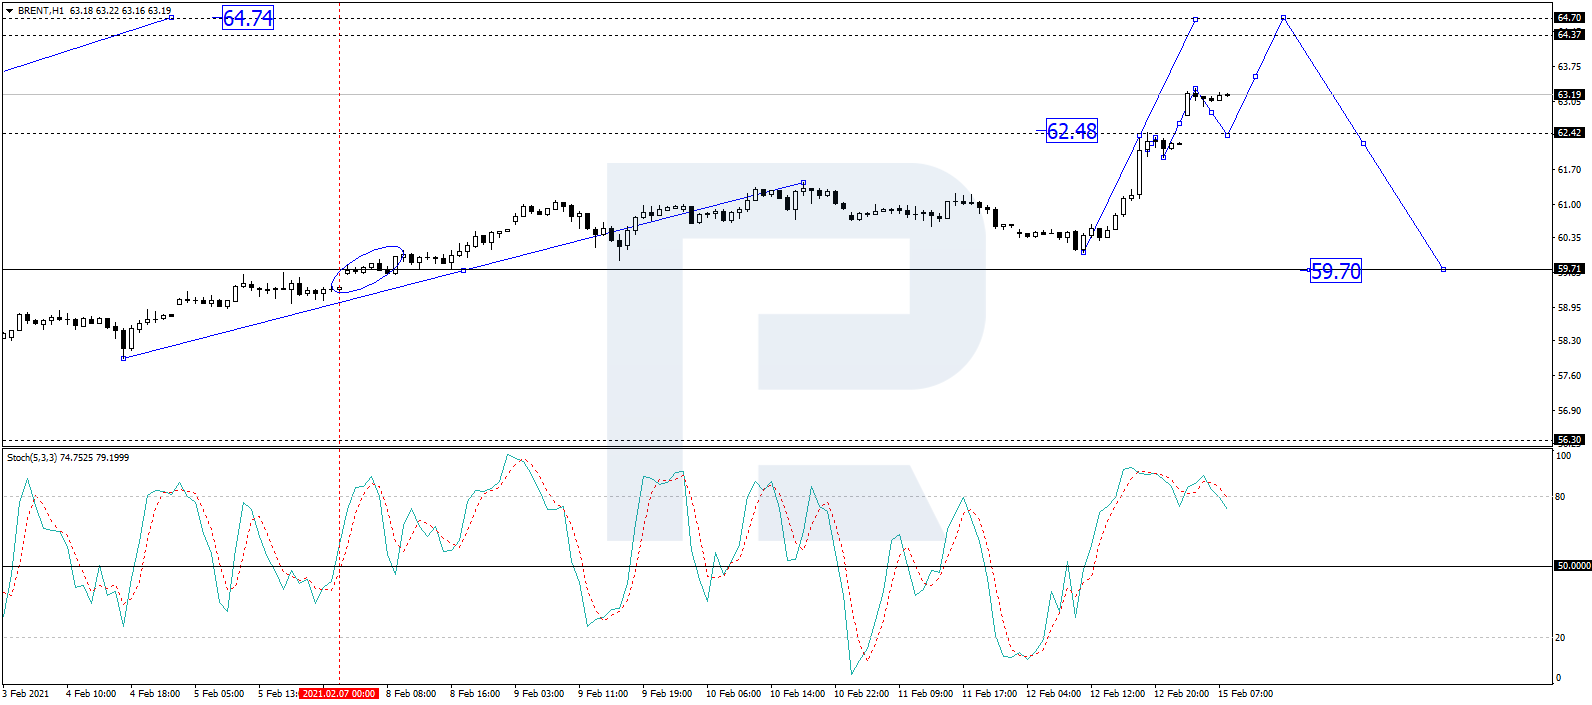
As we can see in the H1 chart, after completing the ascending wave at 62.50 and breaking it to the upside, Brent may test this level from above and then resume growing with the target at 64.74. From the technical point of view, this idea is confirmed by Stochastic Oscillator: its signal line is moving above 80, which means that the market is trading within the “overbought area” and may start a new descending correction towards 50. Later, the line may rise to return to 80.
Disclaimer
Any forecasts contained herein are based on the author’s particular opinion. This analysis may not be treated as trading advice. RoboForex bears no responsibility for trading results based on trading recommendations and reviews contained herein.

- Australian trade balance returned to positive territory Aug 6, 2026
- Results in Line for Most Reporting Companies Aug 5, 2026
- Stock indices continue to break records. Oil is falling amid intensified diplomatic dialogue between the US and Iran Aug 5, 2026
- USD/JPY Holds Steady After Intervention: Outlook Remains Uncertain Aug 5, 2026
- EUR/USD: Busy Week Ahead Aug 3, 2026
- Positive sentiment in the AI sector supported stock indices. Oil prices remain volatile Aug 3, 2026
- The Tech‑heavy NASDAQ Index jumped by more than 3.3%. The offshore yuan is trading at its highest level since 2023 Jul 31, 2026
- USD/JPY After Volatility: Multiple Events in One Day Jul 31, 2026
- The US indices sell off amid renewed US-Iran clashes. Oil jumps by 7% Jul 30, 2026
- USD/JPY Temporary in Equilibrium: Multiple Factors in Focus Jul 30, 2026
