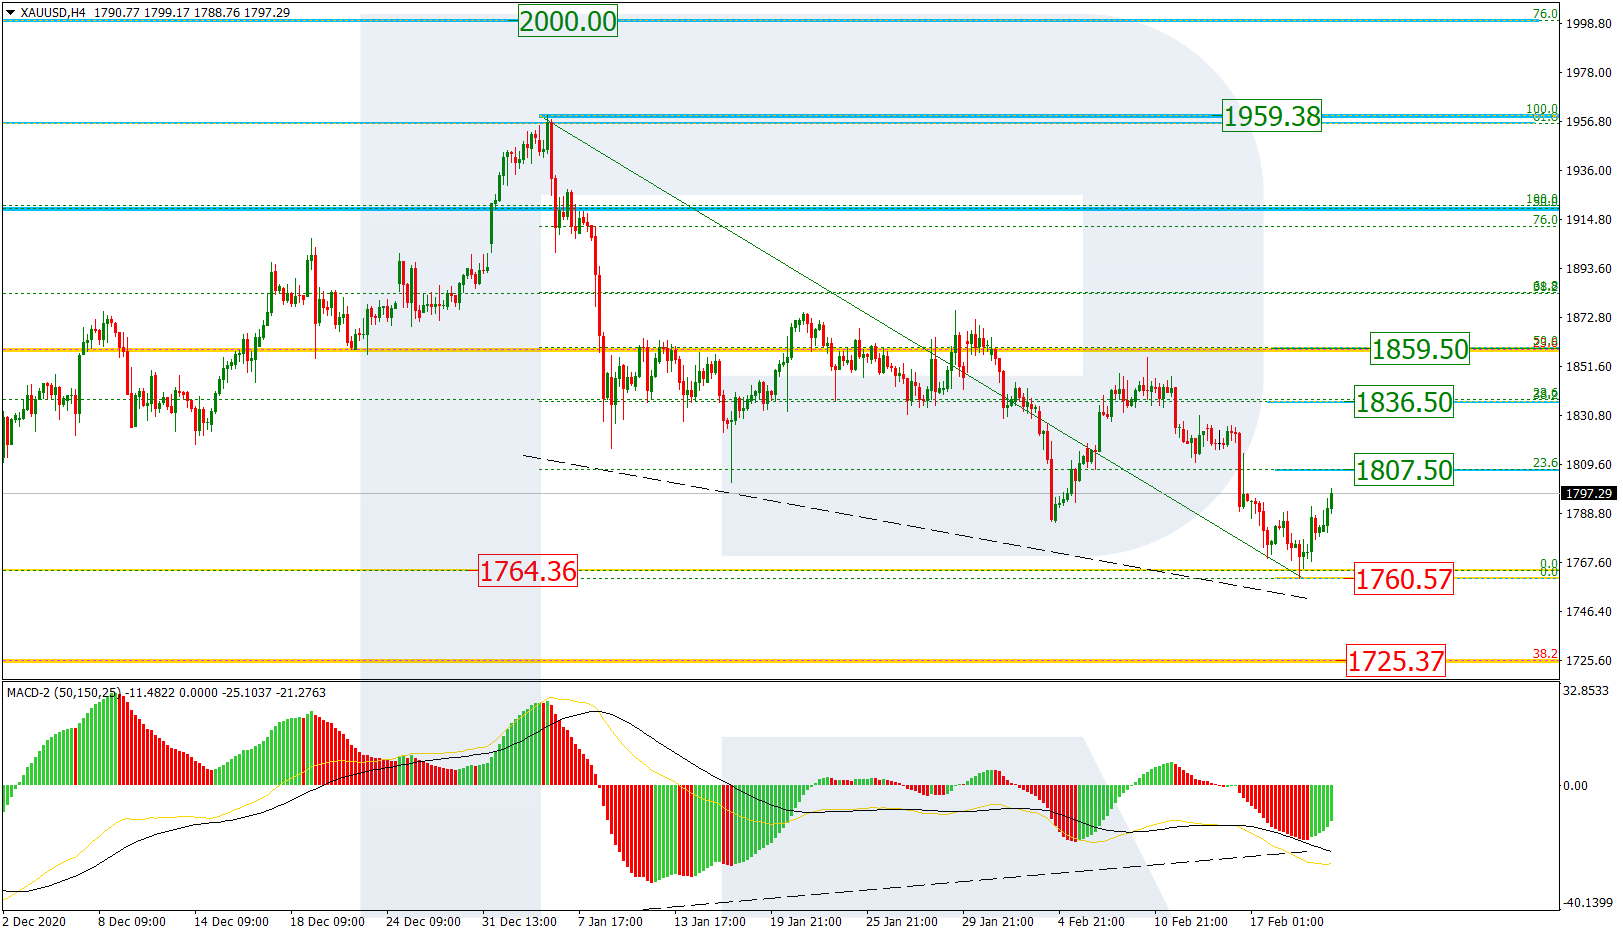
On H4, the wave of decline reached the low of 1764.36 and found its end in a convergence. This might mean the beginning of correctional growth with the aims at 23.6% (1807.50), 38.2% (1836.50), and 50.0% (1859.50) Fibo. In the case the local low of 1760.57 is broken away, the quotations might go on declining towards the long-term level of 38.2% (1725.37).
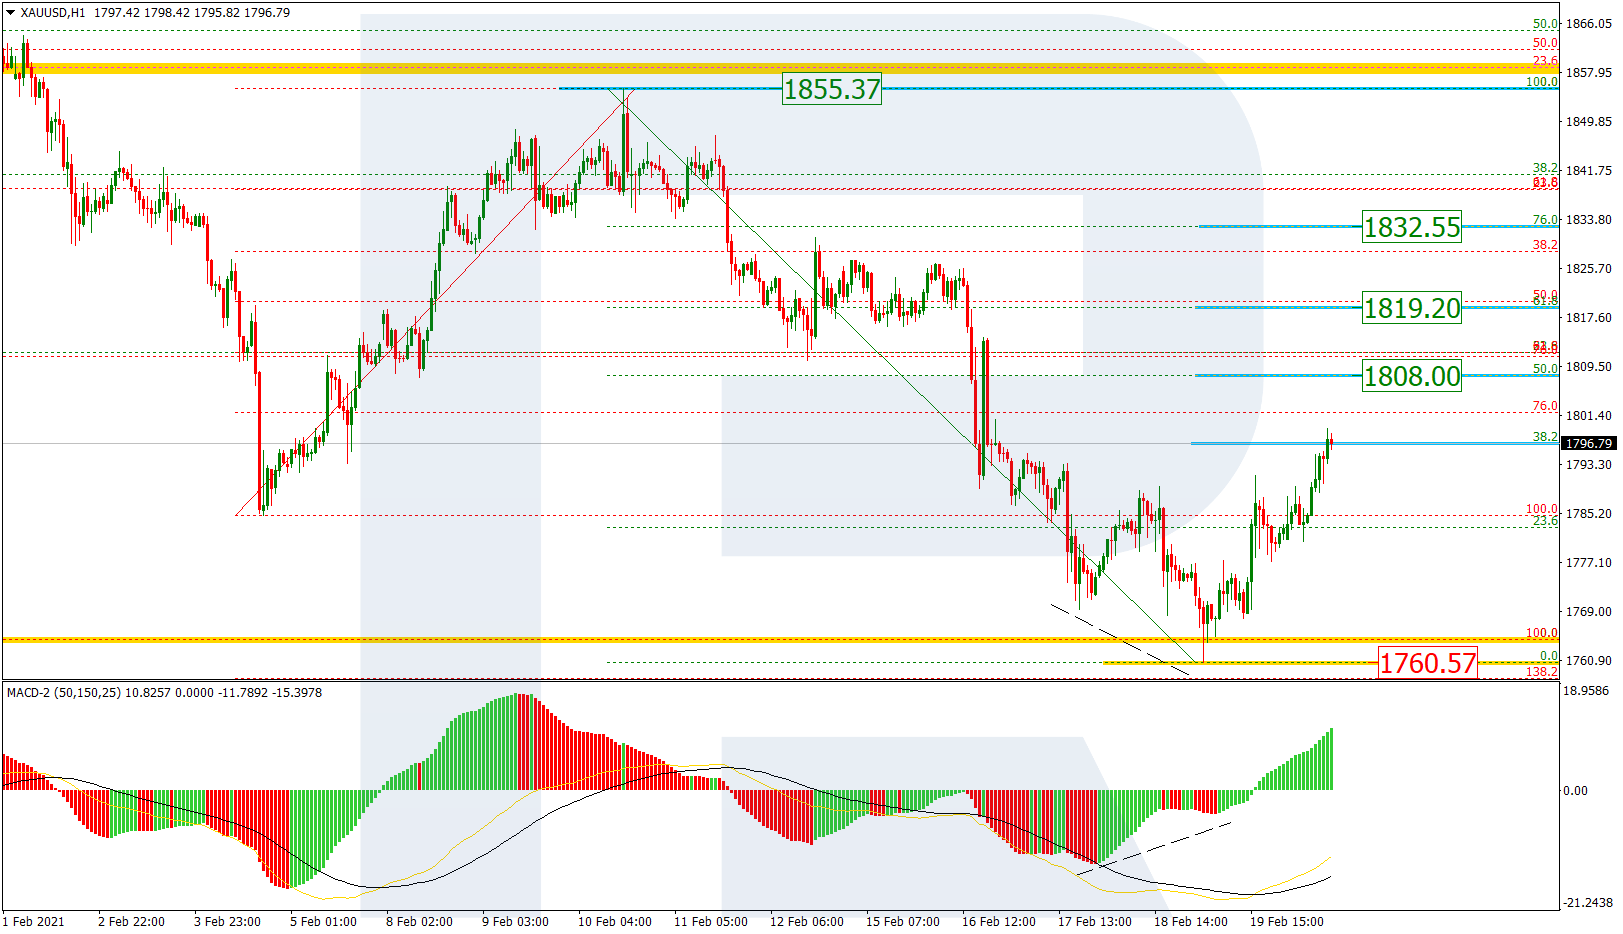
On H1, there is a wave of growth, correcting the latest wave of decline. By now, the quotations have risen to 38.2% but might go even higher — to 50.0% (1808.00), 61.8% (1819.20), and 76.0% (1832.55) Fibo. The main goal of the growth might be the local fractal of 1855.57.
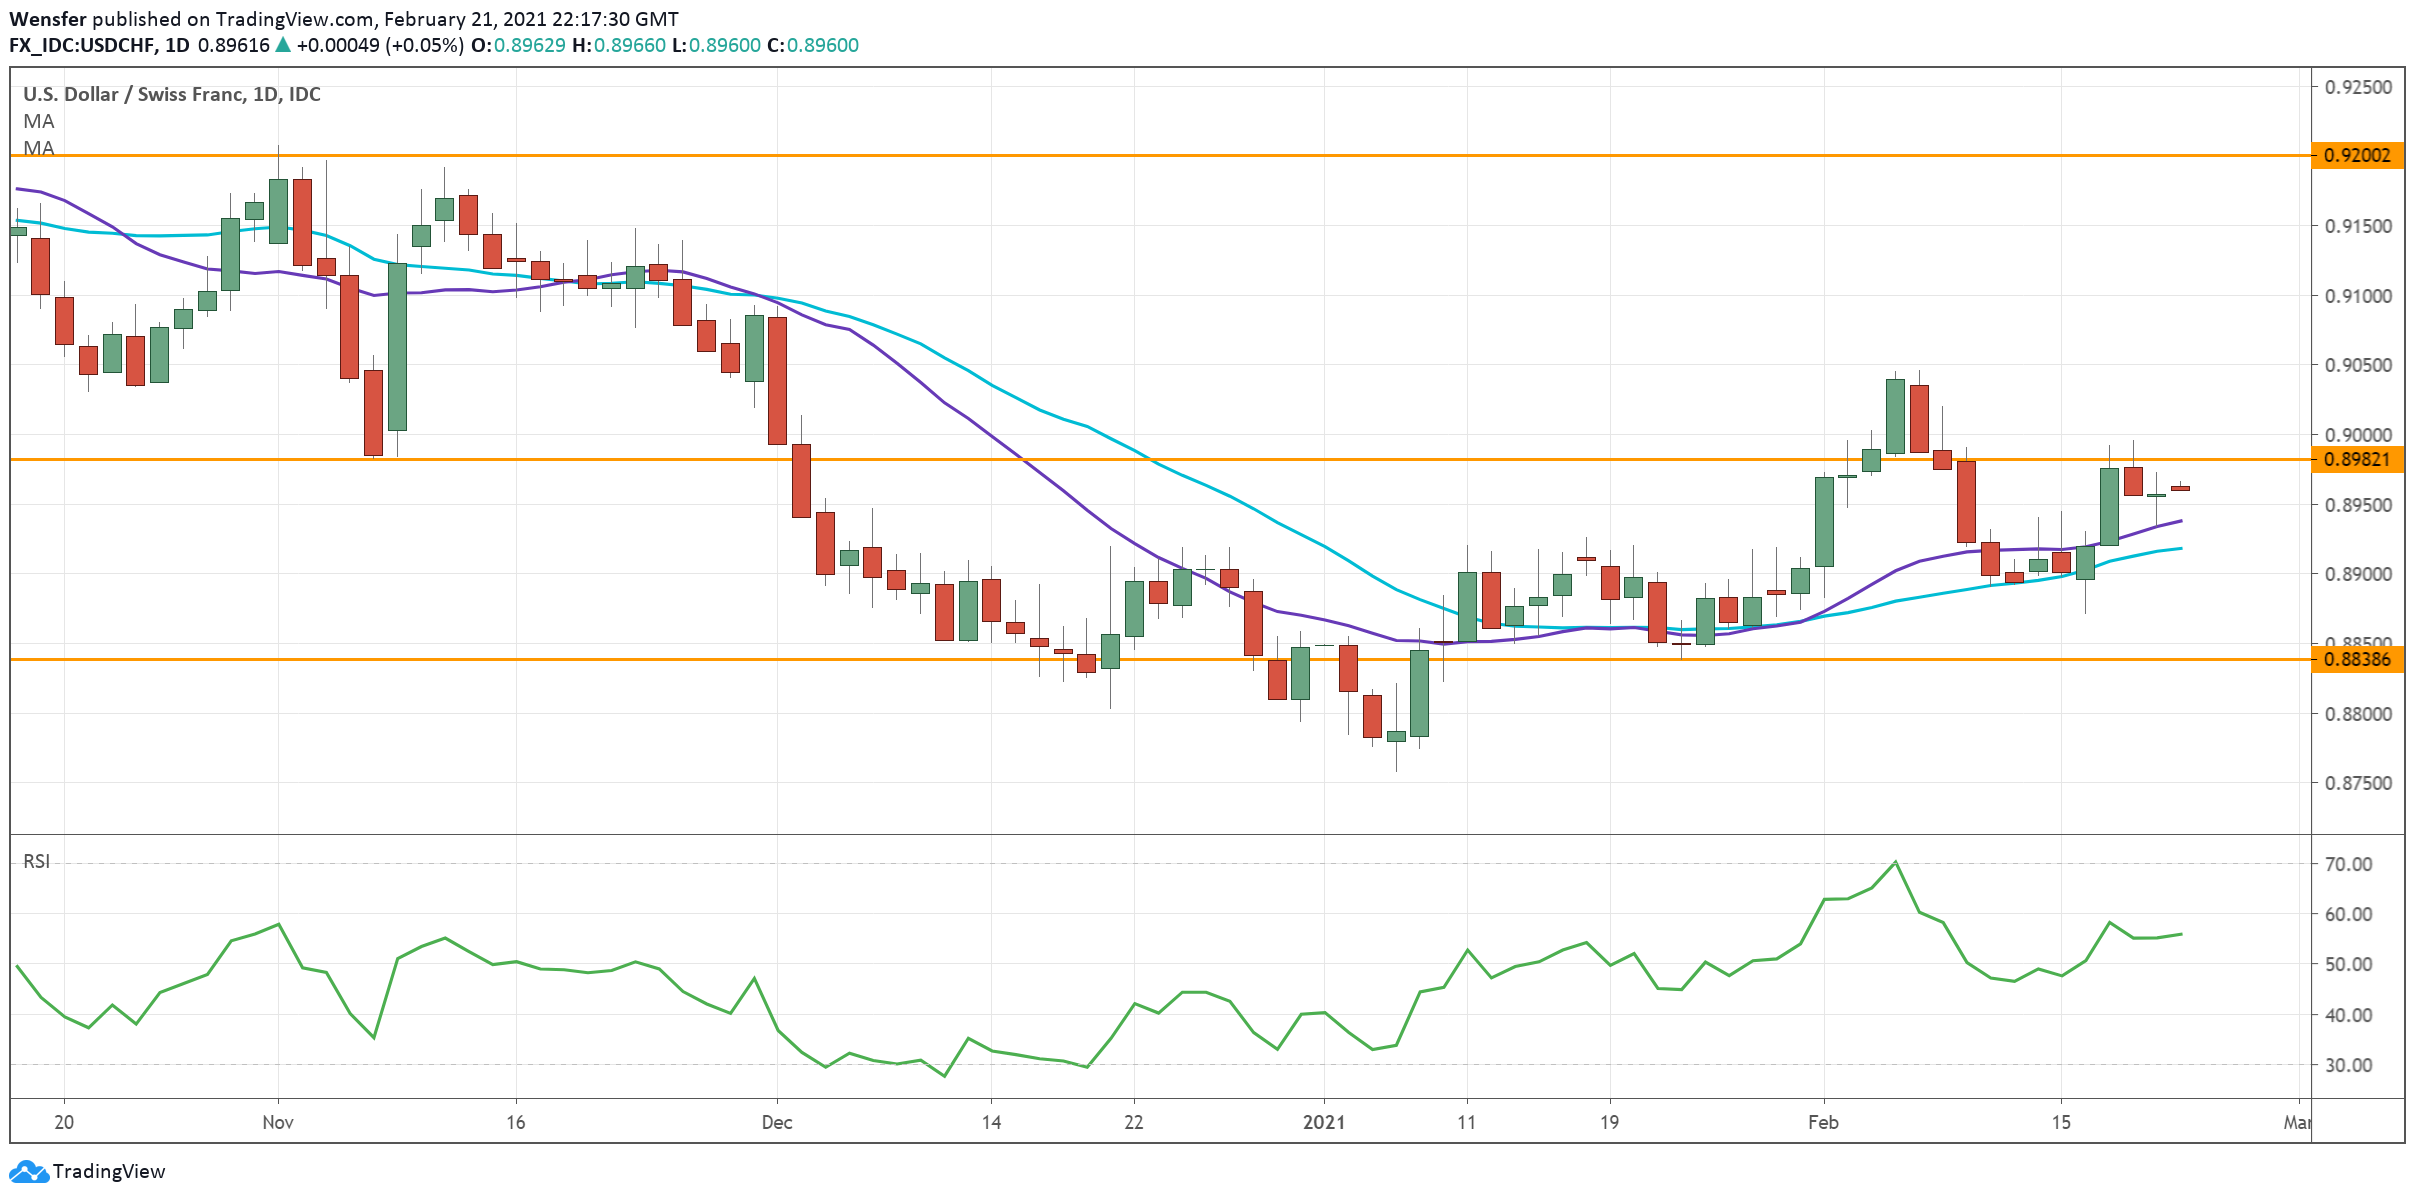
USDCHF, “US Dollar vs Swiss Franc”
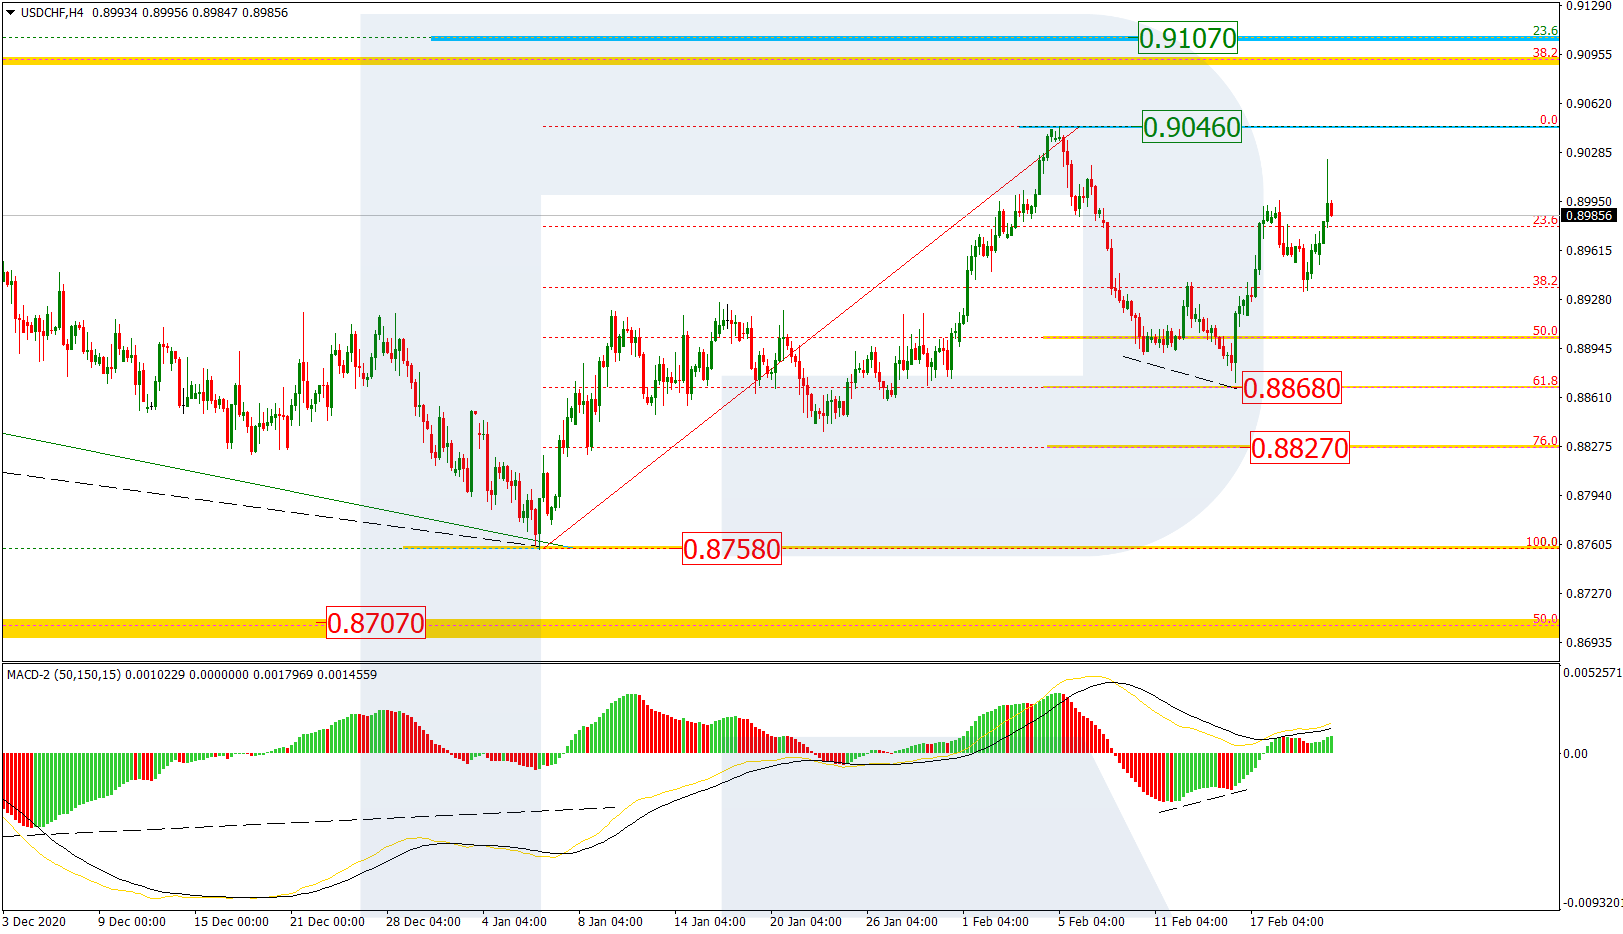
On H4, the pair performed a correctional decline to 61.8% Fibo (0.8868) and formed a new impulse of growth. It is aimed at at the current high of 0.9046; after it is broken away, the quotations might rise to the long-term correctional level of 23.6% (0.9107). However, a bounce off the high is neither excluded. It might lead to another wave of decline to 76.0% (0.8827). The support is at the low of 0.8758.
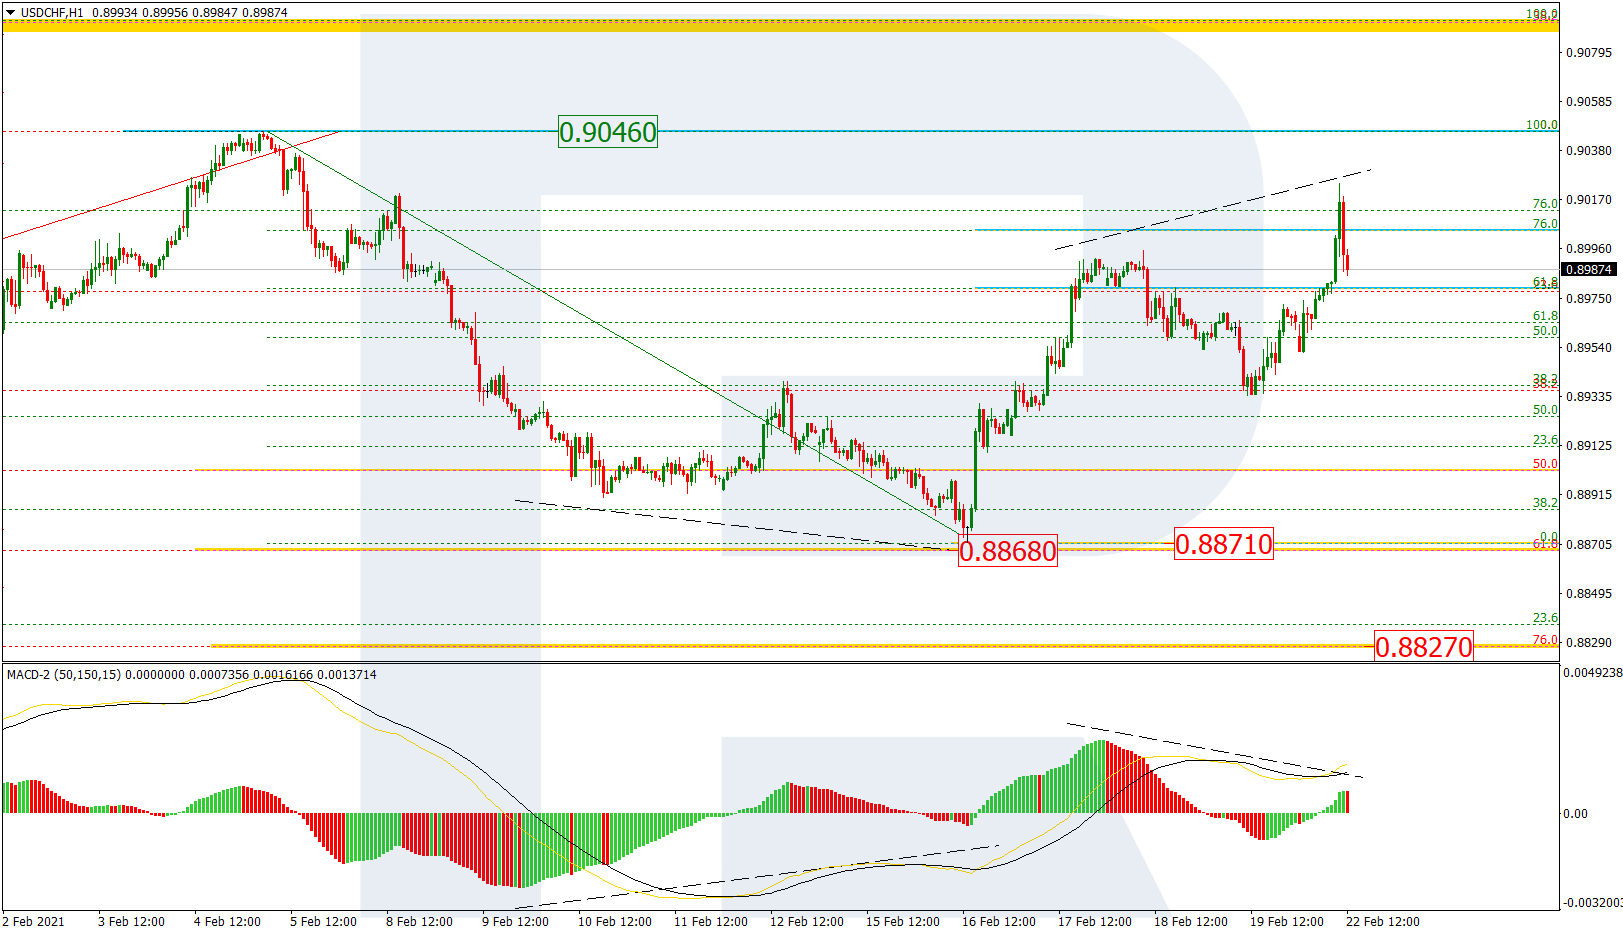
On H1, there is a divergence forming in a wave of growth to the high. This divergence might signal a new wave of decline to the low of 0.8871 and 76.0% (0.8827) Fibo.
Attention! Forecasts presented in this section only reflect the author’s private opinion and should not be considered as guidance for trading. RoboForex LP bears no responsibility for trading results based on trading recommendations described in these analytical reviews.
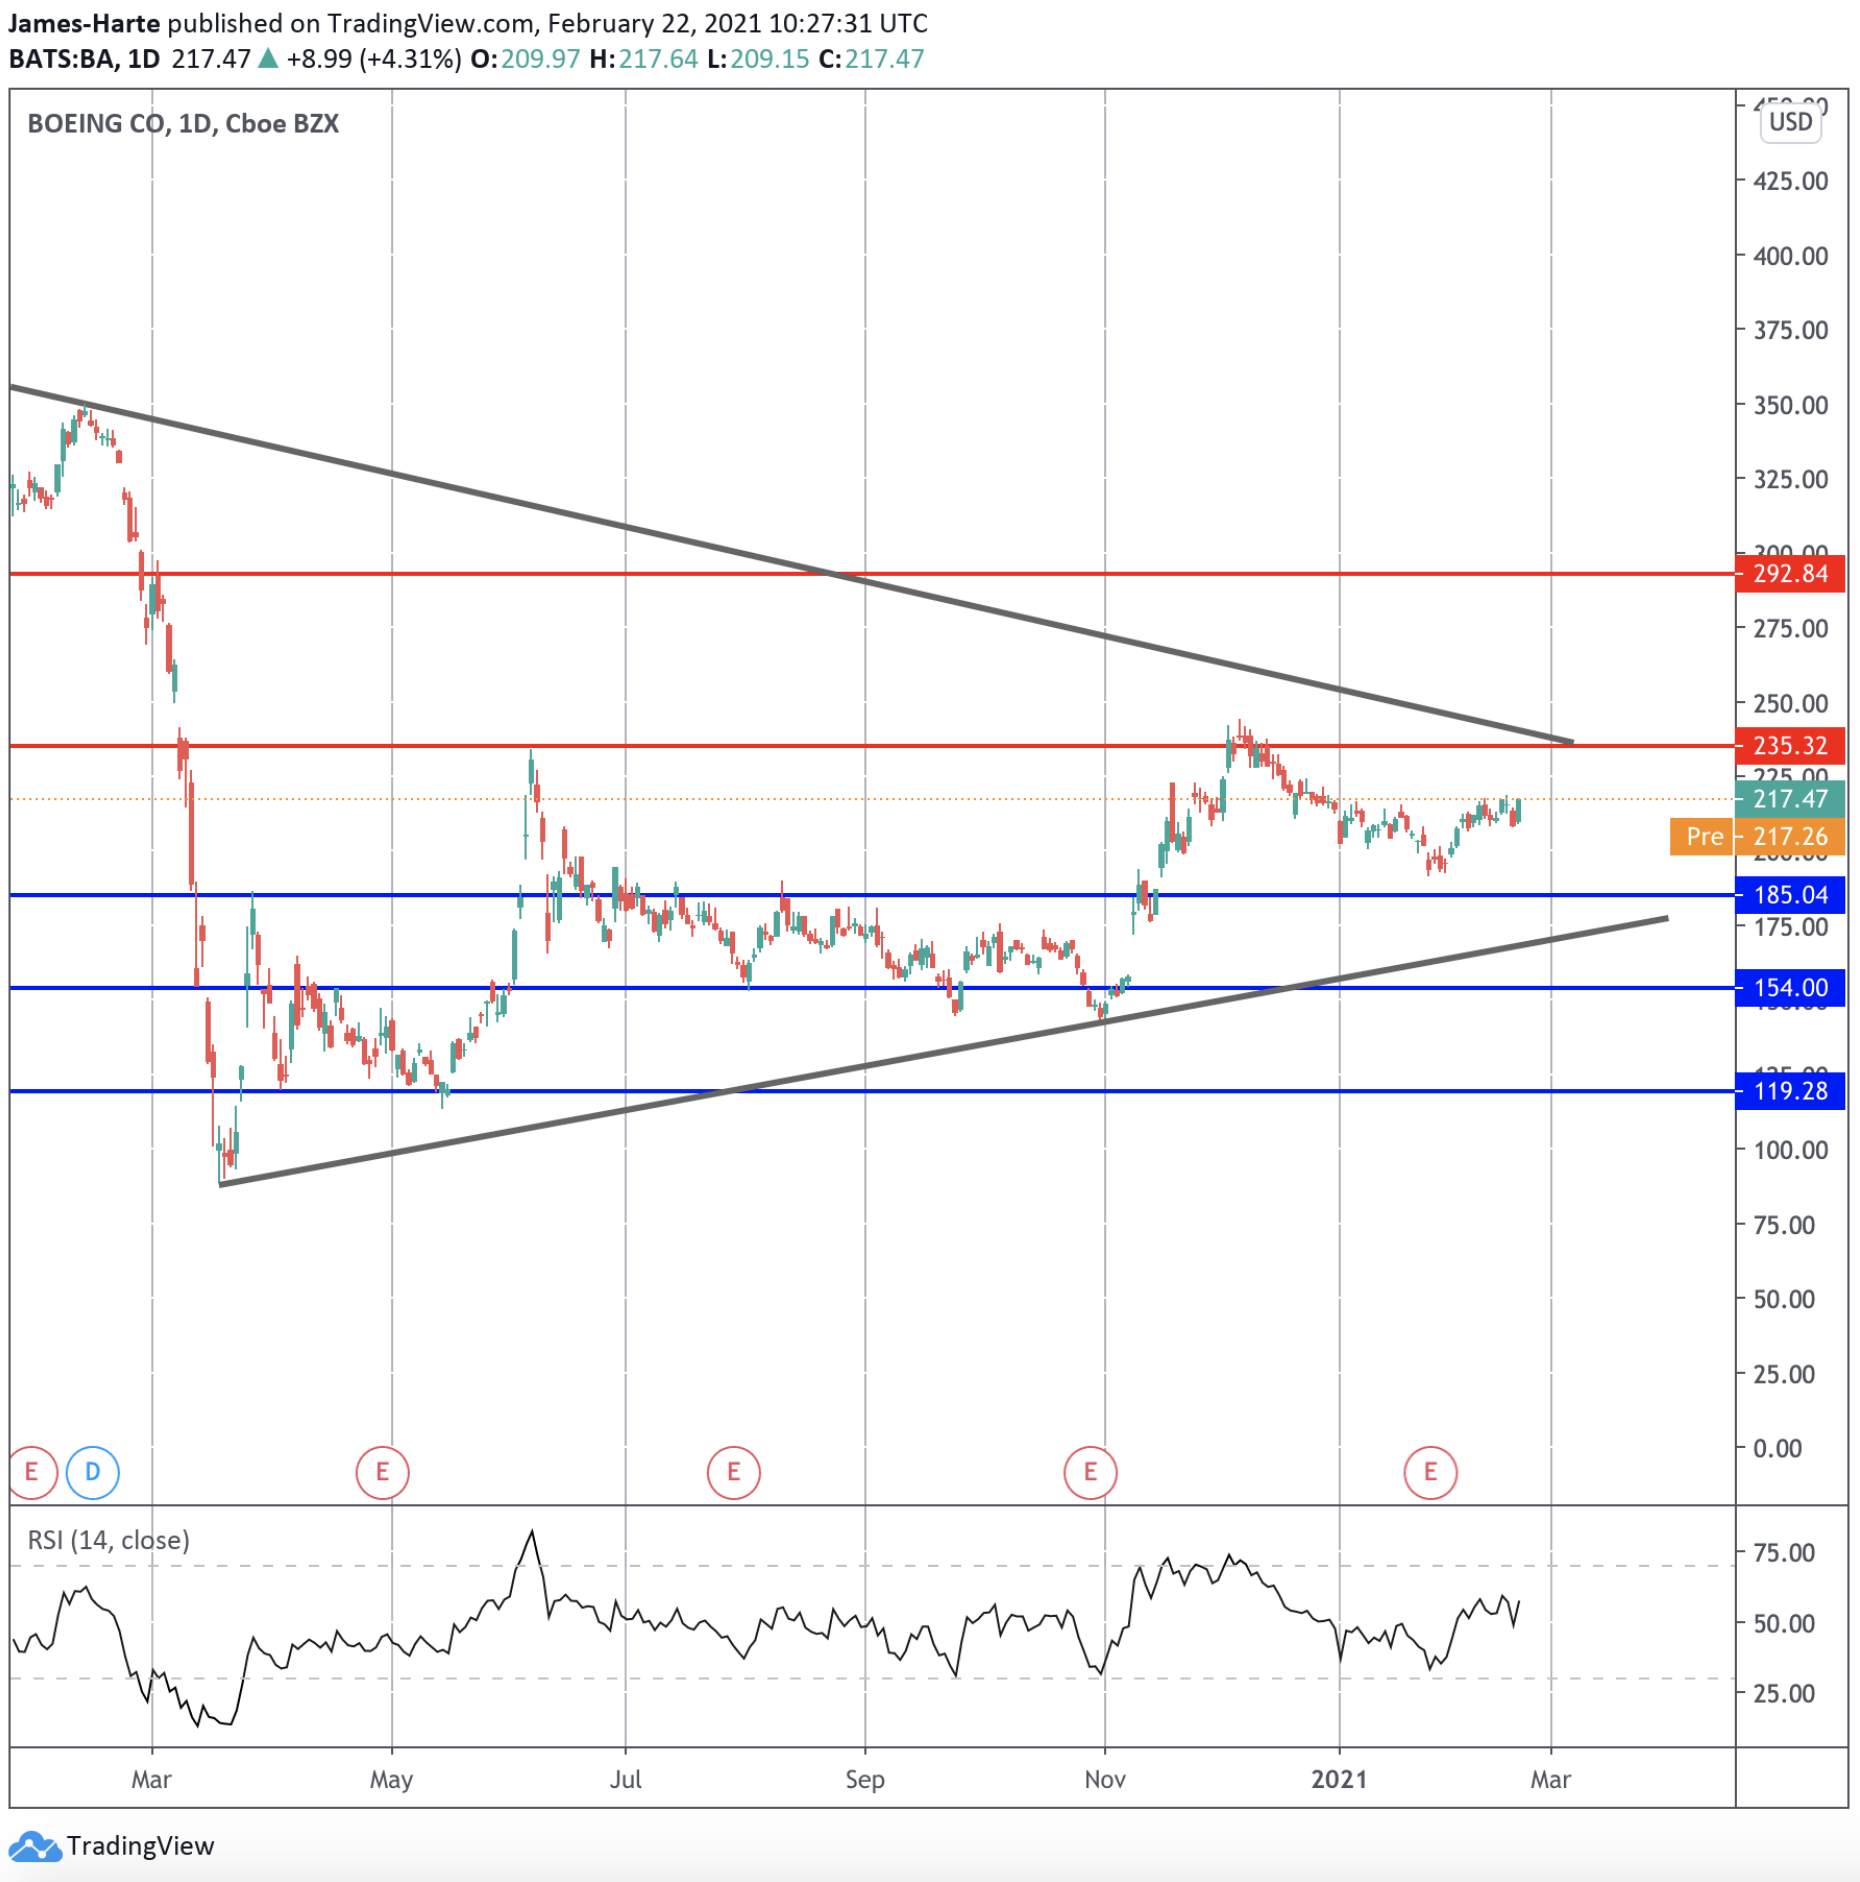
Shares in Boeing are trading a little lower ahead of the US open on Monday. The airliner’s shares have recovered over recent weeks following a steady decline from the December highs above the 235 level. Price found support on approach to the 185 level, however, and are now trading mid range around the 217 level.
Engine Failure
Boeing has been hit by further negative headlines over the weekend as news broker of United Airlines in the US needing to make an emergency landing of one of its Boeing 777s due to engine failure.
The plane, which was carrying 231 passengers, made an emergency landing at Denver airport and reported no injuries. In response to the event, United airlines and two of Japan’s main airlines have stopped using the model, grounding 62 plans between them. Furthermore, Korean Air said that it will ground 6 planes.
In total, Boeing said that 128 planes which all carry the same engine as the Denver plane will be grounded.
More Bad News
The event is highly disappointing for Boeing and its investors given the negative press it has received over recent years as a result of 3 fatal crashes linked to the 737 Max. In the wake of the tragedies, the model was grounded worldwide. Following a safety overhaul and compliance with regulators it has now started to be reintroduced in Latin America, Europe and North America.
Heavy Disruption From Pandemic
Boeing shares suffered over the course of the pandemic, as did other airliners, as a result of the record drop in demand caused by the implementation of lockdowns and travel restrictions worldwide.
Over February and March last year, Boeing shares dropped 200 points falling from above 300 to below 100. Price has since recovered around half of these losses. Demand remains highly subdued as a result of the ongoing lockdowns and restrictions still in place around the world.
However, with the global vaccination effort gathering pace, the airline is looking ahead to a firm recovery over the second half of the year and into 2022.
Boeing Shares Capped By Resistance
Boeing shares continue to grind higher here though the recovery has stalled following the correction lower from above 235. With the bearish trend line coming in around the same level, this remains the key hurdle for bulls to break. If price can move above there, the recovery should start to gain better momentum.
To the downside, the 185.04 level is the key support region to watch. The rising trend line from 2020 lows comes in just below. A break there would open a test of 154 next and 119.28 below it.
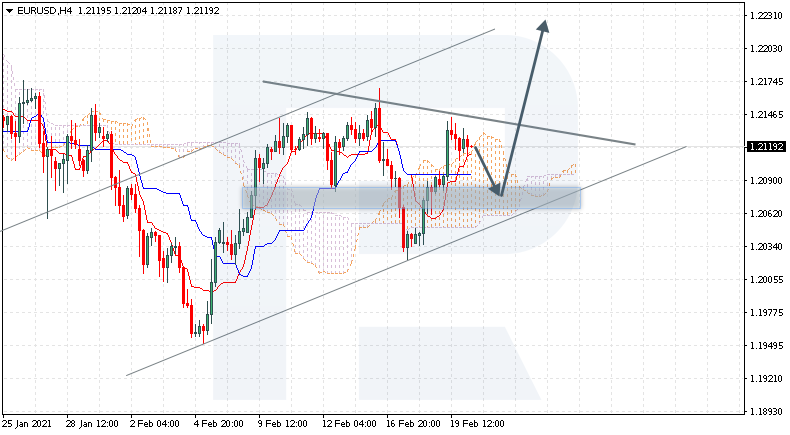
EURUSD is trading at 1.2119 above the Ichimoku Cloud, suggesting an uptrend. A test of the lower border of the Cloud at 1.2070 is expected, followed by growth to 1.2230. An additional signal confirming the growth will be a bounce off the lower border of the ascending channel. The growth will be canceled in the case of a breakaway of the lower border of the Cloud and securing under 1.2030, which will mean further decline to 1.1955. The growth will be confirmed by a breakaway of the resistance area and securing above 1.2150, which will mean an inverted Head and Shoulders pattern is complete.
BTCUSD, “Bitcoin vs US Dollar”
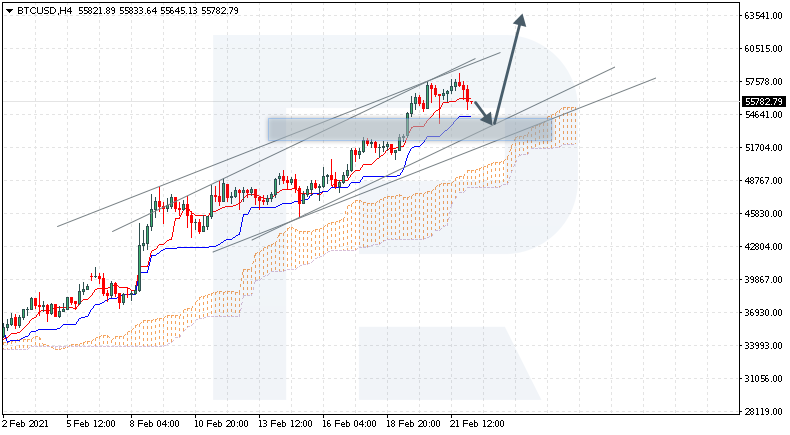
BTCUSD is correcting after a bounce off another all-time high and trading at 55,782 above the Ichimoku Cloud, suggesting an uptrend. A test of the signal lines of the indicator at 54,055 is expected, followed by growth to 63,540. An additional signal confirming the growth will be a bounce off the lower border of the ascending channel. The growth will be canceled in the case of a breakaway of the lower border of the Cloud and securing under 45,705, which will mean further decline to 40,505.
USDCNH, “US Dollar vs Chinese Yuan”
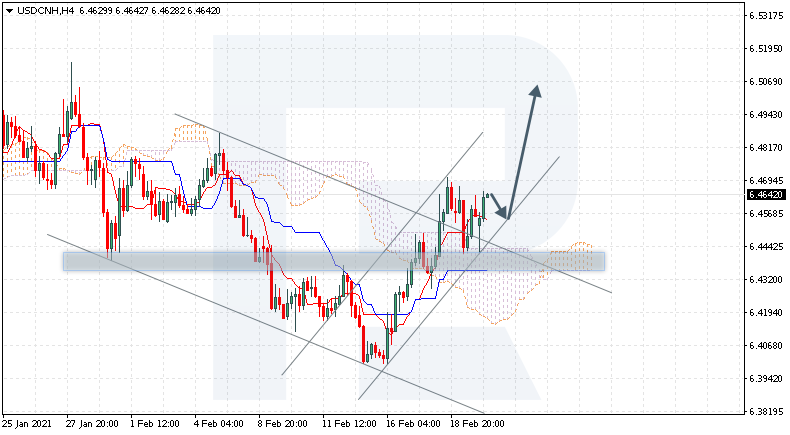
USDCNH is trading at 6.4642 above the Ichimoku Cloud, suggesting an uptrend. A test of the signal lines of the indicator at 6.4585 is expected, followed by growth to 6.5070. An additional signal confirming the growth will be a bounce off the lower border of the ascending channel. The growth will be canceled in the case of a breakaway of the lower border of the Cloud and securing under 6.4065, which will mean further decline to 6.3940.
Attention! Forecasts presented in this section only reflect the author’s private opinion and should not be considered as guidance for trading. RoboForex LP bears no responsibility for trading results based on trading recommendations described in these analytical reviews.
Despite the recent short covering, the US dollar would need a stronger argument to make a meaningful U-turn. Massive liquidity from the $1.9 trillion stimulus package, which is expected to pass sooner than later would continue to depress the greenback in favour of high-yielding currencies. A rise in jobless claims was the latest bucket of cold water poured on dip buyers, a reminder that the downtrend is still here. Even a better-than-expected GDP reading on Thursday may just help selling into strength. The outlook remains downbeat as long as the pair is below 0.9200, while 0.8840 is a key support in the current consolidation.
GBPJPY stays high as faster recovery expected
With the fastest vaccine rollout among major economies, the UK is poised to take a lead in the recovery in the western hemisphere. The pound’s strong performance, even against its riskier peers is a strong sign that the market is betting on a quicker comeback. After a surprisingly positive CPI last week, further improvement in the labour market could be the catalyst to propel the pound above its fourteen-month high. Technically however, the pair has been overbought and could use a healthy correction from 148.00. Should this happen buyers are more likely to be lurking around 144.00 near the moving averages.
CADCHF rises as oil erases 2020 losses
As oil prices recouped all the losses sustained from early 2020, the Canadian dollar continues to benefit from this strong tailwind. Adding fuel to the loonie’s rise was an acceleration of the inflation rate to 1% in January. This enviable combination of bullish commodity markets and steady domestic recovery has put the loonie on the launchpad along with other risk assets. The pair is expected to grind up along a well-defined bullish trendline. However, a true reversal can only materialise if buyers succeed in breaking above last June’s resistance at 0.7200. On the downside, the psychological level of 0.7000 is bulls’ stronghold.
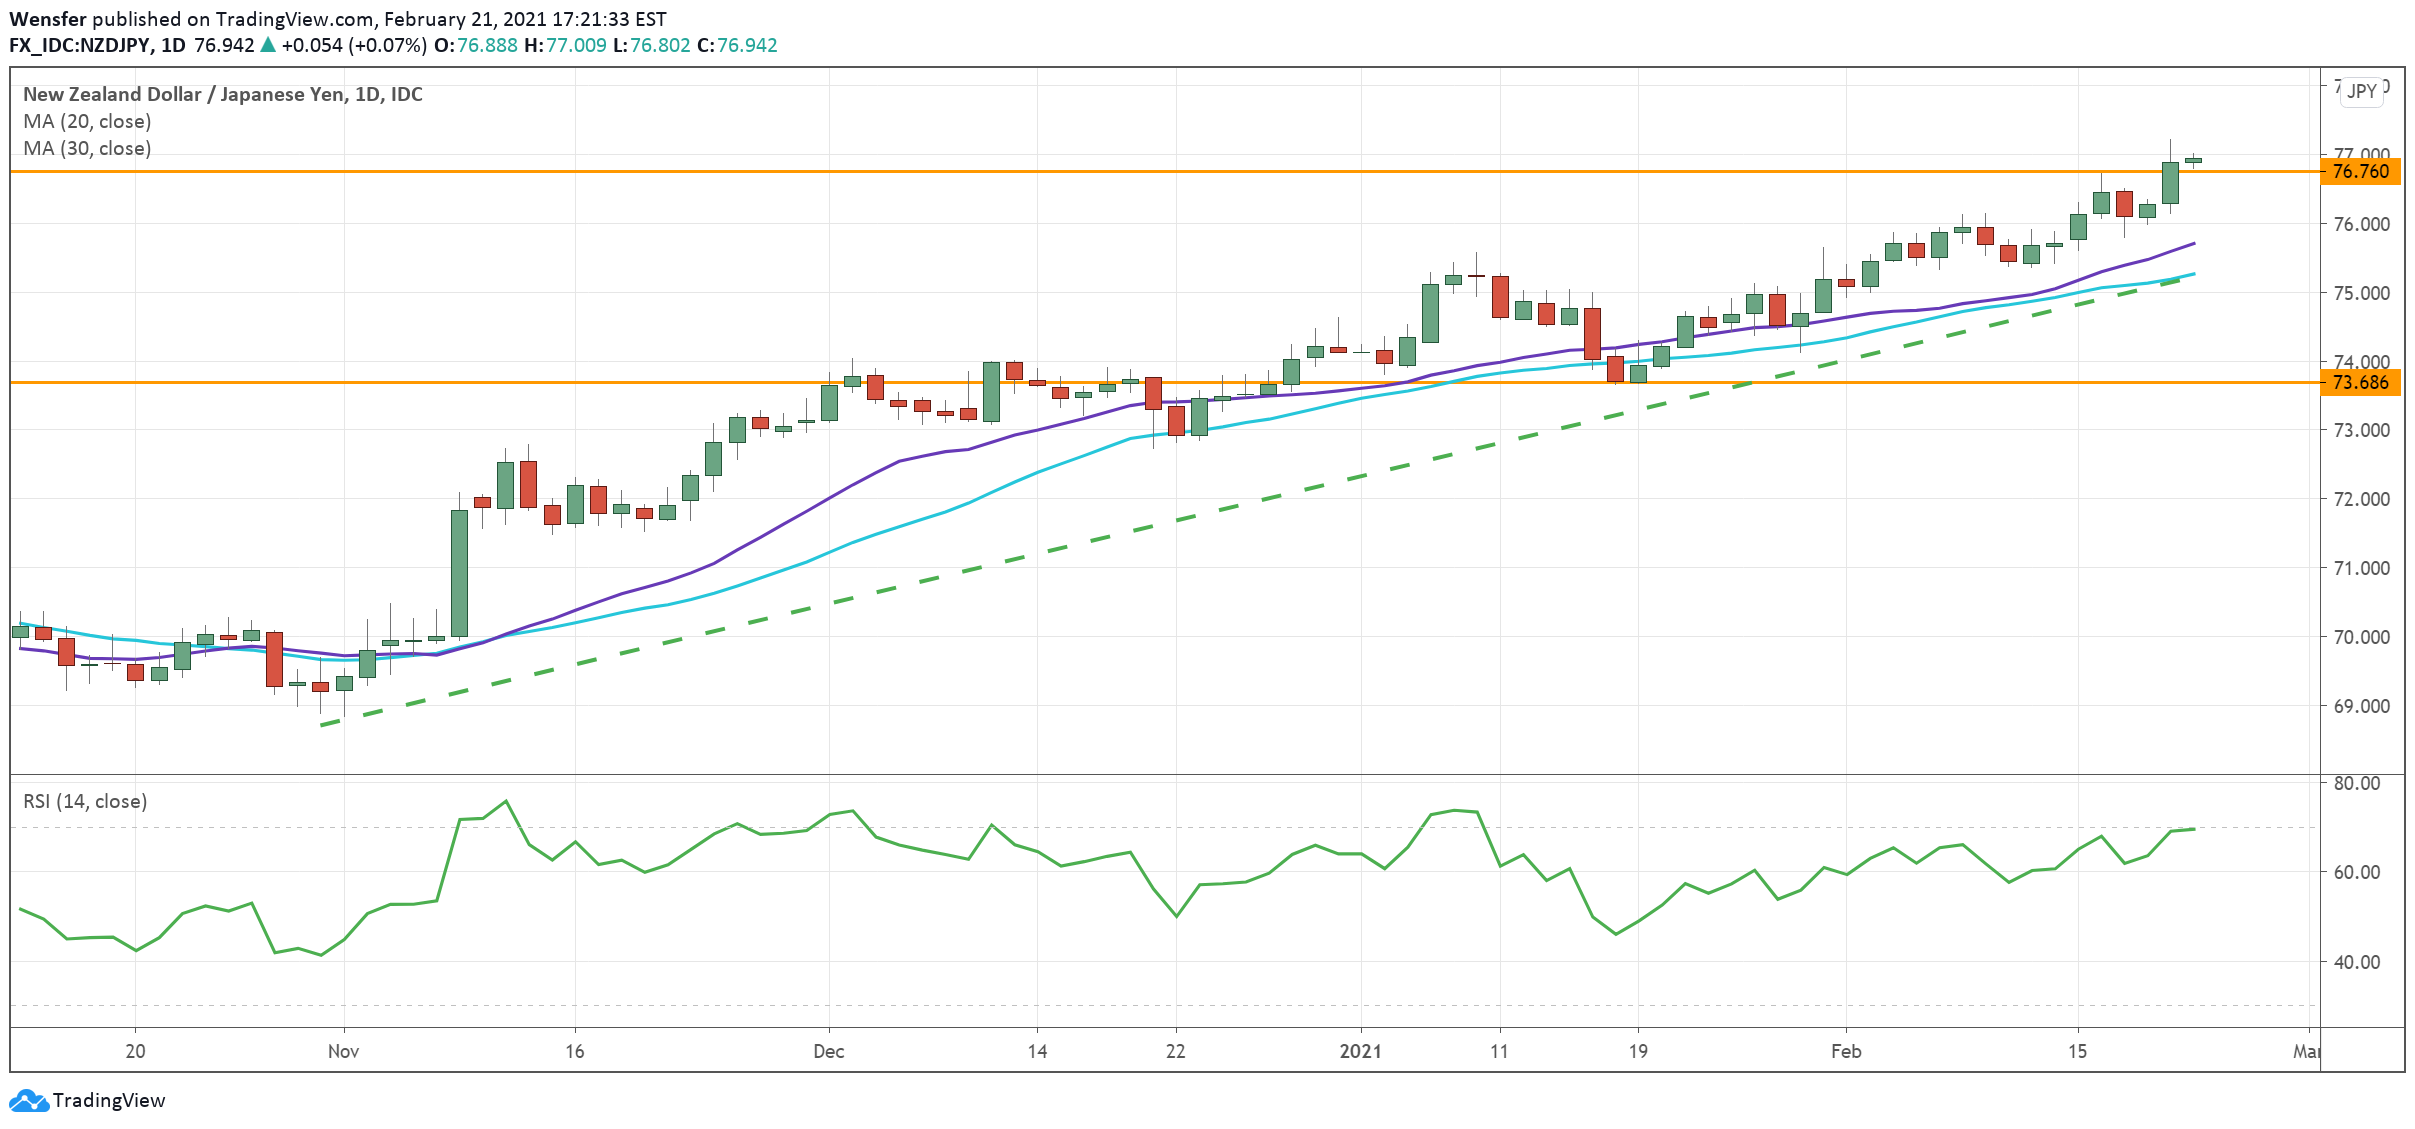
NZDJPY rallies on general optimism
Sentiment in the New Zealand dollar remains overwhelmingly positive despite a three-day flash lockdown in Auckland due to a few Covid cases. As the price action reaches a two-year high, traders seemingly have turned the page on the pandemic. Robust domestic data with the unemployment rate fallen to 4.9% have provided a backbone to the rally. The RBNZ, however, might find its currency’s appreciation inconvenient and play down its hawkishness to prevent overheat in the market. The bullish breakout above March 2019’s high of 76.76 could further extend the rally. In case of a pullback, 73.70 is the immediate support level.
Positive manufacturing PMI data supported the bulls on Friday. Despite the contraction in the services sector, bullish sentiment prevails as the composite index is also accelerating. In this light, the continuation of the northern trend can be expected.
Trading recommendations
Support levels: 1.2081, 1.2023
Resistance levels: 1.2155, 1.2169
The main scenario for trading the EUR/USD is buying. The 1.2169 level is important as the daily moving average is located there. If the price goes above it, it will indicate the resumption of growth in the long term. On the hourly timeframe, everything seems to be in favor of the bulls. The ADX showed a significant reaction on Friday’s upward momentum, and the price is fixed above the moving averages.
Alternative scenario: if the price manages to consolidate below the level of 1.2081, the pair may return to the decline to 1.2023.
News feed for 2021.02.22:
– German IFO Business Climate Index (Feb) at 10:30 (GMT+2).
The GBP/USD currency pair
Technical indicators of the currency pair:
Prev Open: 1.3971
Prev Close: 1.4005
% chg. over the last day: +0.24%
The sterling continued to break records on Friday. A combination of a significant difference in cash liquidity in favor of the dollar and a positive fundamental background worked in favor of the pound. Growth expectations for the UK economy rose after IHS Markit data. As a result, the GBP/USD has reached three-year highs.
Trading recommendations
Support levels: 1.3819, 1.3775
Resistance levels: 1.4050, 1.4100
The main scenario for trading the GBP/USD is cautious buying. Despite strong growth, it is time for bulls to be vigilant. Technical indicators are starting to signal an impending correction. On the daily timeframe, the ADX hits the overvalued area. The H4 shows a drop in bullish pressure. On the H1, the MACD is showing divergence. Growth can be limited by the round level of 1.4100.
Alternative scenario: if the pair consolidates below 1.3932, it may return to 1.3819.
There is no news feed for today.
The USD/JPY currency pair
Technical indicators of the currency pair:
Prev Open: 105.66
Prev Close: 105.43
% chg. over the last day: -0.22%
The dollar-yen continues its gradual decline following risky assets. The stock market is experiencing a decline in demand for shares, which leads to an appreciation of the yen. But at the same time, investors are not leaving for defensive assets. Gold is not showing an upward trend and bonds continue to lose value. In this light, the pair’s southern movement may be limited.
Trading recommendations
Support levels: 105.10, 104.40
Resistance levels: 106.12, 106.55
The main scenario is trading in a range between 105.80 and 105.10. It is neither fundamentally nor technically possible to indicate a priority in a direction. After a short-term decline, the price sharply returned to the moving averages. The rest of the indicators are near their minimum values.
An alternative scenario implies the price-fixing above 105.80. In this case, the pair may resume growth to 106.12 – 106.55. A breakthrough of 105.10 could trigger a further decline towards 104.40.
There is no news feed for today.
The USD/CAD currency pair
Technical indicators of the currency pair:
Prev Open: 1.2673
Prev Close: 1.2613
% chg. over the last day: -0.47%
The pair continued to decline, following the dollar index. Oil prices are subject to a southern correction, which balances the strength of bulls and bears in the short term. But the medium-term direction remains south.
Trading recommendations
Support levels: 1.2590, 1.2550
Resistance levels: 1.2665, 1.2745
The main scenario is selling up to 1.2550. The ADX and the MACD have shown a significant reaction to the price decline, which indicates an increase in the strength of the bears. But given the correction in the commodity market and the negative fundamentals in Canada, the further decline may be limited.
Alternative scenario: if the price gains a foothold above 1.2665, the pair may rise to 1.2745.
This article reflects a personal opinion and should not be interpreted as an investment advice, and/or offer, and/or a persistent request for carrying out financial transactions, and/or a guarantee, and/or a forecast of future events.
The trading success of the traders depends on maintaining an accurate business journal. No investors can deny the importance of this journal as it helps them in many ways. In the initial phase, people cannot able to understand the importance of keeping this, so do not note down their daily activity. After facing the problem several times, the businessmen understand the significance of the trading journal and start to keep the records. A trading journal plays an important in the buying-selling process. The importance of keeping a business journal has been discussed below.
Make the Performance High
To make better the daily performance, the trader should keep a record of the previous trades. When people aware of the mistake which they have done in the previous trade, they will not do these mistakes again consciously. So, this will help them to give high performance. When the performance will be good, a person will able to make more money by facing the winning streaks. The journal also allows the investors to measure his or her performance which is very important for staying in the competitive field for a long time and make a strong position.
Allow to Find the Emulsions of the Errors
When you will not know about your mistakes, you will not be able to find out the solution. But the business record allows people to identify the flaws which are responsible for the dramatic failure. This will show the person each and every error in the process of trading and help them to avoid these in the upcoming trade. If anyone wants to shine in the field of Forex, he or she has to ignore the repeating mistakes, this will allow him or her to get rewards. Remember the fact, to spot the errors in your existing system, you have use the best mt4 trading platform from Rakuten Australia. If you chose to trade with the low end broker, it will be a tough call to manage the risk profile. So, try not trade with the low end platforms.
Make the Mind Fresh
In your journey, you have faced several losing streaks and several winning streaks. So, all memories are not bitter, some memories really give pleasure. So, if the investor is feeling bad and thinking of self-destructive things, he or she should immediately open the record of a previous winning trade and try to observe every step properly. This will provide them the courage to deal with the difficulties and make them confident about their performance. When a businessman feels lots of pressure, he or she is not able to smile properly. During this time, if he or she is able to recall the successful memory, the smile will come automatically to his or her face.
Make Separate from the Fresher
If the businessman starts to keep a record of previous activities, he or she will able to understand the disadvantage and advantage of the particular time. This will make them different from the beginners as they do not properly understand the different circumstances of the market. Reviewing the trading journal is the work of the professionals. So, if you do so, you will be also able to do business like executives. The record will allow you to know about your ability and strength and weaknesses. Which is very necessary for providing better performance.
The businessman has to keep a trading journal if he or she is serious about his or her business. Some people come to the Forex market for making extra money. If you also have the same tendency, then doing no trade in this highly liquid field will be better for you. People should treat trading as a regular job in which they have to give proper time, and have to work regularly. The journal will help them to see their working procedure and help them to find out where the new techniques need to be applied.
Author: Dmitriy Gurkovskiy, Chief Analyst at RoboForex
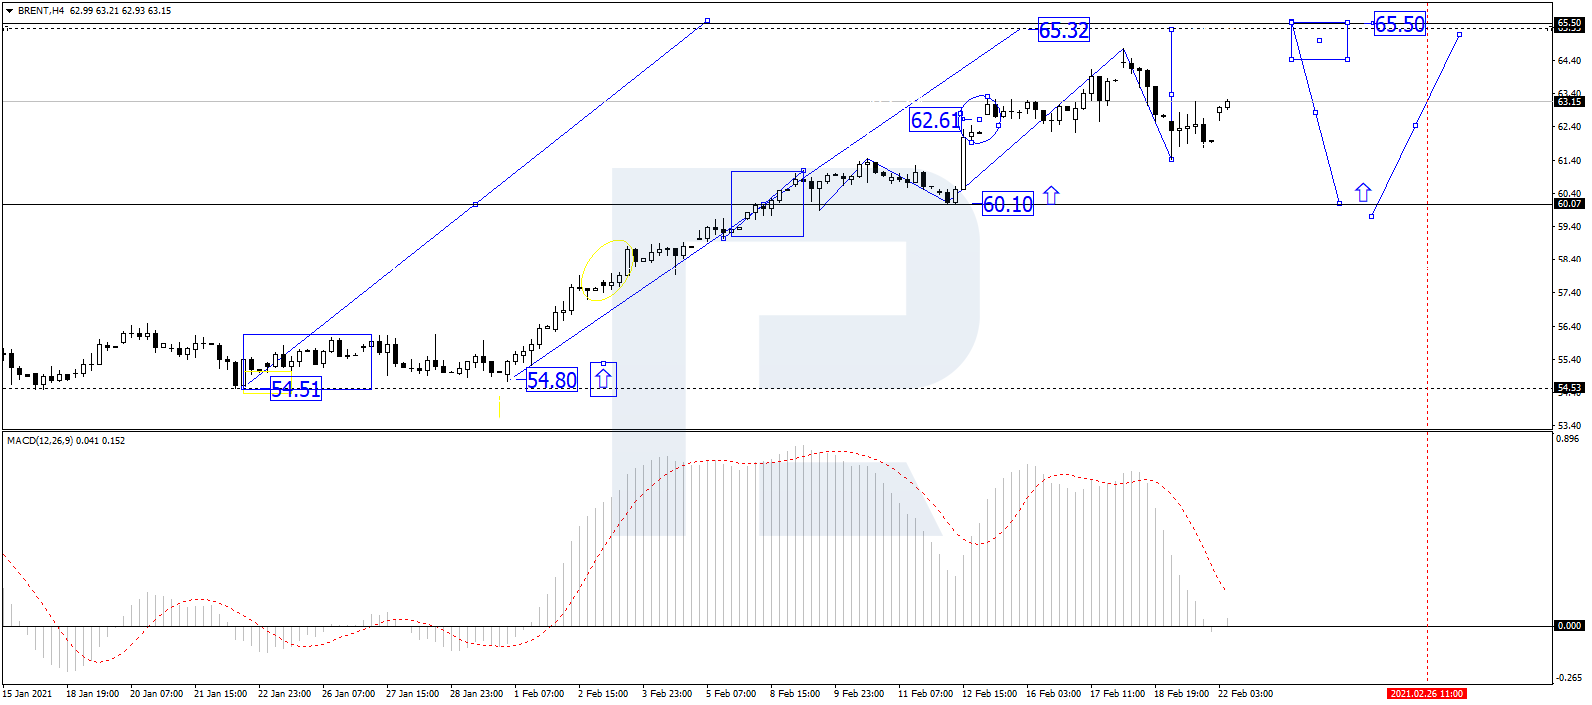
After a short correction, oil is restoring, returning to full-scale growth. On Monday, February 22nd, a barrel of Brent costs 63.85 USD.
On H4, BRENT is trading in another structure of growth from 60.10, aiming this wave of growth at 65.30. The goal is local. At the moment, the market is forming a consolidation range of around 62.62. Today, we expect it to extend to 63.00. With a breakaway of this level upwards, the growth should continue to 65.00 and perhaps over 65.30.
Technically, the scenario is confirmed by the MACD oscillator. Its signal line rests near zero. We expect the histograms to grow and the signal line – to enter the histogram area. As soon as this happens, the growth of the price will speed up.
On H1, BRENT is growing, aiming at 63.37. Then a consolidation range might form around this level. With an escape upwards, the trend might continue to 64.94. The goal is local.
Technically, this scenario is supported by the Stochastic oscillator. Its signal line is currently trading under 80. This means the market is overbought, and a correctional decline might develop to 50, followed by growth to 80.
According to Baker Hughs, during the week before February 19th, the number of drilling rigs remained unchanged at 397 units. Meanwhile, the number of oil derricks has dropped for the first time in 13 weeks (-1 unit), while the number of gas towers has grown (+1 unit).
Last week, the US Department of Energy reported a decrease in the number of crude oil reserves by 7.3 million barrels after falling previously by 6.6 million barrels. This quite supported buyers: cold weather in the USA increases the demand for energy carriers.
The same factor – freezing weather – influenced oil production in the USA as well, mostly due to Texas and surrounding territories. All in all, fundamental news turned out on the bulls’ side.
Disclaimer
Any forecasts contained herein are based on the author’s particular opinion. This analysis may not be treated as trading advice. RoboForex bears no responsibility for trading results based on trading recommendations and reviews contained herein.
Investing in stocks can be a stressful process, especially when it comes to determining whether you are making long-term or short-term investments. However, with a little bit of understanding and some experience in investing, it can be made significantly easier. In this article, we will be providing you with information on how you should tackle stocks and shares for the best possible price.
There Is No Such Thing As A Solid Investment
When making the change to doing investments, it is important to make sure that you are staying on your toes. With no investment being a solid investment, it is important to make sure that you are calculating all the risks associated with it to make sure that there is not a loss in revenue as a result. By doing this before every investment, it is important to make sure that you are making an investment that will be profitable in the long-term.
Think Long-Term Investments
Every investment that you are making can be as small or as little as you want and can all be profitable, however, it is important to make sure that your investments are long-term. Originally, a long-term investment meant that those investments would have to sit on their computers and monitor the market. However, with social trading and several applications on mobile devices, several benefits can come from this. Regardless of whether you are investing in the customer sector or you are investing in materials, there are several options out there for you.
Understand The Market As A Whole
Understanding the market as a whole can be a challenge, especially when it comes to investing in everchanging markets such as tech. However, with some research as well as the help of investment researchers, several benefits can come from learning about the market before you begin investing. All this information can be used within company meetings to enable you and the rest of the company to make investments that are profitable on both a short term and a long-term basis and will allow you to diversify.
Beware Of Those That Take Commissions
The final element that you need to consider is the platform that you are investing through. With a number of these platforms taking a certain amount of commission for every trade that you make; this will enable you to make sure you are only spending what you can afford at this time. With several platforms also not taking a commission on these investments and providing unique tools to use with your investment, it is important to consider which one of these investment platforms are right for you as this will enable you to make the best possible investments out there for your business.
With this in mind, there are several options out there for you to consider when it comes to making investments to ensure that you have everything that you need all in one place. Where will you be beginning with each of your investments?
The S&P 500 enters the new week on the back of its longest losing streak since December, having fallen 4 days on the trot. Markets are growing concerned about the risk of the Fed eventually pulling back its support as the US economy shows surer signs of recovery.
Amidst this conundrum, here are some key speeches and events that could influence global market sentiment this week:
Wednesday, 24 Feb: Fed Chair Jerome Powell testimony (House); speeches by Fed Governor Lael Brainard and Fed Vice Chair Richard Clarida
Thursday, 25 Feb: Fed speak: Atlanta Fed President Raphael Bostic, St. Louis Fed President James Bullard, New York Fed President John Williams
Friday, 26 Feb: House may vote on $1.9 trillion US fiscal stimulus; US consumer sentiment, personal income and spending
Key themes
More US fiscal stimulus coming soon?
The trading week will be bookended by events pertaining to the $1.9 trillion US fiscal stimulus programme, which is a pillar for equity bulls. On Monday, US Treasury Secretary Janet Yellen is expected to extol the virtues of rolling out more government spending to help the US economy recover. By Friday, Democrats hope to put President Joe Biden’s $1.9 trillion fiscal stimulus proposal before its first floor vote in the House.
Equity bulls may draw more support from any positive comments or developments surrounding the next wave of US fiscal stimulus, which may push benchmark indices higher.
With the S&P 500 having pulled further away from overbought levels, that may have cleared the path ahead for this blue-chip index to explore higher ground. The futures contract is now inching lower at the time of writing.
Fed to push back once more against easing policy support
Another major theme in the markets so far this year has been the thought that the US economy, aided by swathes of fiscal and monetary policy support, could recover much quicker than anticipated. And should the US economy outperform, accompanied by faster inflation, it could prompt the Fed to reduce its asset-purchasing programme sooner than expected. Or so the narrative goes in the markets.
Such an idea has prompted investors to sell off US Treasuries, causing 10-year yields to rise to pre-pandemic levels above 1.30 percent, now around their highest since February. The spike in yields has in turn provided support for the dollar index (DXY) while dragging gold prices lower.
Should yields continue climbing higher this week, encouraged by better-than-expected data for consumer sentiment and personal income/spending due this week, that could drag bullion even lower. Gold’s support region around $1760 from the end-November low appears to be holding for the time being.
Besides the US economic indicators, gold traders will also be paying attention to Fed Chair Jerome Powell’s pair of testimonies before Congress along with the scheduled speeches by other Fed officials over the coming days.
Should markets grow convinced that the Fed is truly willing to tolerate an overheating US economy while leaving its existing policy support untouched, that may dampen US yields while offering some lift to gold prices.
If markets hold on to the existing narrative (pre-empting the Fed’s tapering plans even as US inflation remains subdued), then that could continue to exert downward pressure on the precious metal and could even push it closer to the psychologically-important $1700 mark.
Disclaimer: The content in this article comprises personal opinions and should not be construed as containing personal and/or other investment advice and/or an offer of and/or solicitation for any transactions in financial instruments and/or a guarantee and/or prediction of future performance. ForexTime (FXTM), its affiliates, agents, directors, officers or employees do not guarantee the accuracy, validity, timeliness or completeness, of any information or data made available and assume no liability as to any loss arising from any investment based on the same.
– Gold continues to wallow near its recent low price level, near $1765. Silver has continued to trend moderately higher – but still has not broken out to the upside. Many analysts have continued to estimate when and how metals will begin the next wave higher. My research team and I believe we’ve found some answers to these questions and want to share our research.
Silver Explodes In Late-Stage Excess Rallies
The first thing we want to highlight is that Silver tends to rally excessively in the later stages of any precious metals rally. For example, in mid-2010, Silver began an incredible upside price rally after Gold rallied from $720 (October 2008) to $1265 (June 2010). This suggests that the price relationship between Gold and Silver “dislocated” in the early stage breakdown of the financial markets near the peak of the 2008-09 Housing Crisis Peak. Then, in late 2010, Silver began to move dramatically higher while Gold continued to push an additional 80%+ higher.
The Silver rally in 2010~11 is clearly evident on this Silver/Gold Weekly chart, below. The lack of any Silver price advance compared to Gold prior to the 2010 rally is also evident. One interesting fact relating to how Silver reacted to the 2008~09 Housing Crisis is the deep collapse we see on the left edge of this chart. A similar collapse happened just recently as COVID-19 shocked the global markets in 2020.
One key aspect we found very interesting is how Silver recovered moderately slowly in 2009~10 before launching into an incredible breakout rally in late 2010 – nearly 15 months after the bottom. Currently, after the COVID-19 bottom, Silver has rallied a bit more aggressively and quickly. While Gold has languished below $1800 recently, Silver has continued to gain value compared to Gold. This new dynamic may suggest the current setup in Precious Metals is transitioning into the late-stage excess rally much quicker than in 2009-10.
Treasury Yields Drive Explosive Trends In Silver
How do Treasury Yields relate to price action in Silver? The first thing we need to understand is that Silver can rally while Yields are rising or falling. What happens when Yields rise over long periods of time is that Silver will tend to attempt to find support while trending moderately higher. Eventually, if fear subsides in the global markets, Silver may fall in price in the later stages of rising Yields.
As you can see on the Treasury Yield to Silver chart below, Yields collapse in 2008 & 2009, as the Housing Crisis unloaded on the global markets. Yields also collapsed in 2020 as COVID-19 shocked the global markets. In 2009-10, interest rates collapsed and Yields collapsed until late 2013. Silver continued to form a base in 2015~16 as Yields rose and peaked. Near the peak in Yields in 2018, Silver continued to attempt to establish a bottom.
What we find interesting related to this chart is the steep collapse in Yields after the 2018 peak and the recent rally in both Yields and Silver. We believe Yields may stall and begin to move lower – resulting in another rally attempt in Silver and Gold. We believe the recent rally in Yields is a reaction to the deep lows related to COVID-19 and that Silver is representing a price pattern similar to 2008-09 – a deep low, followed by a moderately strong price recovery. Yields could stay low for much longer than many people expect if our research are correct.
If Yields continue to stay near or below current levels, the lowest ever experienced in recent history, then Silver should begin another rally attempt very quickly – possibly within just a few weeks. The question becomes, what would prompt Yields to fall quickly from current levels? Could some type of global credit or financial crisis be brewing again?
Commodities & Metals Align
Last but not least, we want to highlight the correlation between commodities and Silver/metals. When commodities prices rise, in general, Silver rises as well. The Monthly Commodity & Silver chart, below, highlights the rally in Commodities in 2010~2011 as well as the incredible rally in Silver that took place at the same time. Now, focus on the hard right edge of this chart and pay attention to the rally in Commodities and Silver that has taken place over the past 12+ months. What is brewing is that Commodities are rallying from a deep bottom that has taken over 9 years to complete. The continued decline in commodities since 2011 has prompted a very strong price recovery attempt after the COVID-19 deep lows. Silver has reacted to this rally in Commodities, like it usually does, to prompt a fairly strong upside price trend.
Recently, though, Silver has stalled while Commodities prices have rallied. This suggests that Silver is congesting in a new momentum base and should begin an explosive upside price rally – comparable to the rally we are seeing in Commodities. Commodities have rallied near 20% over the past 12 weeks while Silver has nearly the same amount over the same span of time. From the COVID-19 lows, the Commodity Index rallied nearly 22% while Silver rallied more than 127%. If Silver were to maintain this ratio, the 20% rally in Commodities should prompt a 110% rally attempt in Silver.
Given our research related to how Silver has moved compared to Gold, Treasuries, and Commodities, we believe Silver is basing and building momentum for a big breakout rally. We believe the upside move in Yields has put pressure on Silver and Gold recently to stall/consolidate. We believe Commodities are building strong upside price momentum which should push Gold and Silver higher. As the Commodity rally continues while Gold and Silver stall, an incredible amount of upside price momentum builds up over time. When it breaks, it could be very explosive.
A change of direction in Yields could prompt Silver and Gold to resume a strong upside price trend. Either way, as long as Commodities continue to rally and Yields begin to stall or more sideways, Gold and Silver are poised to attempt another advancing leg higher.
Our research team believes Gold and Silver are poised to make another big price advance. We wish we could tell you exactly when it will happen – but we can’t. Our estimate is that within the next 2 to 4 weeks, continued pressures will likely push both Gold and Silver into an upside breakout price trend. We believe the amount of rally pressure that is building in Gold and Silver is immense. Time will tell if we are correct or not.
Don’t miss the opportunities in the broad market sectors over the next 6+ months, which will be an incredible year for traders of the BAN strategy. You can sign up now for my FREE webinar that teaches you how to find, enter, and profit from only those sectors that have the most strength and momentum. Learn how the BAN strategy can help you spot the best trade setups because staying ahead of sector trends is going to be key to success in volatile markets.
For those who believe in the power of trading on relative strength, market cycles, and momentum but don’t have the time to do the research every day then my BAN Trader Pro newsletter service does all the work for you with daily market reports, research, and trade alerts. More frequent or experienced traders have been killing it trading options, ETFs, and stocks using my BAN Hotlist ranking the hottest ETFs, which is updated daily for my premium subscribers.

















 Article by