Japanese Candlesticks Analysis 02.03.2021 (GOLD, NZDUSD, GBPUSD)

Article By RoboForex.com

XAUUSD, “Gold vs US Dollar”

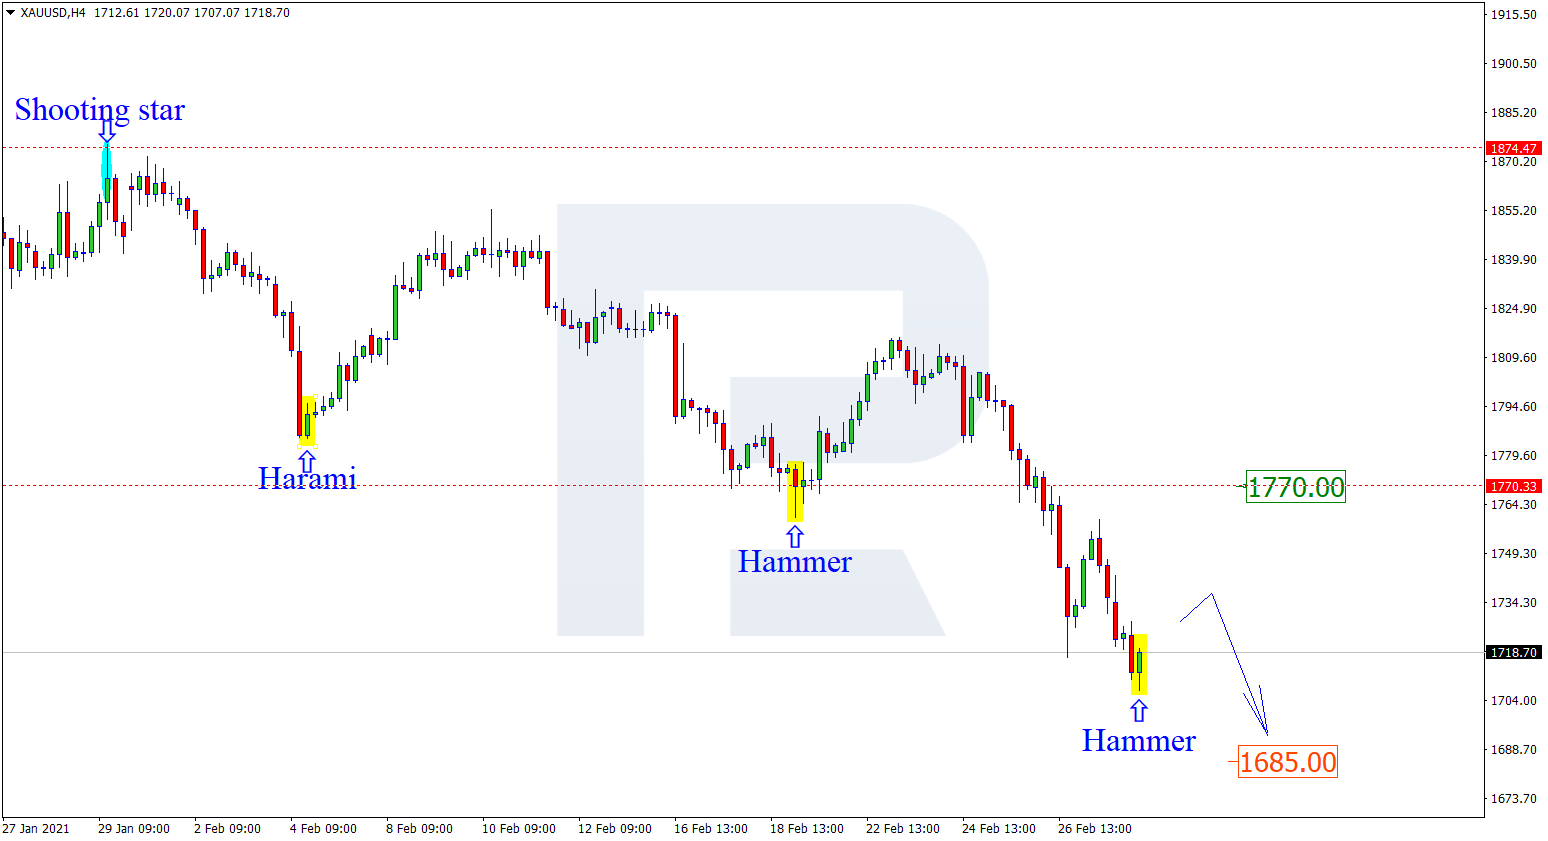
As we can see in the H4 chart, the descending impulse continues. After forming several reversal patterns, such as Hammer, close to the horizontal support level, XAUUSD is reversing and may later correct towards the resistance area. In this case, the correctional target will be at 1770.00. At the same time, an opposite scenario implies that the price may continue its decline towards 1685.00 without reversing and correcting.

XAUUSD
Risk Warning: the result of previous trading operations do not guarantee the same results in the future

NZDUSD, “New Zealand vs. US Dollar”

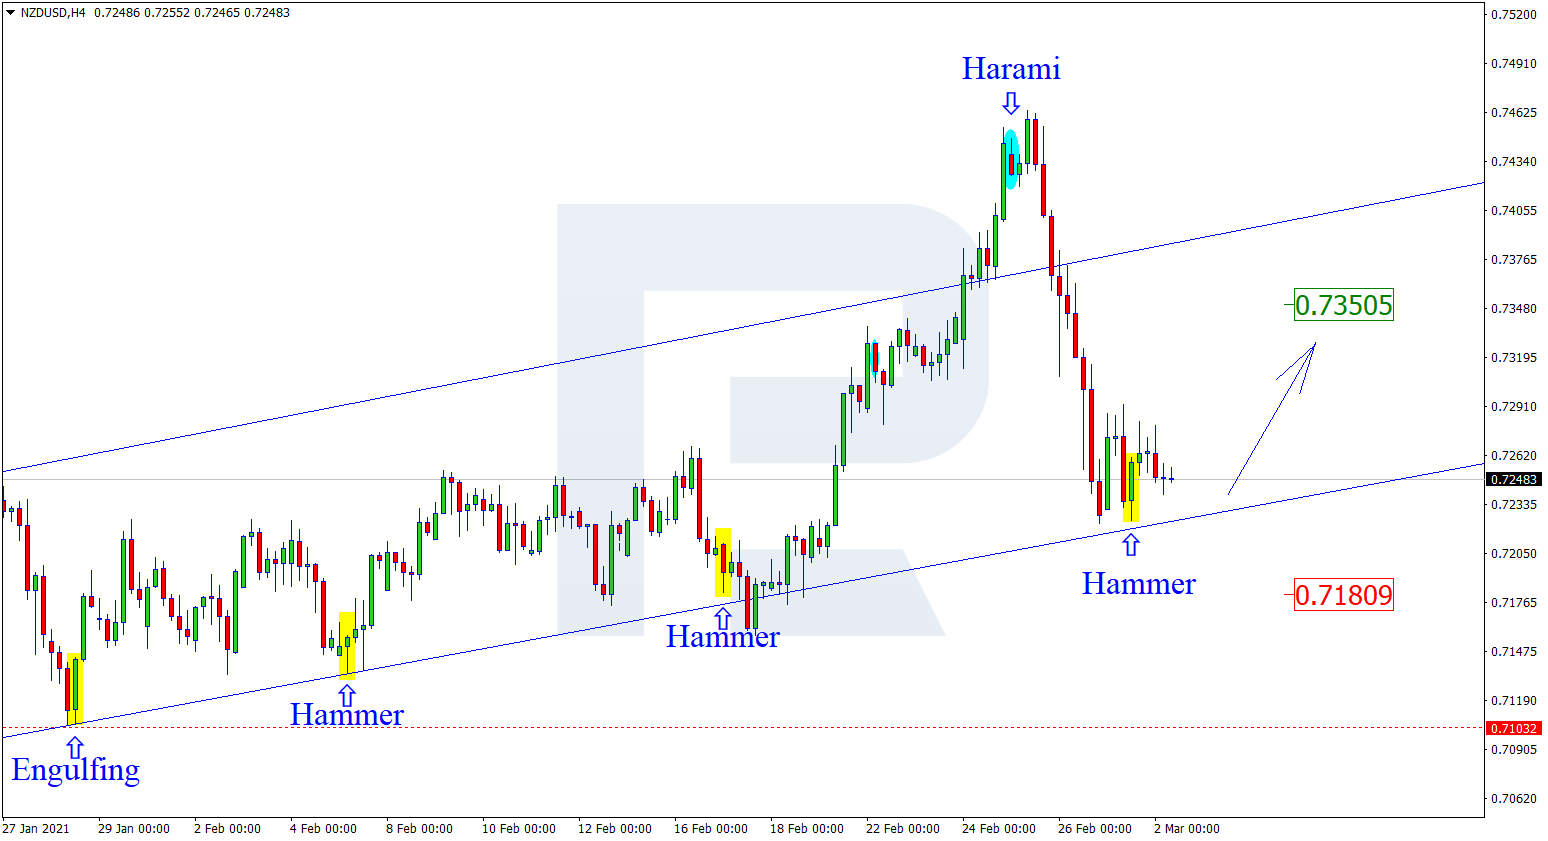
As we can see in the H4 chart, the pair is still correcting within the uptrend. By now, NZDUSD has formed several reversal patterns, such as Hammer, close to the support level. The upside target may be the resistance area at 0.7350. However, an alternative scenario implies that the price may continue its decline towards 0.7180 without reversing and correcting.

NZDUSD
Risk Warning: the result of previous trading operations do not guarantee the same results in the future

GBPUSD, “Great Britain Pound vs US Dollar”

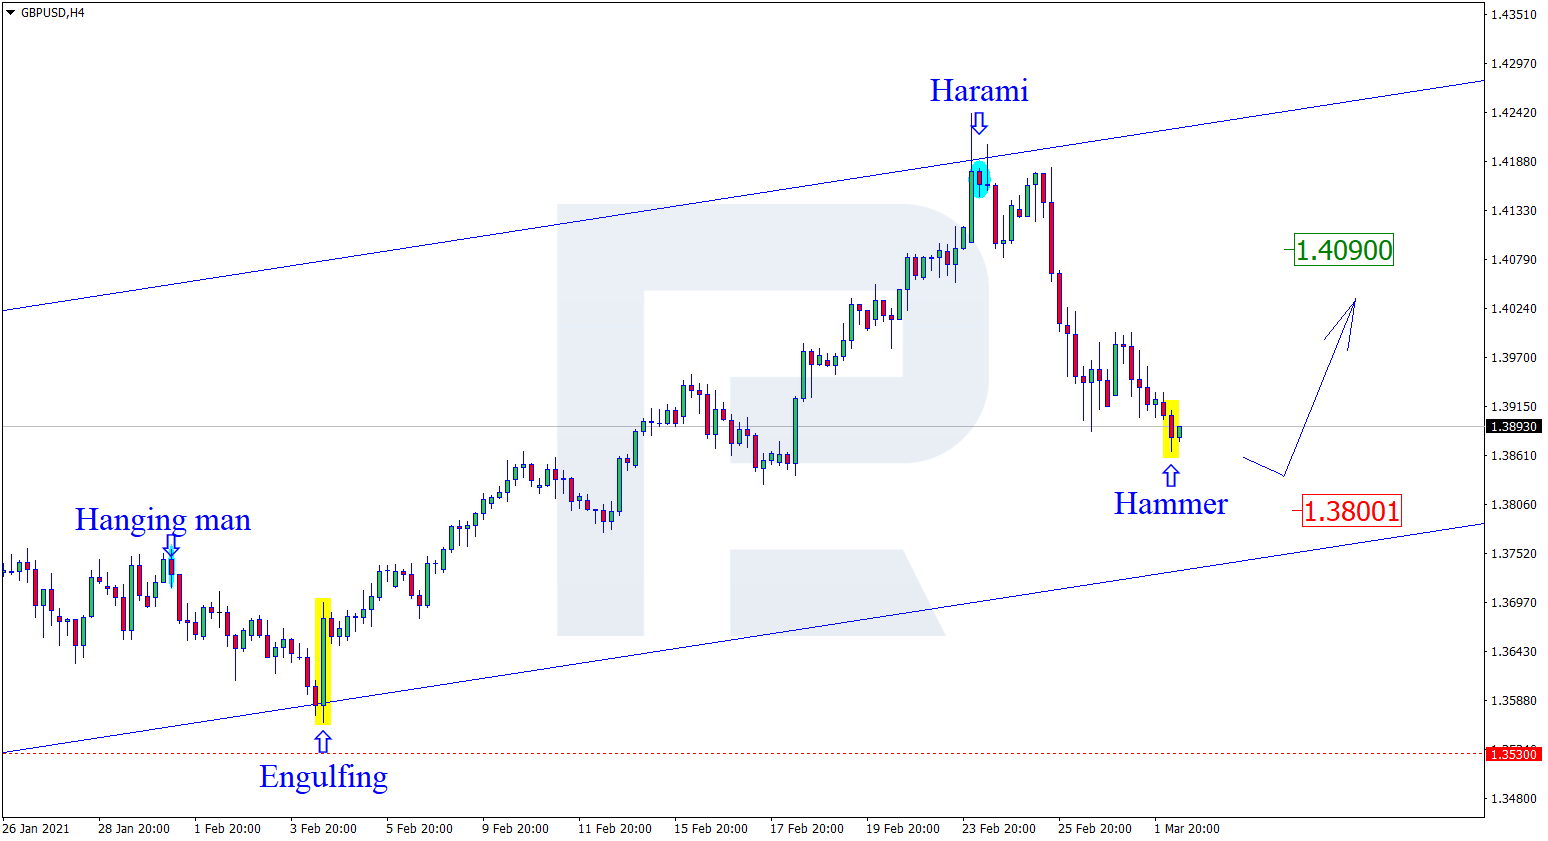
As we can see in the H4 chart, the asset is forming another correctional wave. Right now, after forming several reversal patterns, such as Hammer, not far from the support area, GBPUSD may correct and reach the resistance area at 1.4090. After that, the instrument may continue moving upwards. Still, there might be an alternative scenario, according to which the asset may fall to reach 1.3800 and test the channel’s downside border before resuming its growth.

GBPUSD

Article By RoboForex.com

Attention!
Forecasts presented in this section only reflect the author’s private opinion and should not be considered as guidance for trading. RoboForex LP bears no responsibility for trading results based on trading recommendations described in these analytical reviews.

Forex Technical Analysis & Forecast 02.03.2021

Article By RoboForex.com

EURUSD, “Euro vs US Dollar”

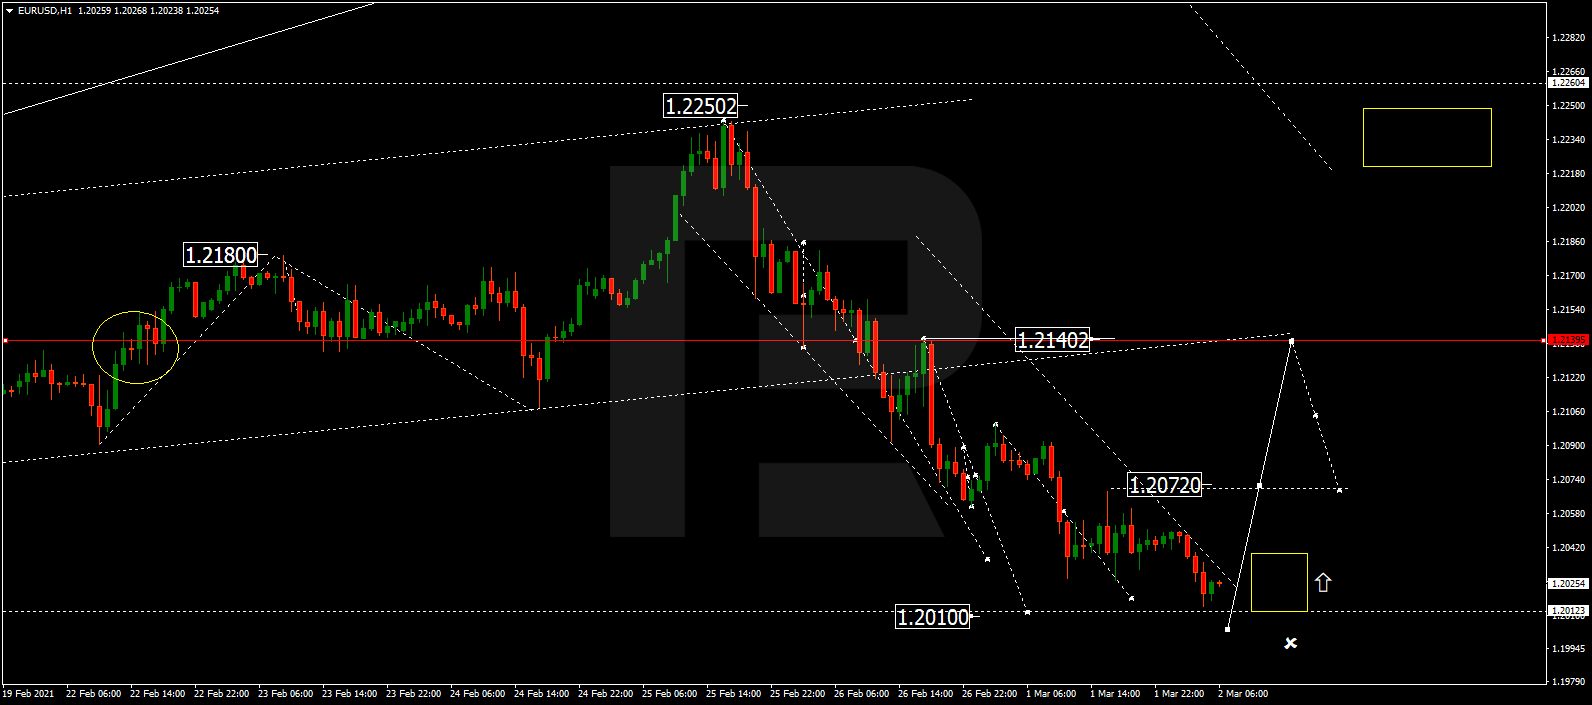
EURUSD continues the correction. Possibly, today the pair may reach 1.2010 and then form a new consolidation range near the current lows. Later, the market may break the range to the upside and form one more ascending structure to break 1.2070. After that, the instrument may continue trading upwards with the first target at 1.2140.

EURUSD
Risk Warning: the result of previous trading operations do not guarantee the same results in the future

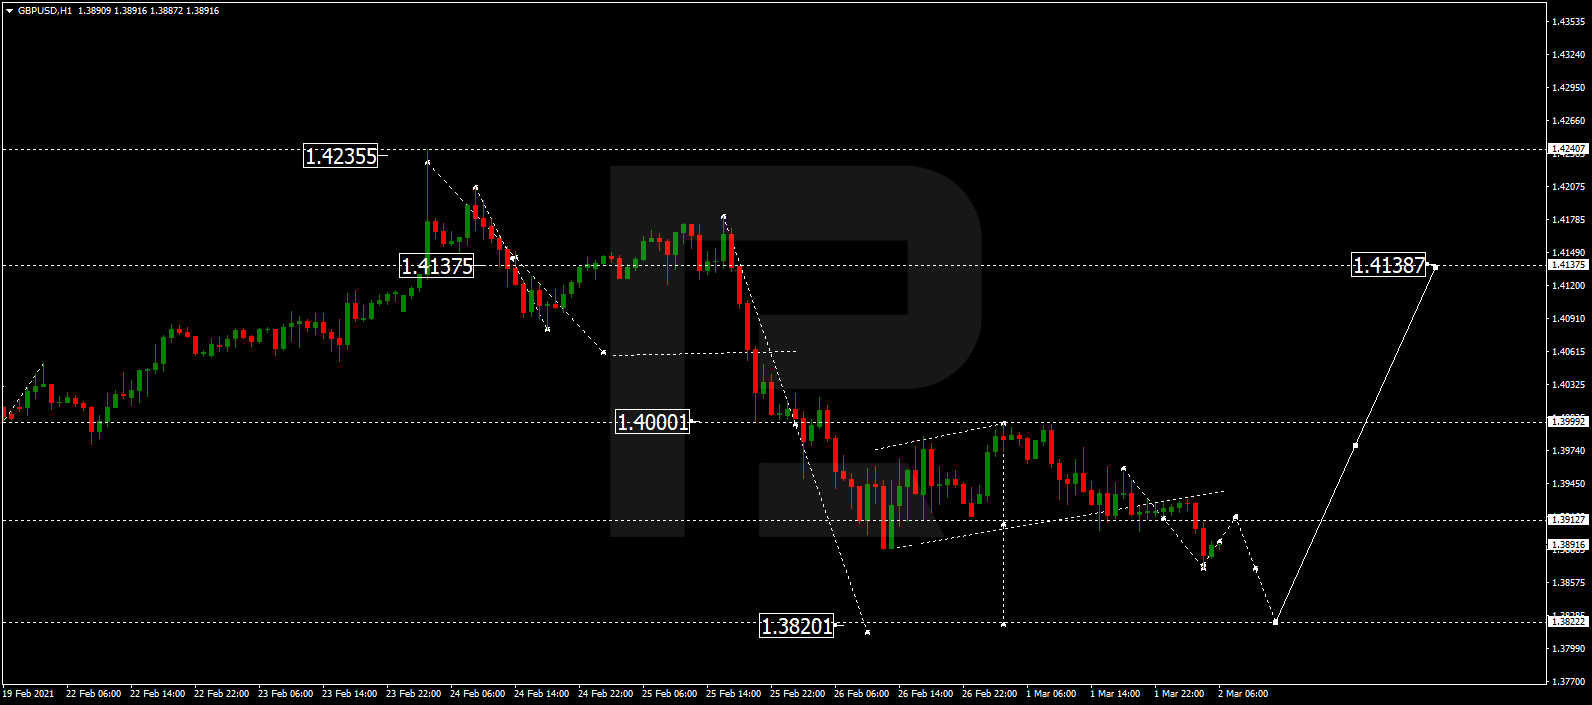
GBPUSD, “Great Britain Pound vs US Dollar”

GBPUSD is still consolidating near the lows. Possibly, the pair may expand the range 1.3820 to extend the correction. Later, the market may form the first ascending wave with the target at 1.4138.

GBPUSD
Risk Warning: the result of previous trading operations do not guarantee the same results in the future

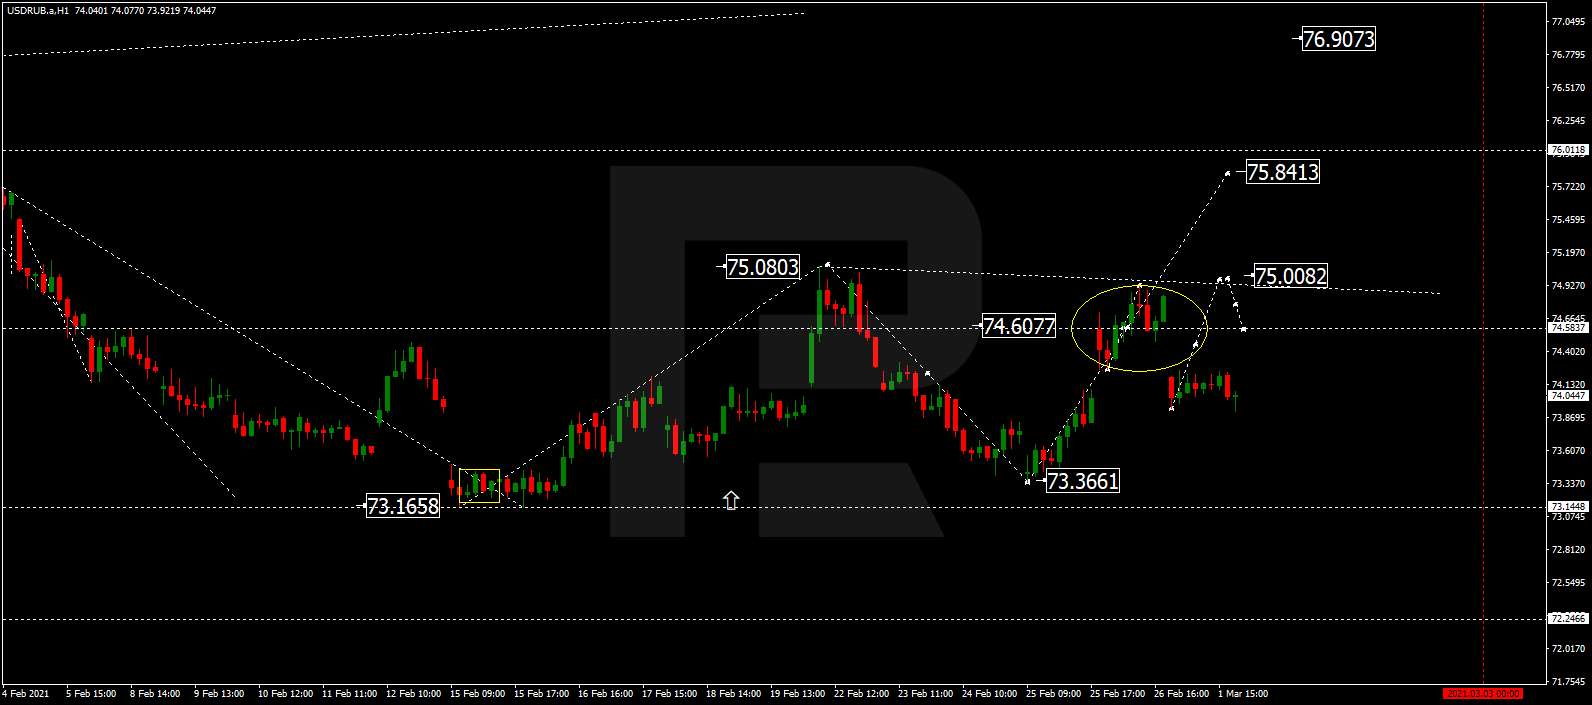
USDRUB, “US Dollar vs Russian Ruble”

USDRUB is still consolidating around 74.58. Today, the pair may grow to reach 75.00 and then fall to return to 74.58. If later the price breaks this range to the upside, the market may start another growth with the short-term target at 75.85.

USDRUB
Risk Warning: the result of previous trading operations do not guarantee the same results in the future

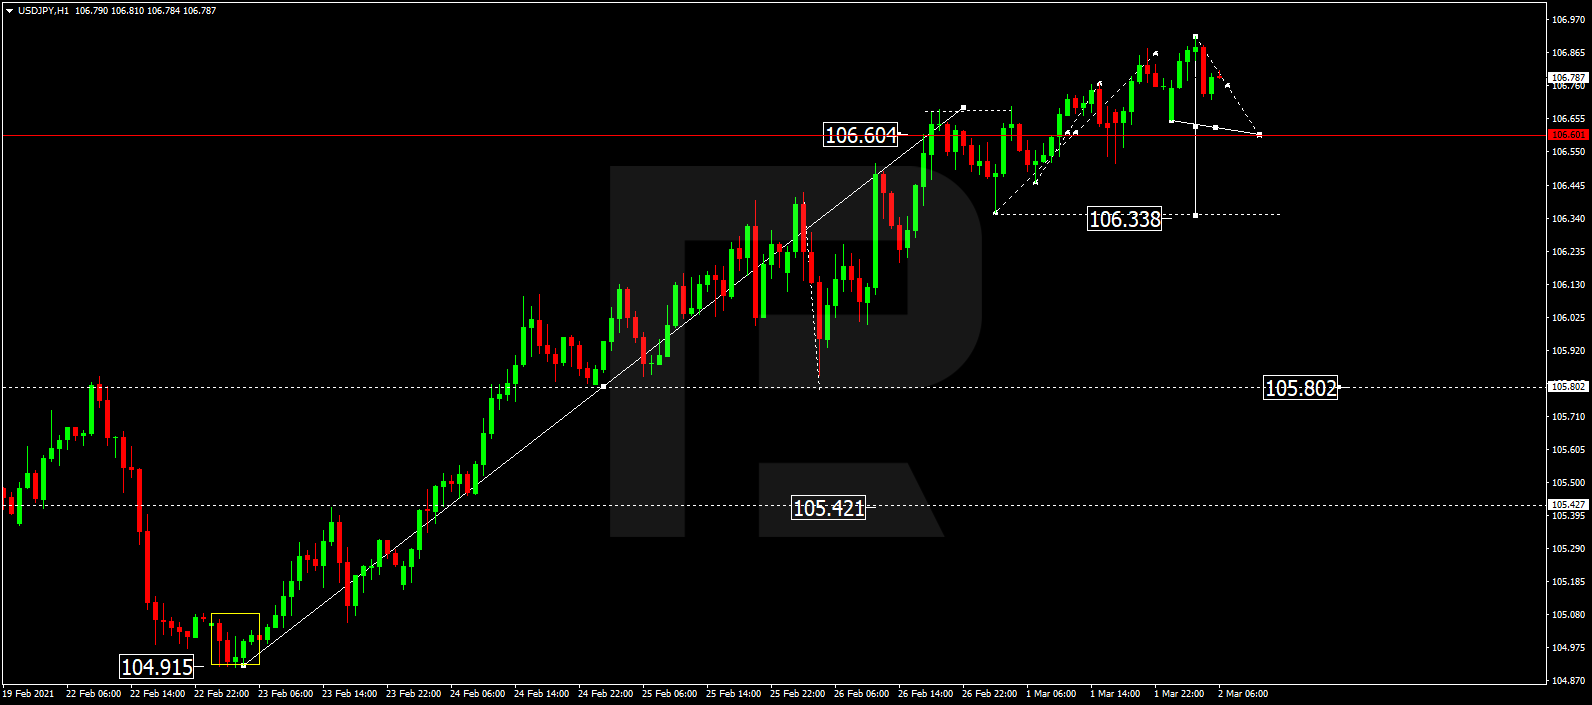
USDJPY, “US Dollar vs Japanese Yen”

USDJPY is still consolidating around 106.60. Possibly, today the pair may fall to reach 106.33 and then grow to return to 106.60. Later, the market may break the range to the downside and resume trading downwards with the first target at 105.80.

USDJPY
Risk Warning: the result of previous trading operations do not guarantee the same results in the future

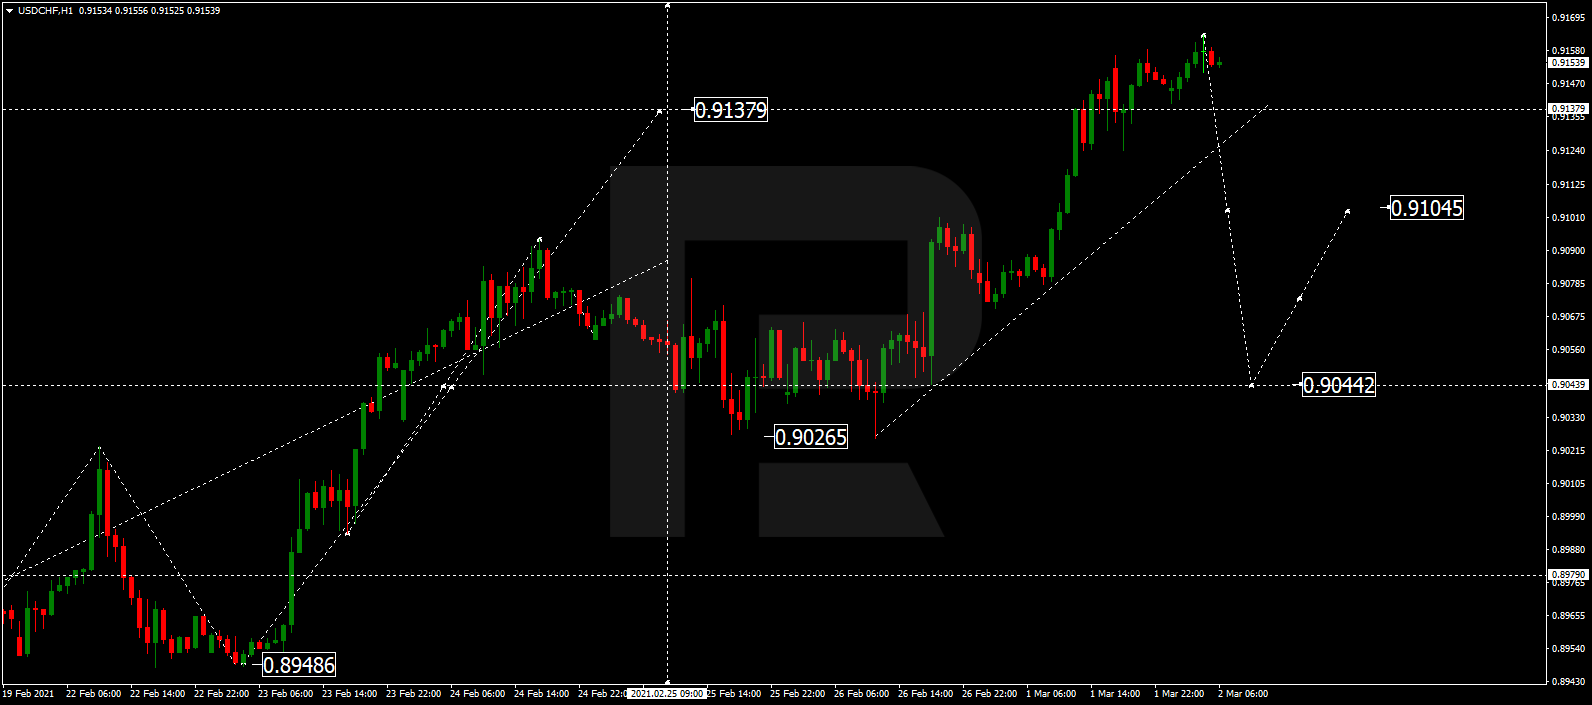
USDCHF, “US Dollar vs Swiss Franc”

USDCHF is still consolidating around 0.9140. Today, the par may break the range to the downside and then start a new decline with the first target at 0.9044.

USDCHF
Risk Warning: the result of previous trading operations do not guarantee the same results in the future

AUDUSD, “Australian Dollar vs US Dollar”

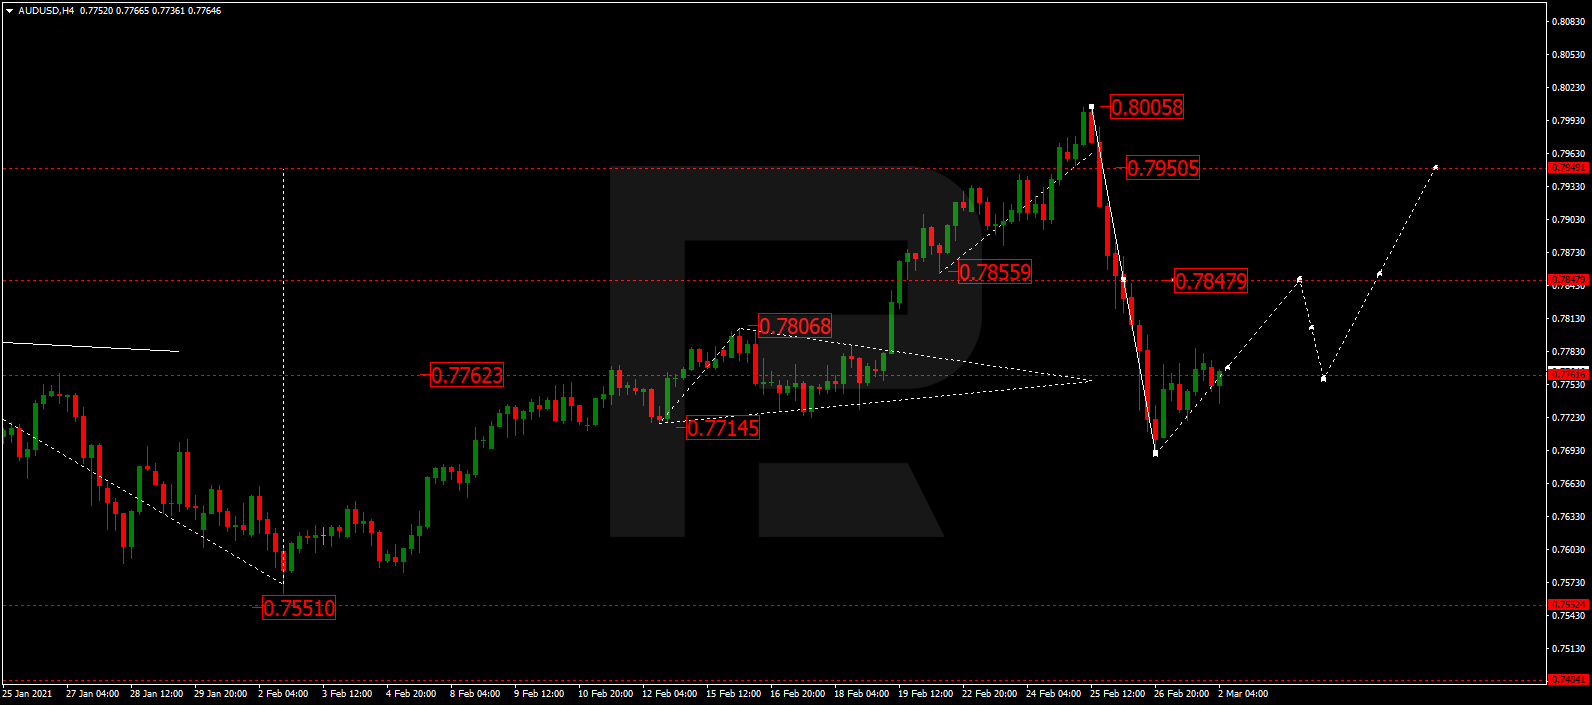
AUDUSD is moving upwards to reach 0.7848. After that, the instrument may start a new decline towards 0.7760 and then form one more ascending structure with the target at 0.7950.

AUDUSD
Risk Warning: the result of previous trading operations do not guarantee the same results in the future

BRENT

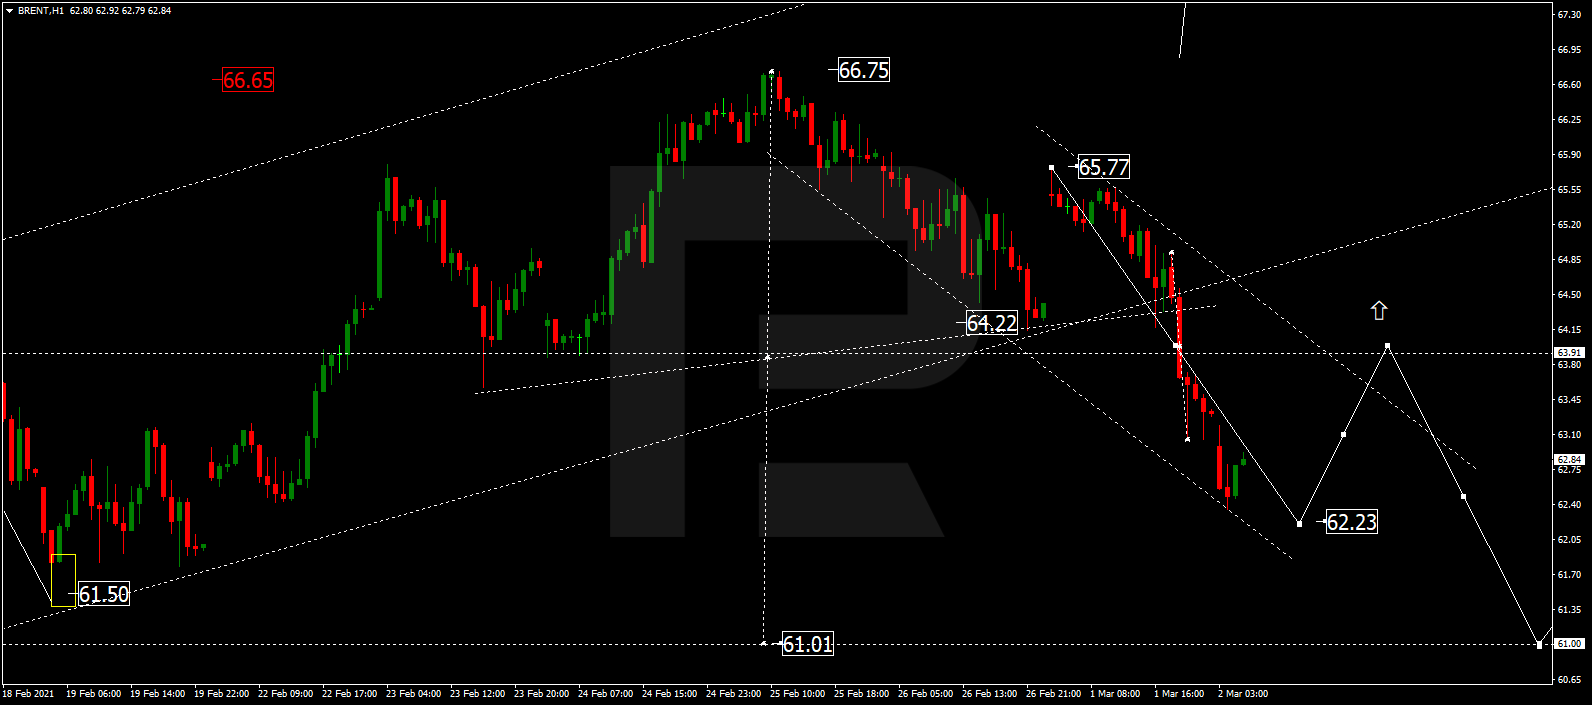
After breaking 64.00 to the downside, Brent is expected to correct with the short-term target at 62.22. Later, the market may form one more ascending structure to test 64.00 from below and then resume moving downwards with the target at 61.00.

BRENT
Risk Warning: the result of previous trading operations do not guarantee the same results in the future

XAUUSD, “Gold vs US Dollar”

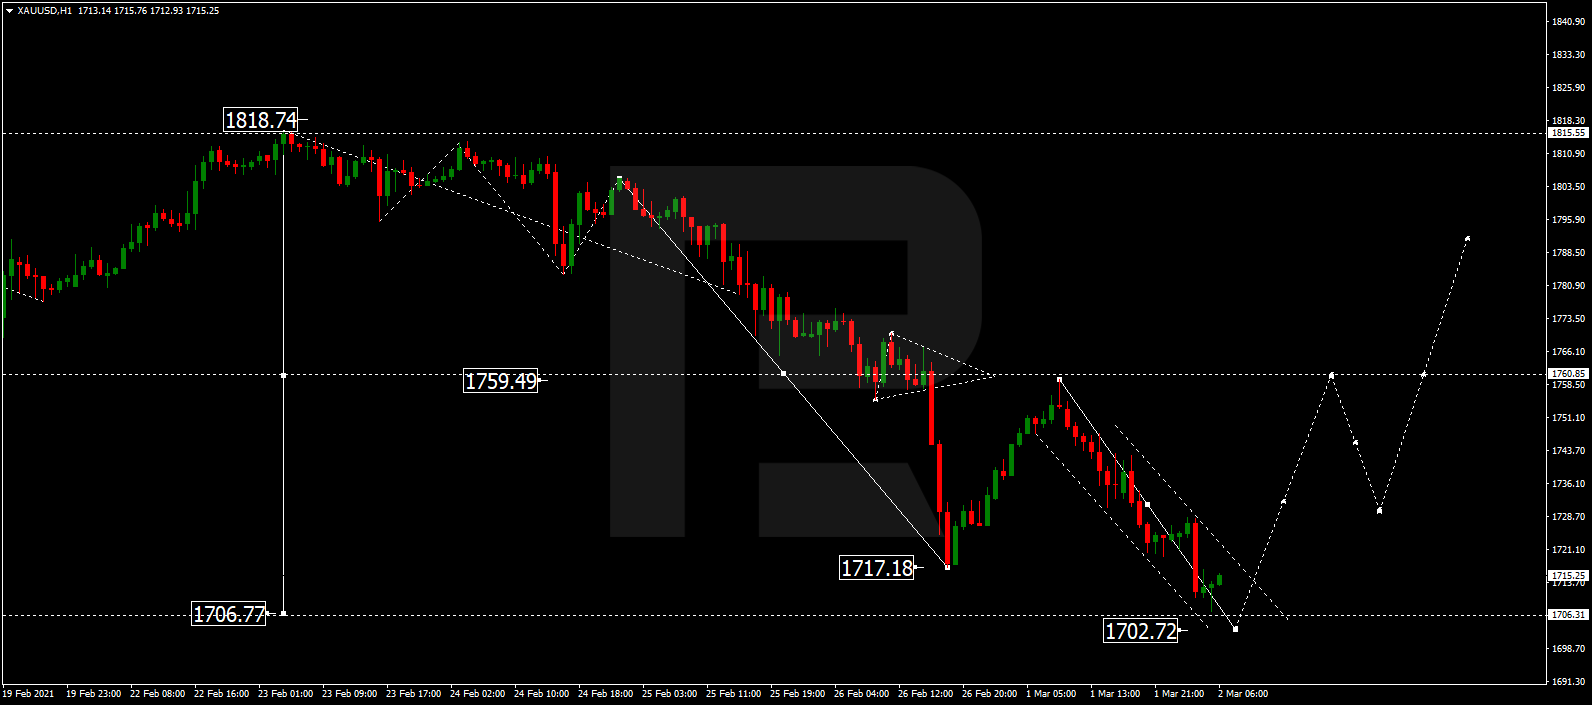
After rebounding from 1759.00, Gold is falling towards 1702.72. Possibly, the metal may reach 1700.00 to complete the descending wave. After that, the instrument may resume growing with the first target at 1760.00.

GOLD
Risk Warning: the result of previous trading operations do not guarantee the same results in the future

BTCUSD, “Bitcoin vs US Dollar”

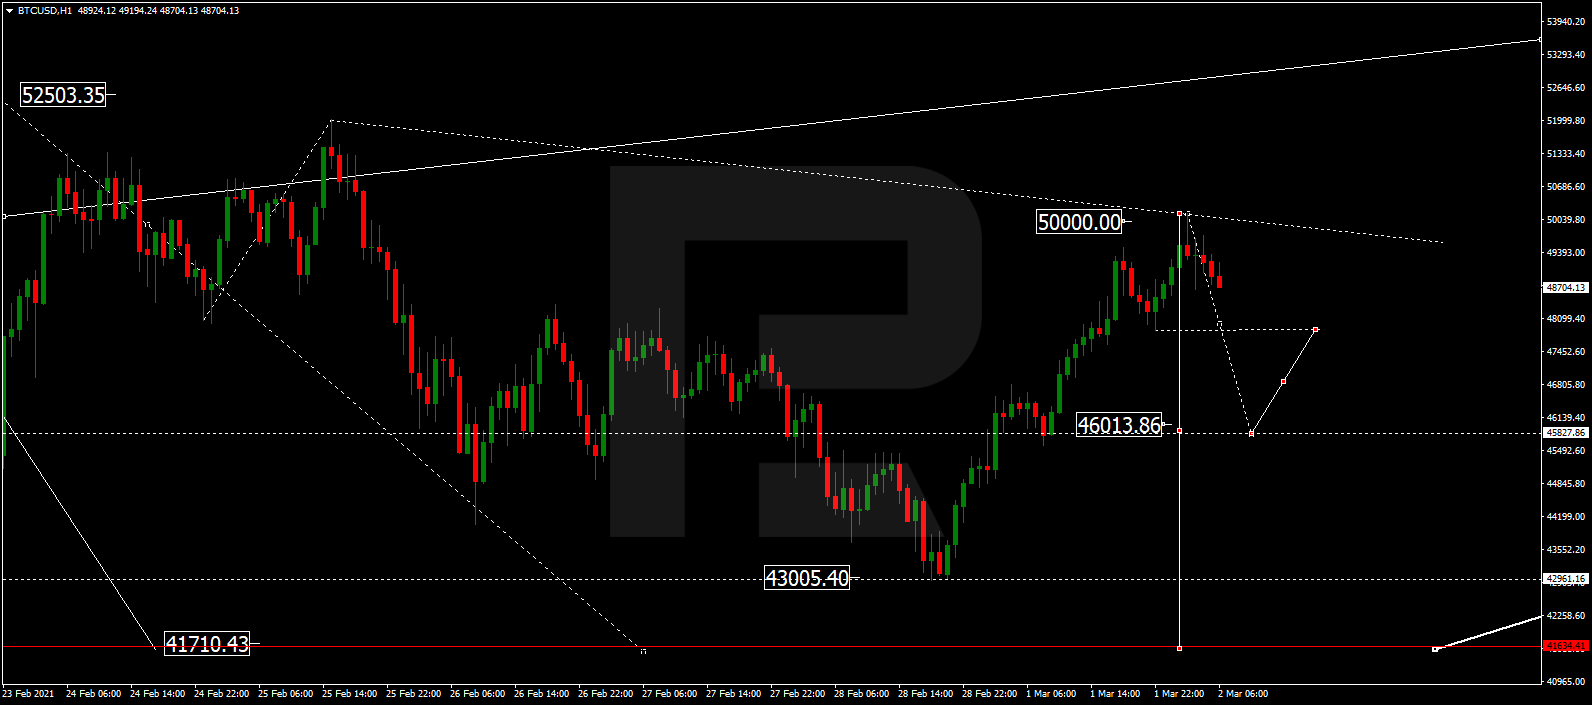
BTCUSD has finished the ascending wave at 50000.00 and may consolidate there. If later the price breaks this range to the downside, the market may resume trading downwards to reach 41700.00; if to the upside – start another growth with the target at 60000.00.

BITCOIN
Risk Warning: the result of previous trading operations do not guarantee the same results in the future

S&P 500

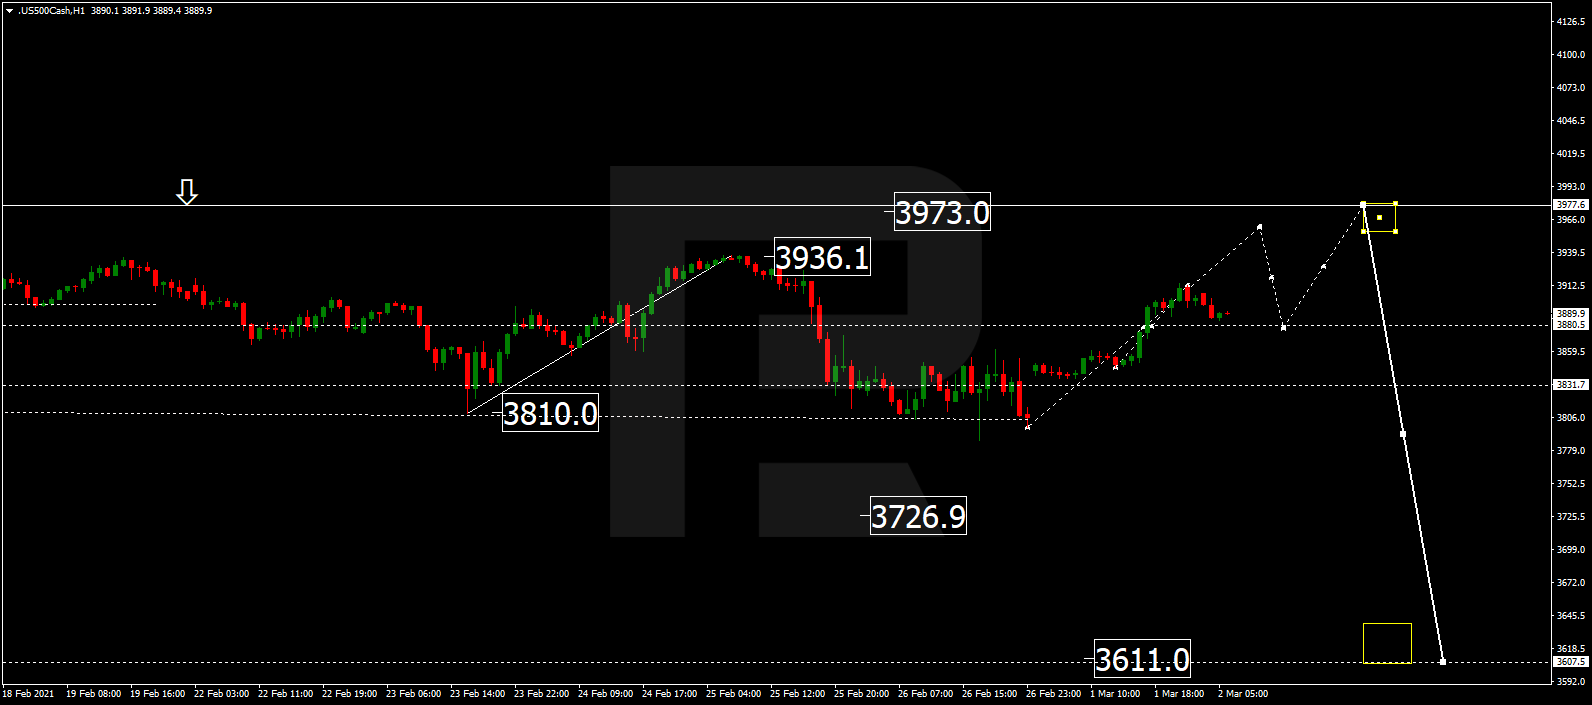
After breaking 3800.0 to the upside, the S&P index is expected to form the fifth ascending structure to reach 3973.0. Later, the market may resume trading downwards with the target at 3611.0.

S&P 500

Article By RoboForex.com

Attention!
Forecasts presented in this section only reflect the author’s private opinion and should not be considered as guidance for trading. RoboForex LP bears no responsibility for trading results based on trading recommendations described in these analytical reviews.

The home furnishing and accessory stock market – is investing a good idea?

Perfecting home interior design is considered more important than ever thanks to visual social media platforms like Pinterest and Instagram, as well as television programmes like Interior Design Masters and Kirsty and Phil’s Love it or List it. With that, home furnishing and accessory companies have become increasingly popular as people across the country aspire to perfect their homes like the professionals in the industry. It, therefore, comes as no surprise that there is profit to be made by investing shares in business within the industry. We’ll take a look at just some of the UK’s home businesses and what makes them so successful.

What drives the success of the interior design market?

Whether moving into a new home or revamping an existing one, houses have become much more than just a place to live, but rather, a warm, functional, and fashionable environment. Yet, this doesn’t come without its cost, and when re-evaluating your current home and planning for home improvements, other factors are likely to impact spending on home furnishings, which is often evidenced by Kirsty and Phil on television. Luckily, there are clever ways to save money which has in turn, allowed people to splurge a little more in home retailers.

Before tackling home retailers, a lot of people take advantage of remortgage comparison sites like Trussle to see if they can find a better mortgage that saves them pennies through improved interest rates. By doing this, homeowners pave their way to increased spending on interior design, as mortgages can often be the most expensive outgoing for your home. Equally, saving on energy bills can often prompt people to think about their interior design spend and can provide scope for a bigger budget. Via this strategic money-saving process, people are able to visit more home furnishing retailers of their choosing, and splurge out on home accessories, a few of which, we’ll look at below.

Dunelm

From kitchen accessories to bedroom décor, Dunelm, which was founded in 1979, is a popular home furnishing retailer in the UK for homeowners who don’t want to break the bank. With a revenue of around 1.1 billion, it’s no wonder this retailer has a stock price of 1,278.00 GBX, at the time of writing.

The White Company

Not only selling homeware, but clothing too, this company hit record sales in 2018, reaching around 2 million with a revenue of around 272 million. Kicking it up a notch, this company goes beyond Dunelm’s price-friendly home items by supplying a touch of luxury.

Oliver Bonas

Not too dissimilar to the White Company, Oliver Bonas was founded in 1993 and has since saturated high streets across the UK with 58 stores nationwide. Appealing to a modern customer, this store sells a range of home accessory items which rakes in a profit of around 3.4 million a year.

From a large organisation like Dunelm, to a slightly newer, up-and-coming business like Oliver Bonus, each retailer appeals to a customer out there. This makes investing in home retailers like these all the more worth it. Even more so, home accessories are more often than not considered as essential for the home, especially when moving home or revamping your current one, as they have the ability to add a personal touch and really turn a house into a home. That’s why the home furnishings market is such a smart place to invest.

By Taylor Wilman

The Analytical Overview of the Main Currency Pairs on 2021.03.02

by JustForex

The EUR/USD currency pair

Technical indicators of the currency pair:
  • Prev Open: 1.2071
  • Prev Close: 1.2048
  • % chg. over the last day: -0.19%

Trading on Monday was calmer than on Friday. The euro showed a gradual decline against the dollar in light of positive data from the US ISM. At the same time, the dollar index almost reached the SMA 100 moving average on the daily chart. From a technical point of view, this is a defining moment for the market. Further strengthening of the dollar and its consolidation above the moving average may indicate a change in the direction of the foreign exchange market in the long term.

Trading recommendations
  • Support levels: 1.2023, 1.1952
  • Resistance levels: 1.2179, 1.2222

The main scenario for trading EUR/USD is selling. Friday’s bearish momentum continued on Monday. The ADX is growing on the decline, which indicates the presence of significant bearish pressure. But amid a slowdown of the fall, convergence has formed on the MACD, which may indicate a temporary halt or pullback.

Alternative scenario: if the price manages to gain a foothold above the level of 1.2123, the pair may return to growth up to 1.2179.

EUR/USD
News feed for 2021.03.02:
  • – Unemployment Change in Germany (Feb) at 10:55 (GMT+2);
  • – The Eurozone Consumer Price Index (CPI) (y/y) (Feb) at 09:00 (GMT+2);
  • – The FOMC Member Governor Lael Brainard Speech at 20:00 (GMT+2).

The GBP/USD currency pair

Technical indicators of the currency pair:
  • Prev Open: 1.3925
  • Prev Close: 1.3922
  • % chg. over the last day: -0.02%

On Monday, the bulls were unable to take over. The intraday growth was completely erased in the American session. The profitability of the British Gilts showed the first significant decline in the last five days. Although the pair closed with only slight losses, it left a long shadow at the top, which indicated the prevalence of bearish influence.

Trading recommendations
  • Support levels: 1.3819, 1.3775
  • Resistance levels: 1.3997, 1.4224

The main scenario for trading GBP/USD is selling. After the pullback on Monday, the decline was resumed with consolidation below the first support level. However, the ADX is hardly responsive. On the MACD, in the event of another rollback, a divergence may form. As a result, a decline is expected, but the trend may be slower.

Alternative scenario: if the pair consolidates above 1.3997, it may resume its growth.

GBP/USD
There is no news feed for today.

The USD/JPY currency pair

Technical indicators of the currency pair:
  • Prev Open: 106.53
  • Prev Close: 106.75
  • % chg. over the last day: +0.21%

The dollar-yen pair continues to grow steadily following the dollar index. At the same time, the pair has received additional support from the stock market, where positive trends are observed. Although the slowdown in growth is easy to notice, there are no signs of a reversal so far.

Trading recommendations
  • Support levels: 105.50, 104.92
  • Resistance levels: 106.94, 107.50

The main scenario is trading in a sideways range between 106.94 – 106.31. In the short term, the pair may stop or go for a correction, as divergence has formed on the MACD, and the ADX has fallen. But it is too soon to talk about selling. The H4 and D1 timeframes indicate growth over the medium term.

The alternative scenario implies the price-fixing below 106.30. In this case, the pair may return to decline to 105.50. A breakout of 106.94 could indicate further gains.

USD/JPY
News feed for 2021.03.02:
  • – The FOMC Member Governor Lael Brainard Speech at 20:00 (GMT+2).

The USD/CAD currency pair

Technical indicators of the currency pair:
  • Prev Open: 1.2727
  • Prev Close: 1.2642
  • % chg. over the last day: -0.67%

On Monday, there was a pullback after Friday’s strong north impulse. But it is too soon to talk about further decline. The oil market suddenly went down, allowing the pair to grow in the Asian session. The H4 timeframe shows a small pullback.

Trading recommendations
  • Support levels: 1.2608, 1.2467
  • Resistance levels: 1.2745, 1.2763

The main scenario is cautious buying. Technically, the pair is showing a mid-term north direction, but the movement may be limited by the first resistance level. The MACD is still near zero, and the ADX has suddenly reacted to the southern pullback. At the same time, the price is above the moving averages. Mixed technical indicators show a slowdown in growth or a temporary halt in price movement.

Alternative scenario: if the price manages to consolidate below 1.2608, the pair may resume its decline to 1.2450.

USD/CAD
News feed for 2021.03.02:
  • – The GDP of Canada (q/q) (4q) at 15:30 (GMT+2);
  • – The FOMC Member Governor Lael Brainard Speech at 20:00 (GMT+2).

by JustForex


This article reflects a personal opinion and should not be interpreted as an investment advice, and/or offer, and/or a persistent request for carrying out financial transactions, and/or a guarantee, and/or a forecast of future events.

The global vaccine race against time and variants

By Dan Steinbock

– Despite pandemic fatigue and complacency in too many countries, vaccine inequality will penalize poorer economies, which are also likely to prove more vulnerable to new variants.

In the past month or two, too many countries struggling with COVID-19 have been lulled into fatigue and complacency, despite holiday spikes. Since vaccination drives have begun, the assumption is that pandemic challenge is pretty much behind.

Both assumptions are flawed. Vaccine drives in emerging and developing economies will occur significantly later than in advanced economies. And by then, new variants may test vaccine effectiveness.

The net effect? When high-income economies will eventually open their borders, middle-income economies will be exposed to new strains that could prove more contagious, more protracted and more lethal. And the vulnerability of low-income economies will prove even higher.

Vaccine inequality penalizes poorer economies

In early February, or two months into the global rollout of coronavirus vaccines, a handful of high-income economies in the West had hoarded 80 percent of the vaccination doses used thus far. There were almost 130 countries with 2.5 billion people that had not been able to administer even a single dose.

The disparity is far greater if China, an upper-middle-income nation, is excluded. In that case, middle-income nations represent nearly half of global coronavirus cases, but just 17 percent of doses administered.

In economies of more than 50 million people, two high-income economies, United States and United Kingdom, have been most active in hoarding vaccines, after each mismanaged the pandemic. They are followed by Turkey, Germany, EU, Italy, and France. Except for Turkey, most middle-income countries come only thereafter, including China, Russia, Bangladesh, Mexico, India and so on (Figure 1).

Figure 1 COVID-19 Vaccine Doses*

* Cumulative COVID-19 vaccination doses administered per 100 people Feb. 26, 2021

Source: Official data collated by Our World in Data

New variants could prolong the crises

Thanks to the failure of multilateral cooperation in the course of the global pandemic, the number of COVID-19 cases and deaths is far higher than initially anticipated. In turn, huge numbers contribute to the rising probability of adverse strains.

In recent months, new variants of the original virus have been spotted in several countries, including UK, Brazil, South Africa, and the US.

In December, scientists in the U.K. stated that the B.1.1.7 variant might be at least 50% more transmissible than the original one in Wuhan. Another variant of great concern is the mutation in South Africa because it seems to involve a genetic change that may help the virus evade the immune system and vaccines.

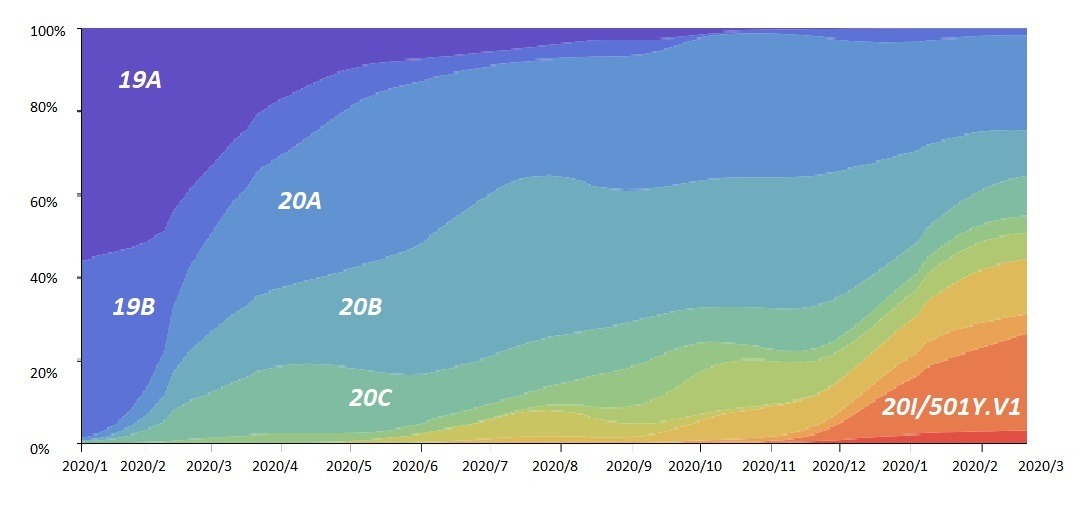
In January 2020, when the epicenter was still in Wuhan, the sequence 19A dominated existing cases. By March, new mutations had spread in the UK, US and elsewhere (19B and 20A etc.). After half a dozen other major strains, the British variant B.1.1.7 (also known as 20I/501Y.V1 as in the figure) is surging (Figure 2).

Figure 2 Genomic epidemiology of novel coronavirus

Frequencies of viral clades of SARS-CoV-2, Jan 2020–Feb 2021
Source: NextStrain; DifferenceGroup.

The nightmare scenario   

In a few months’ time, the proportions may look very different, again. The British variant has surged in just two to three months. Even in countries that lead vaccination drives, critical mass will take months to achieve. Consequently, the frequencies of these viral clades may look very different by summer or fall 2021.

According to latest research, a Californian variant CAL2.0C has surged to account for more than half the cases in the state. By the end of March, it could cover 90% of Californian cases. Reportedly, infections from this variant, already detected in other US states, seem to produce a viral load double that of other variants.

The UK and California variants are each armed with enhanced capabilities. The concern is a nightmare scenario in which the two viruses could meet in a single person, and swap mutations. The outcome could be an even more dangerous strain.

The longer the global pandemic will last, the greater is the probability of more transmissible and lethal variants. Moreover, poorer economies are likely to remain more vulnerable to consequent human costs and economic damage.

Global COVID-19 cases exceed 115 million and deaths almost 2.6 million. Despite deceleration, daily new cases amount to 400,000 and daily deaths over 9,000 (7-day moving average).

The vaccine race is against time and variants – and time is not yet on our side.

About the Author:

Dr. Dan Steinbock is an internationally recognized strategist of the multipolar world and the founder of Difference Group. He has served at the India, China and America Institute (USA), Shanghai Institutes for International Studies (China) and the EU Center (Singapore). For more, see https://www.differencegroup.net 

The growth of the dollar index continues against the background of positive data from the manufacturing sector

by JustForex

On Monday, the foreign exchange market lost Friday’s synchronicity. If the European currencies were decreasing against the dollar, commodities were growing. Nevertheless, the dollar index was close to the daily moving average SMA 100 at 91.30. The market is keeping a close eye on this mark, as in the case of fixing the indicator above, there will be a signal to the market reversal.

The dollar continues to be supported by a fundamental background. There was data from the ISM manufacturing sector that gave rise to positive expectations for the labor market. The business activity index increased to 60.8 in February from 58.7 in January, exceeding market expectations of 58.8. The indicators point to the strongest growth in production activity since February 2018. New orders rose to 64.8 from 61.1 a month earlier. The employment index increased to 54.4 against 52.6, and the new export orders showed 57.2 against 54.9.

Supplies remain a problem in the sector. This indicator rose to 72 against 68.2. The price pressure also increased: 86 against 82.1, which is the highest indicator since July 2008. According to ISM Chairman Timothy R. Fiore, problems due to work constraints, short-term breaks for disinfection of facilities, and difficulties in hiring workers continue to cause tensions that limit the growth potential of production.

The market positively reacted to the data. American treasuries yield increased slightly and stabilized at about 1.43%. In Australia, bond yields rose after the central bank left its asset purchase plan unchanged. The stock market has increased slightly, although trading was varying. The Dow Jones and S&P 500 added about 2%. But in the Asian session, there is a decline again.

Investors continue to argue about whether the government and central bank stimulus is excessive. The possibility of accelerating inflation as the global economy recovers has raised fears that monetary policy may need to be tightened sooner than expected. This has led to the rising of sovereign bond yields this year and stopping the bullish rally on stock exchanges.

Main market quotes:

S&P 500 (F) 3,881.50 -17.25 (-0.44%)

Dow Jones 31,535.51 +603.14 (+1.95%)

DAX 14,025.82 +13.00 (+0.09%)

FTSE 100 6,610.75 +22.22 (+0.34%)

USD Index 91.260 +0.224 (+0.25%)

Important events:
  • – RBA Interest Rate Decision (Mar) at 02:30 (GMT+2);
  • – Germany Unemployment Change (Feb) at 10:55 (GMT+2);
  • – Eurozone CPI (y/y) (Feb) at 09:00 (GMT+2);
  • – Canadian GDP (q/q) at 15:30 (GMT+2);
  • – FOMC Member Brainard Speech at 20:00 (GMT+2).

by JustForex


This article reflects a personal opinion and should not be interpreted as an investment advice, and/or offer, and/or a persistent request for carrying out financial transactions, and/or a guarantee, and/or a forecast of future events.

Technical Outlook: EURUSD poised to breach 1.20

By Lukman Otunuga Research Analyst, ForexTime

The euro is not looking too pretty this morning. 

It has weakened against the dollar and Japanese yen but gained some ground against the New Zewland dollar. Over the past few weeks, the EURUSD has found itself within a very wide range with resistance at 1.2200 and support at 1.2000. Given how prices have cut below the 100 Simple Moving Average and pressing down fiercely against the 1.2000, the path of least resistance certainly points south.


The technicals swing in favour of bears on the daily timeframe. Prices are trading well below the 20 & 50 Simple Moving Average while the MACD trades to the downside. A solid daily close below 1.2000 could inspire a decline towards 1.9500 and 1.1920. Should 1.2000 prove to be reliable support, a rebound back towards 1.2050 and 1.2130 could be on the table.


Although the technicals are turning increasingly bearish, the fundamentals could still throw a proverbial wrench in the works for sellers. Later this morning, the Eurozone inflation reading and Germany’s unemployment rate will be published. Markets are expecting inflation to hold steady at 0.9% while the core reading is forecast to cool from 1.4% to 1.1%. The unemployment rate in Europe’s largest economy to projected to hold steady at 6%, unchanged from January. 

Back to the technicals…

It is a different story on the weekly charts for the EURUSD. Prices respecting a bullish weekly channel and there have been consistently higher highs and lows. This is bull territory with bears under threat if prices trade back above 1.2150. A strong weekly close below 1.2000 could give the thumbs up for sellers to target 1.1900 and 1.1700. 


1.20 pivotal on monthly timeframe 

It is safe to say that the EURUSD remains bullish on the monthly timeframe. Prices are trading above the 100 SMA while the Relative Strength Index has yet to hit overbought levels above 70.00. If 1.2000 can hold the fort and keep bears out, prices could rebound back towards 1.2348. However, a solid monthly close below 1.2000 is likely to spell trouble for the bullish trend with the next key point of interest around 1.1600.


Disclaimer: The content in this article comprises personal opinions and should not be construed as containing personal and/or other investment advice and/or an offer of and/or solicitation for any transactions in financial instruments and/or a guarantee and/or prediction of future performance. ForexTime (FXTM), its affiliates, agents, directors, officers or employees do not guarantee the accuracy, validity, timeliness or completeness, of any information or data made available and assume no liability as to any loss arising from any investment based on the same.


Forex-Time-LogoArticle by ForexTime

ForexTime Ltd (FXTM) is an award winning international online forex broker regulated by CySEC 185/12 www.forextime.com

The arrival of Spring and the vaccination process encourages the tourism sector

By Admiral Markets

Since the beginning of the pandemic, the worst-hit sector has undoubtedly been the tourism sector, dragging the main airlines to trade at seriously lows, causing problems in the viability of many of these companies.

The pandemic and the measures taken to stop its expansion at a global level, caused a drastic decrease in the number of flights, with only light during the summer months, which caused heavy losses in many companies. So giants like Air France KLM have been forced to ask for public aid, receiving bailouts after losing 7.1 billion euros in 2020.

Other companies such as IAG, chose to carry out a capital increase in order to shore up their solvency and liquidity levels without the need to request any rescue. Even strong companies, such as the holding which unites Iberia and British Airways lost 6.92 billion euros compared to a profit of 1.715 million during 2019.

Despite this, the beginning of the vaccination process and the arrival of the end of winter in Europe is encouraging this sector. Over the last few days, we have seen strong rises in financial markets, as expectations for the future and optimism floods the markets after the United Kingdom announced that from May it would allow its citizens to travel abroad.

IAG Analysis

IAG held up best in recent months, thanks to the significant volume of liquidity it had during the past year, due to the capital increase it carried out last September.

Technically speaking, over the last year, it has been heavily punished, setting lows below even 90 GBX, but after experiencing a recovery during the month of November, the price has moved through a wide lateral range.

Last February, it experienced a sharp rise which led it to finally exceeding the high band of the channel in green, after exceeding 200 GBX per share and its average of 200 sessions, which gives it wings to search your next level of resistance.

Source: IAG daily chart of Admiral Markets MetaTrader 5 platform from October 25, 2019 to March 1, 2021. Taken on March 1 at 12:55 CET. Note: Past performance is not a reliable indicator of future results, or future performance.

Price evolution of the last 5 years:

  • 2020: -61.40%
  • 2019: 1.20%
  • 2018: -5.07%
  • 2017: 47.65%
  • 2016: -27.78%

 Air France-KLM Analysis

If we look at the daily chart of this company, we can see how after marking a minimum on October 30, the price began an upward trend that led it to exceed its average of 200 sessions, forming at that time a formation of triangular consolidation.

After the rebound in recent days, the price has managed to break up this formation, exceeding last November’s highs, opening the doors for the price to seek its next resistance level of 6.48 euros per share. The breaking of this level could give wings to this company to seek new highs around 8 euros per share.

Source: Air France-KLM daily chart from Admiral Markets MetaTrader 5 platform from November 5, 2019 to March 1, 2021. Taken on March 1 at 1:00 p.m. CET. Note: Past performance is not a reliable indicator of future results, or future performance.

Price evolution of the last 5 years:

  • 2020: -48.41%
  • 2019: 4.68%
  • 2018: -30.19%
  • 2017: 162.47%
  • 2016: -26.30%

Deutsche Lufthansa Analysis

If we focus on Lufthansa, we can see that in 2020 it suffered a sharp decline from €15 per share in February to a yearly low of around €6.80 per share. During the last quarter, after the announcement of the Pfizer and Moderna vaccines, its price began an upward trend following a channel formation, which has led not only to its 200-session moving average, but also to seeing it exceed the level.

The good prospects for the future and the overcoming of these resistance levels, open the door for the price to continue with its upward trend, although we must be attentive to its behaviour when reaching the upper band of the bullish channel, since it could do a downward bounce to seek support at its 18-session moving average which is currently its first support level.

Source: Lufthansa daily chart from Admiral Markets MetaTrader 5 platform from November 7, 2019 to March 1, 2021. Taken on March 1 at 1:10 p.m. CET. Note: Past performance is not a reliable indicator of future results, or future performance.

Price evolution of the last 5 years:

  • 2020: -34.10%
  • 2019: -16.70%
  • 2018: -35.87%
  • 2017: 150.36%
  • 2016: -15.75%

With the Admiral Markets Trade.MT5 account, you can trade Contracts for Differences (CFDs) of IAG, Air France-KLM, Lufthansa, and more than 3000 stocks! CFDs allow traders to try to profit from the bull and bear markets, as well as the use of leverage. Click on the following banner to open an account today:

Trade With MetaTrader 5

INFORMATION ABOUT ANALYTICAL MATERIALS:

The given data provides additional information regarding all analysis, estimates, prognosis, forecasts, market reviews, weekly outlooks or other similar assessments or information (hereinafter “Analysis”) published on the websites of Admiral Markets investment firms operating under the Admiral Markets trademark (hereinafter “Admiral Markets”) Before making any investment decisions please pay close attention to the following:

  1. This is a marketing communication. The content is published for informative purposes only and is in no way to be construed as investment advice or recommendation. It has not been prepared in accordance with legal requirements designed to promote the independence of investment research, and that it is not subject to any prohibition on dealing ahead of the dissemination of investment research.
  2. Any investment decision is made by each client alone whereas Admiral Markets shall not be responsible for any loss or damage arising from any such decision, whether or not based on the content.
  3. With view to protecting the interests of our clients and the objectivity of the Analysis, Admiral Markets has established relevant internal procedures for prevention and management of conflicts of interest.
  4. The Analysis is prepared by an independent analyst, Roberto Rojas (analyst), (hereinafter “Author”) based on their personal estimations.
  5. Whilst every reasonable effort is taken to ensure that all sources of the content are reliable and that all information is presented, as much as possible, in an understandable, timely, precise and complete manner, Admiral Markets does not guarantee the accuracy or completeness of any information contained within the Analysis.
  6. Any kind of past or modeled performance of financial instruments indicated within the content should not be construed as an express or implied promise, guarantee or implication by Admiral Markets for any future performance. The value of the financial instrument may both increase and decrease and the preservation of the asset value is not guaranteed.
  7. Leveraged products (including contracts for difference) are speculative in nature and may result in losses or profit. Before you start trading, please ensure that you fully understand the risks involved.

By Admiral Markets

Nasdaq 100 soars back above 50-SMA

By Han Tan Market Analyst, ForexTime

A week ago today (23 Feb), I wrote this about the Nasdaq 100 minis:

“Tech stock fans can take heart that previous forays below the 50-SMA have proved fleeting; such has been the resilience of tech stocks.”

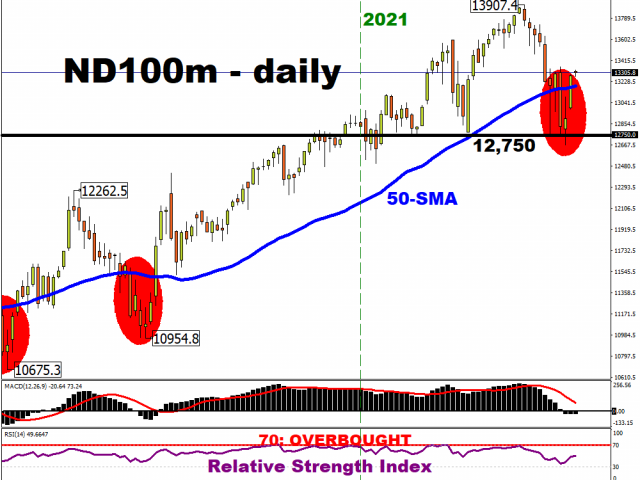
Sure enough, tech stocks have roared back with a vengeance, sending the Nasdaq 100 back above its 50-day simple moving average (SMA) once more, after enduring a bruising selloff last week.

On Monday, the tech-heavy index surged 2.89% to register its best day since 4 November, the day after the US presidential elections. This tech benchmark also fared better than the S&P 500 (+2.38%) and the Dow Jones index (+1.95%) yesterday, as investors restored the 2021 gains for the Nasdaq 100. The information technology sector was also the best-performing sector on the S&P 500 yesterday, powering this benchmark for US stocks to its best day since June!

And fans of Big Tech also seized on the opportunity to pump these megacaps higher:


Why the tech comeback?

With tech stocks bearing the brunt of the stocks selloff last week to post its worst week since October, Monday’s price action suggests that the “buy the dip” mantra is still alive and kicking.

Also, investors appear to have shrugged off the threat of rising Treasury yields, at least for now. This is set to be a risk that market participants will have to be mindful off, until there is certainty as to when the Fed signals that they’ll be easing up on their asset-purchasing programme.

Despite the recent market volatility, the fundamentally bullish case for stocks remains intact.

The US economic recovery that’s further enabled by more fiscal stimulus and the continued spread of the Covid-19 vaccine should spell more upside for equities, as long as the Fed doesn’t signal a premature letting up of its policy support.

Tech still expected to lag other sectors

Still, it’s important to note that investors had been rotating away from the more expensive tech stocks and increased their exposure to other sectors that stand to benefit from more injections of US fiscal stimulus. Such a shift becomes more obvious when comparing the Nasdaq 100’s year-to-date gain of 3.06%, compared to the S&P 500’s advance of 3.88% for the same period.

Should the reflation trade keep up, the tech sector is expected to continue relinquishing its leadership in propelling US equities higher, a role it had performed to great effect since the height of the pandemic.

It’s high time for value and cyclical stocks to lead the pack and ride on the tailwinds of the economic recovery.

How are US tech stocks set to perform on Tuesday?

With 10-year Treasury yields appearing to have stabilized just above the 1.40% level, stock market bulls are set to take advantage of the relative calm. After all, the VIX index, which is also know as Wall Street’s “fear” gauge, has moderated closer towards the 20 mark on Monday, having notably breached the 30 line in the latter parts of last week.

At the time of writing, the Nasdaq 100 futures are relatively steady, which hints at a slight pause for tech stocks when US markets open today; perhaps a breather after yesterday’s runup.


Disclaimer: The content in this article comprises personal opinions and should not be construed as containing personal and/or other investment advice and/or an offer of and/or solicitation for any transactions in financial instruments and/or a guarantee and/or prediction of future performance. ForexTime (FXTM), its affiliates, agents, directors, officers or employees do not guarantee the accuracy, validity, timeliness or completeness, of any information or data made available and assume no liability as to any loss arising from any investment based on the same.


Forex-Time-LogoArticle by ForexTime

ForexTime Ltd (FXTM) is an award winning international online forex broker regulated by CySEC 185/12 www.forextime.com

Technical Outlook: G10 Currencies In Focus

By Lukman Otunuga Research Analyst, ForexTime

Over the past few days, we have been talking about bond markets, soaring yields, the great reflation trade, and other key developments moving markets.

Today, our focus will be directed towards the G10 space and our weapon of choice…technical analysis.

Dollar rebound or dead cat bounce?

Last Friday, we questioned whether the Dollar was experiencing a dead cat bounce.

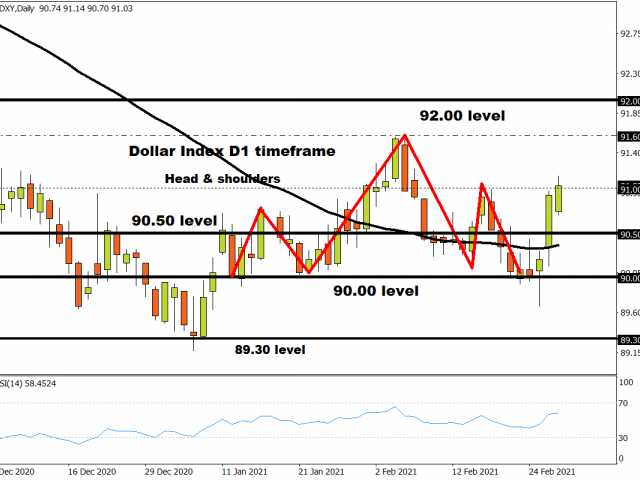
After flirting around the 50-day simple moving average (SMA) for weeks, the Dollar Index pushed higher thanks to rising US Treasury yields. Prices are trading marginally below the 91.00 level while the MACD is flat. Interestingly, the Relative Strength Index (RSI) is venturing towards 70.00 – overbought territory. A solid close above 91.00 could open a path towards 91.60 and 92.00. A decline back below 90.50 may invite a selloff towards 90.00 and 89.30.

Pound experiencing a technical pullback?

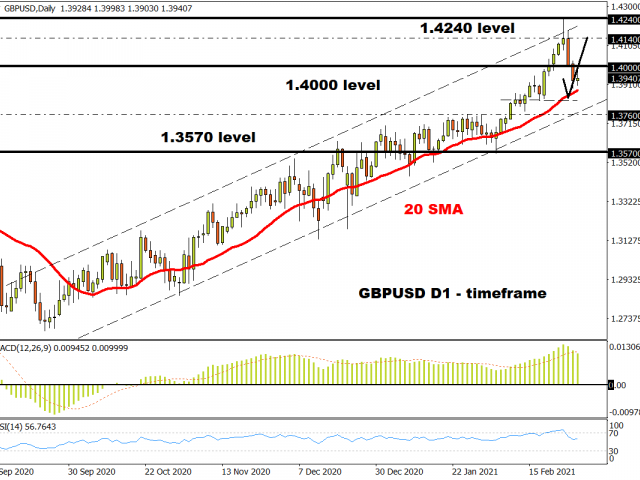
Sterling collapsed like a house of cards last week after punching above 1.4200 for the first time since April 2018.

It looks like a pullback could be in play but this will depend on how prices behave below 1.4000. Sustained weakness under this resistance could encourage a steeper decline towards 1.3830 and 1.3760. Should 1.4200 prove to be unreliable resistance, prices may rebound towards 1.4140 and 1.4200.

Euro poised for further downside

A lot is going on with the EURUSD.

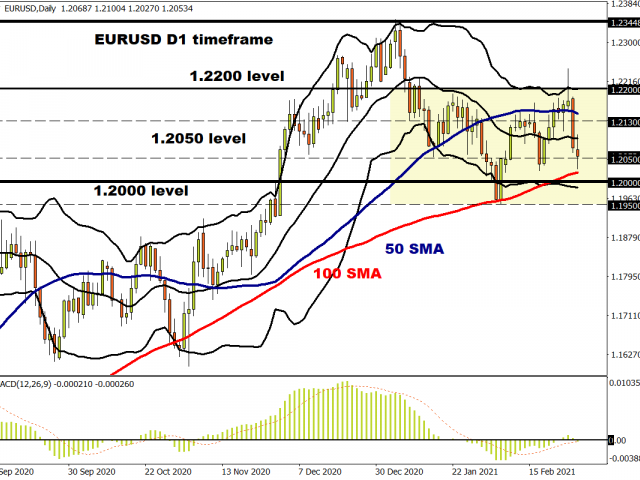
Prices are trading below the 50 SMA but above the 100 SMA. The MACD is flat but the recent selloff suggests another decline on the horizon. A solid daily close below 1.2050 could trigger a decline towards 1.2000 and 1.9050. For bulls to jump back into the game, a strong daily close above 1.2130 will be required.

AUDUSD respects bullish channel

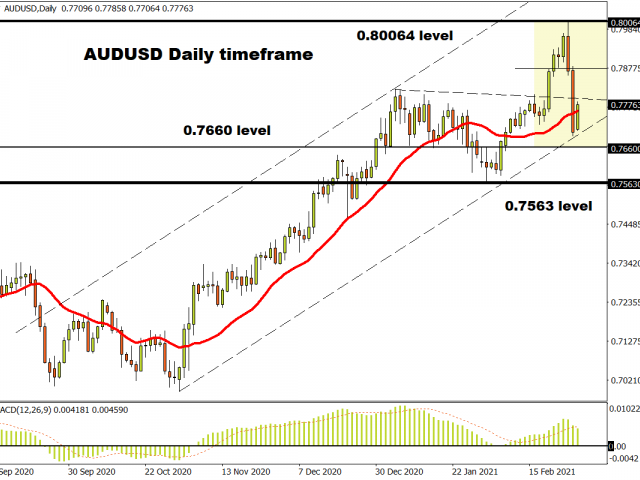
As the title says, the AUDUSD remains in a bullish channel on the daily timeframe. However, prices have cut below the previous higher low of 0.7724, offering an opportunity for bears to re-enter the scene. If prices are unable to break above 0.7820, this may result in a decline towards 0.7660 and 0.7563.

EURGBP capped under 0.8700?

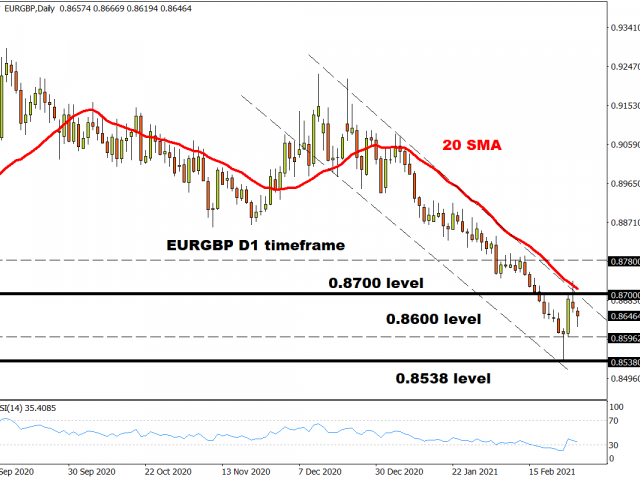
Is the EURGBP in the process of a technical rebound or a dead cat bounce? After rebounding from the 0.8538 level last week, prices failed to secure a daily close above 0.8700.

Where the EURGBP trades in the medium to long term may depend on whether the current range can be broken. Sustained weakness under 0.8700 may trigger a decline towards 0.8596 and 0.8538. Should bulls take prices back above 0.8700, the next key level of interest may be found around 0.8780.

USDJPY eyes 107.00

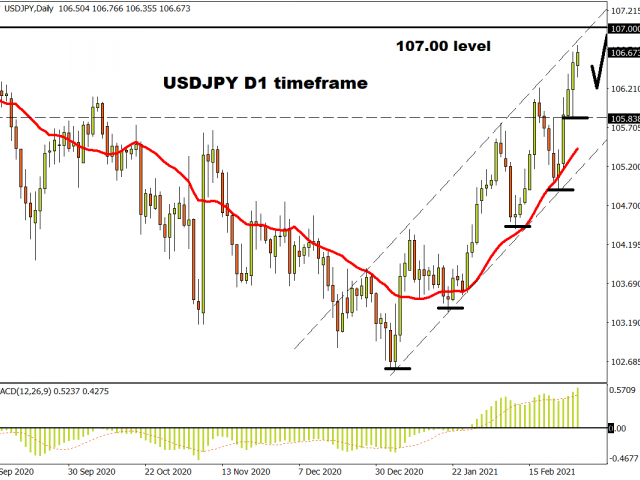
The USDJPY is firmly bullish on the daily charts. Bulls remain in the control as long as the 105.838 higher low proves to be reliable support. Prices are trading above the 20 Simple Moving Average (SMA) while the MACD trades to the upside.  A weaker Dollar or intraday breakout above 106.80 could elevate the USDJPY towards 107.00 in the week ahead.

Disclaimer: The content in this article comprises personal opinions and should not be construed as containing personal and/or other investment advice and/or an offer of and/or solicitation for any transactions in financial instruments and/or a guarantee and/or prediction of future performance. ForexTime (FXTM), its affiliates, agents, directors, officers or employees do not guarantee the accuracy, validity, timeliness or completeness, of any information or data made available and assume no liability as to any loss arising from any investment based on the same.


Forex-Time-LogoArticle by ForexTime

ForexTime Ltd (FXTM) is an award winning international online forex broker regulated by CySEC 185/12 www.forextime.com