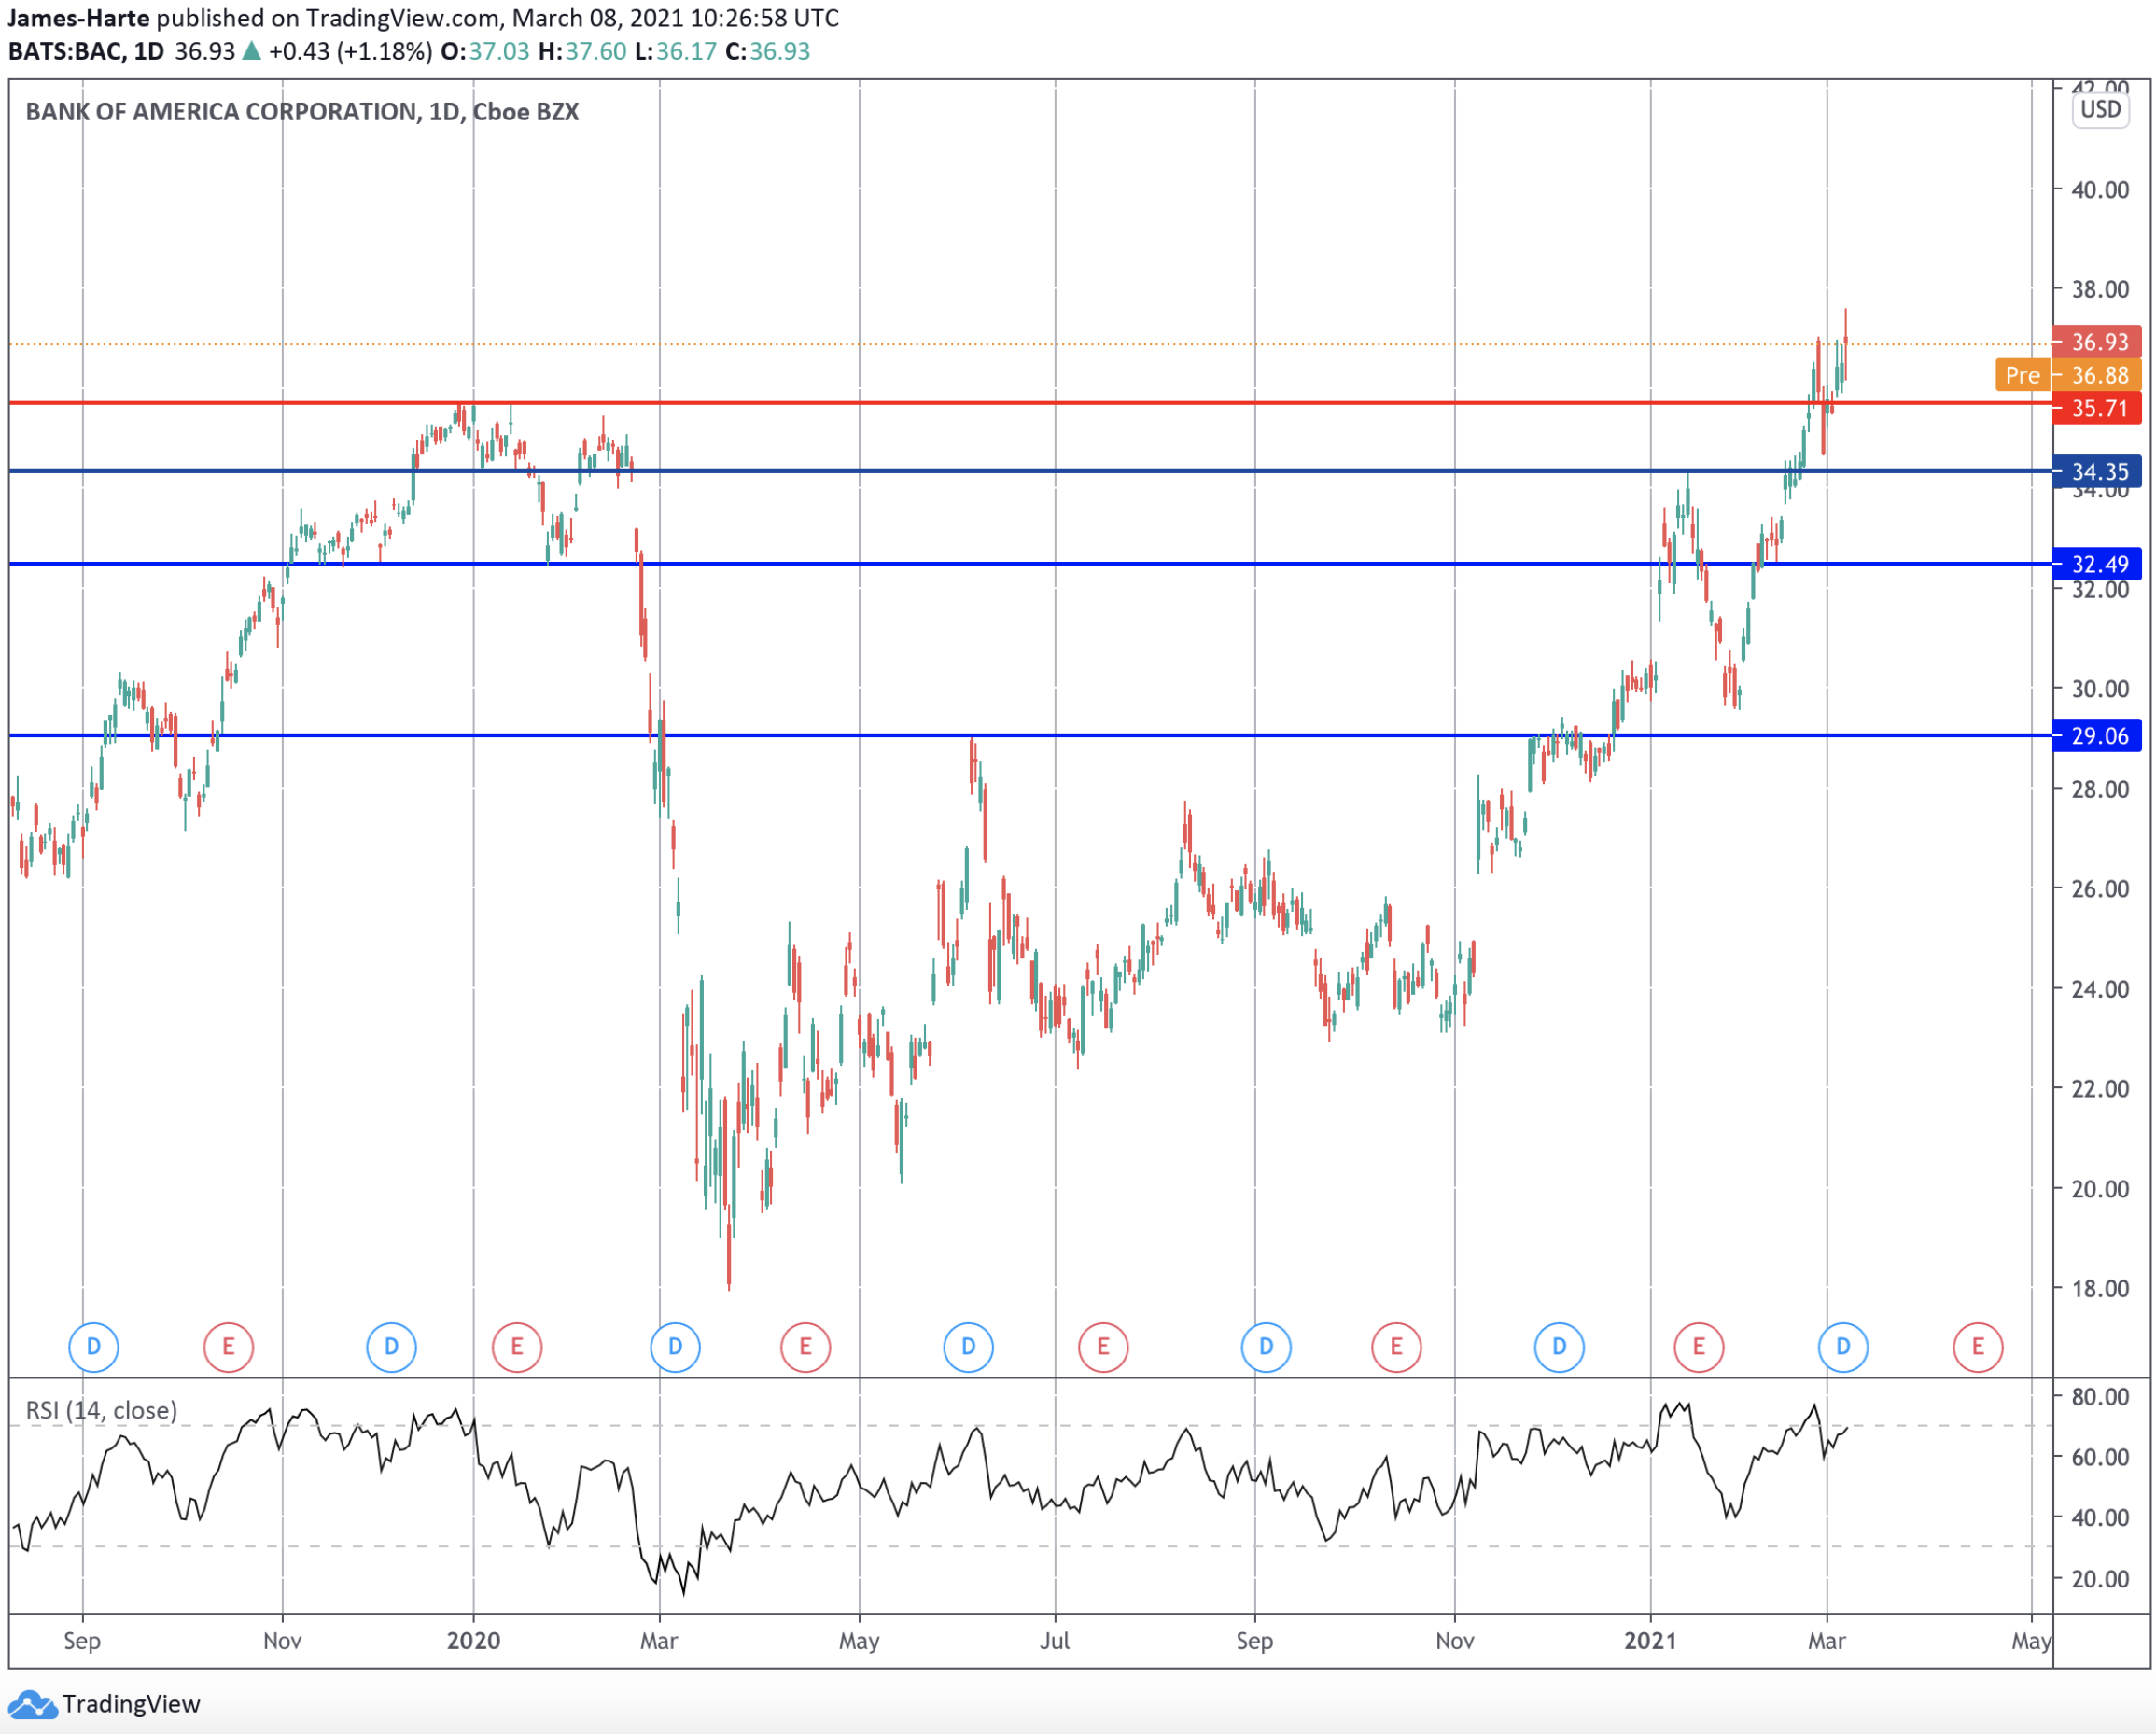
Shares in Bank of America have enjoyed a solid rally this year. This marks a firm recovery from the February lows around the 30 level to trade up to current highs around 37.
The rally was kicked off by a solid set of Q4 earnings. The bank reported earnings per share of $0.59 in the final quarter of 2020. This beat the $0.55 Wall Street was looking for. It also marked the third straight quarter of earnings growth for BAC following the negative growth seen over Q1 2020 during the height of the pandemic.
Job Cuts Underway
This week, as a result of the impact of the pandemic, BAC announced that it will be restructuring its global banking and markets division. The bank noted that members of its sales and trading, research and investment bank, and capital markets segments will be affected by the changes.
The announcement comes on the back of BAC last year confirming that it would not cut any jobs over 2020. The move also follows on the back of similar announcements by other banks.
However, following the distribution of bonuses, some job losses are always seen around this time of year.
Spoofing Case Dropped
There has been some positive news for the bank, however. On Thursday, a legal dispute that the bank has been involved in for a number of years was finally brought to a head.
A federal judge quashed a case that had been brought against BAC and JP Morgan over allegations of “spoofing”; a fraudulent trading practice that is prohibited by regulatory laws.
Yields Lifting BAC Shares
Shares in BAC have also been benefiting from the firm rally in US treasury yields which have rocketed higher this year. Given the bank’s degree of exposure to interbank lending, the uptick in yields has led to greater profits.
With longer-term bond rates having risen firmly this year, BAC has been able to increase the rate on longer-duration loans it offers.
Furthermore, interest rates on all credit facilities have increased proportionally. This has helped lift the bank’s profitability. With inflation expectations on the up and with the US stimulus bill having passed, BAC shares look likely to continue higher from here.
BAC Breakout Underway But Beware RSI Divergence
The rally in BAC has seen price breaking above several key levels, most recently the 34.35 and 35.71 levels. While price holds above here, the focus is on a continued grind higher.
However, bearish momentum on the RSI indicator suggests the risk of a reversal. Should price slip back below the 34.35 level, the next support to note is at 32.49.
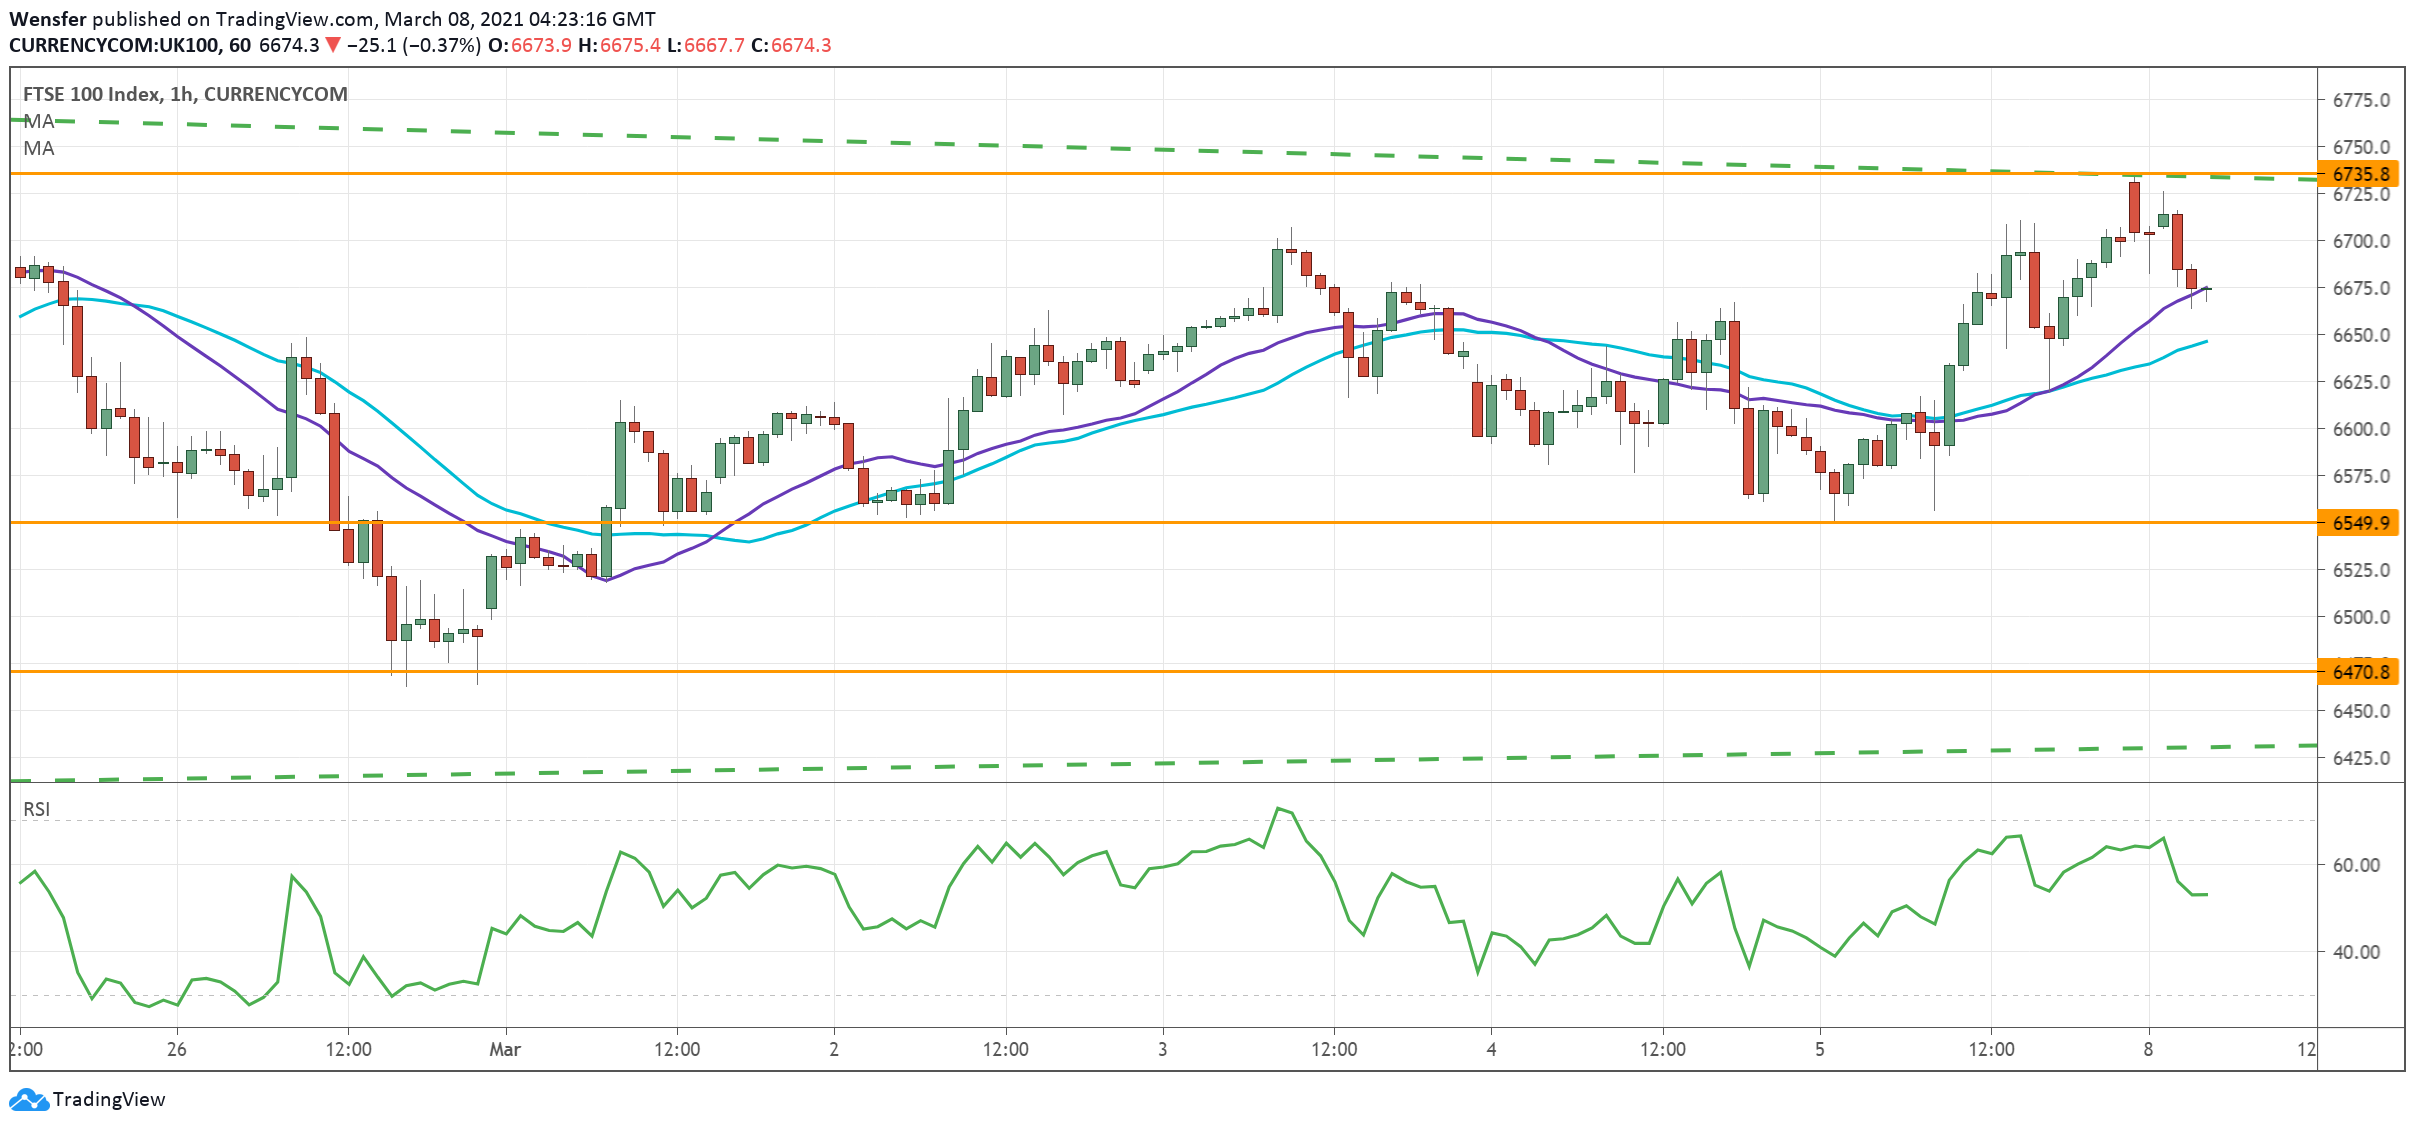
Recent sell-offs across global markets have barely scratched the FTSE 100, probably thanks to the advanced rollout of the vaccine campaign and fewer tech high-flyers as its components.
The index has been consolidating within a pennant on the daily chart. After a rebound from 6470, the price is trying to establish a foothold above 6550, the closest support.
6735 is the supply zone on the upper band of the narrowing range. A continuation breakout might occur but until then this is range-traders’ playground.
GBPUSD capped by bearish trendline
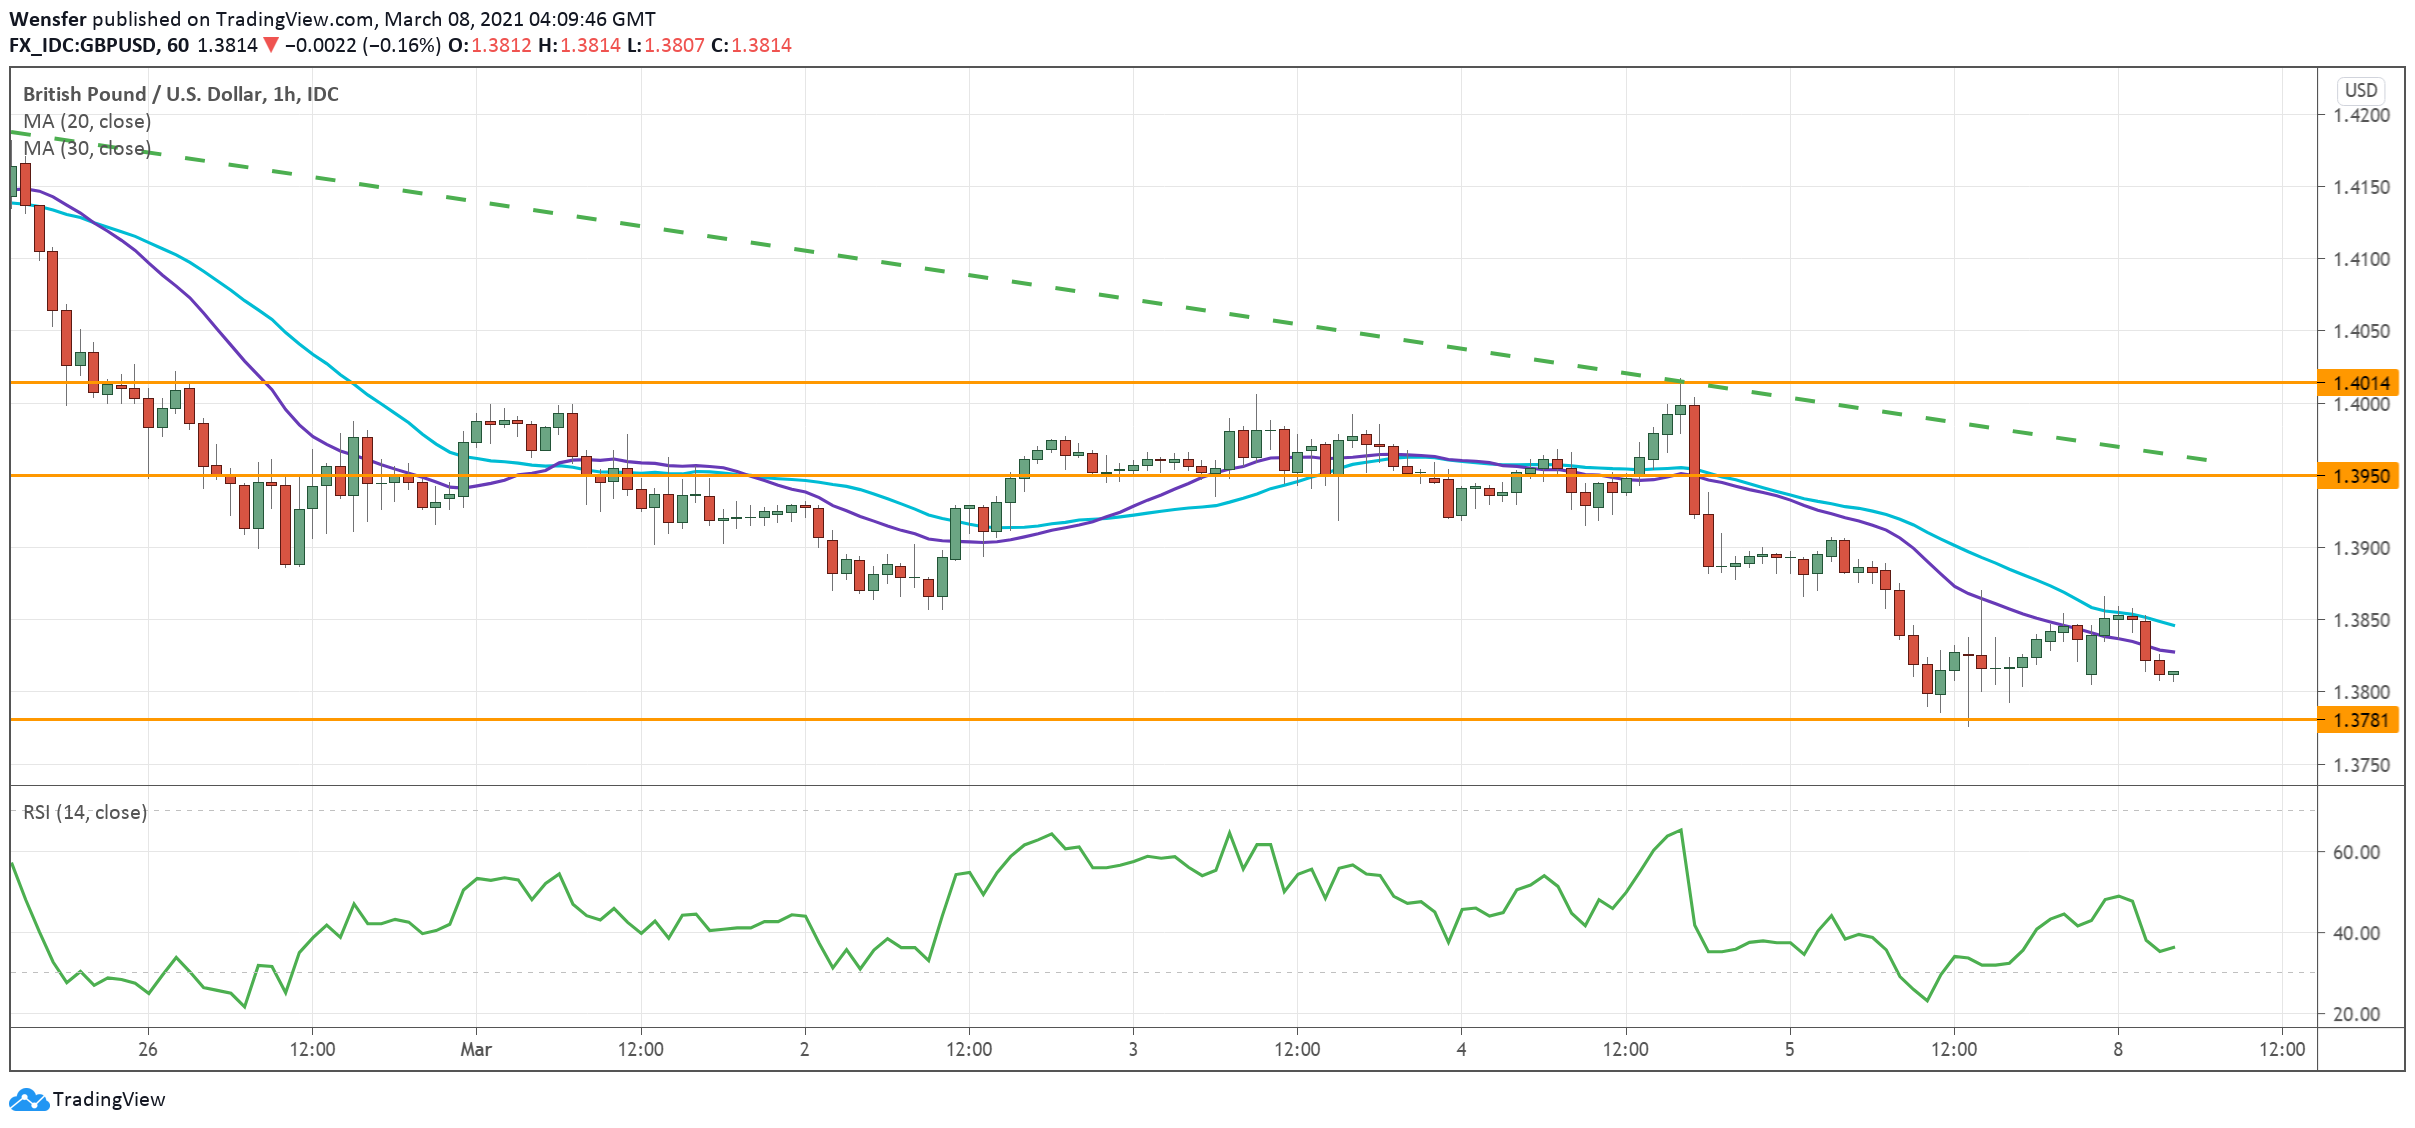
Improvement in the US labor market has given the greenback a lead.
The Bank of England’s Governor’s speech today might be the intraday catalyst traders are looking for. The pair is testing the 30-day MA on the daily timeframe which is also a short-term support level (1.3780).
As the RSI shows signs of overselling, a rebound is likely. However, bulls will need to break above the falling trendline (1.3950) to turn the tide, or bears might continue to push towards 1.36s.
EURJPY in brief correction
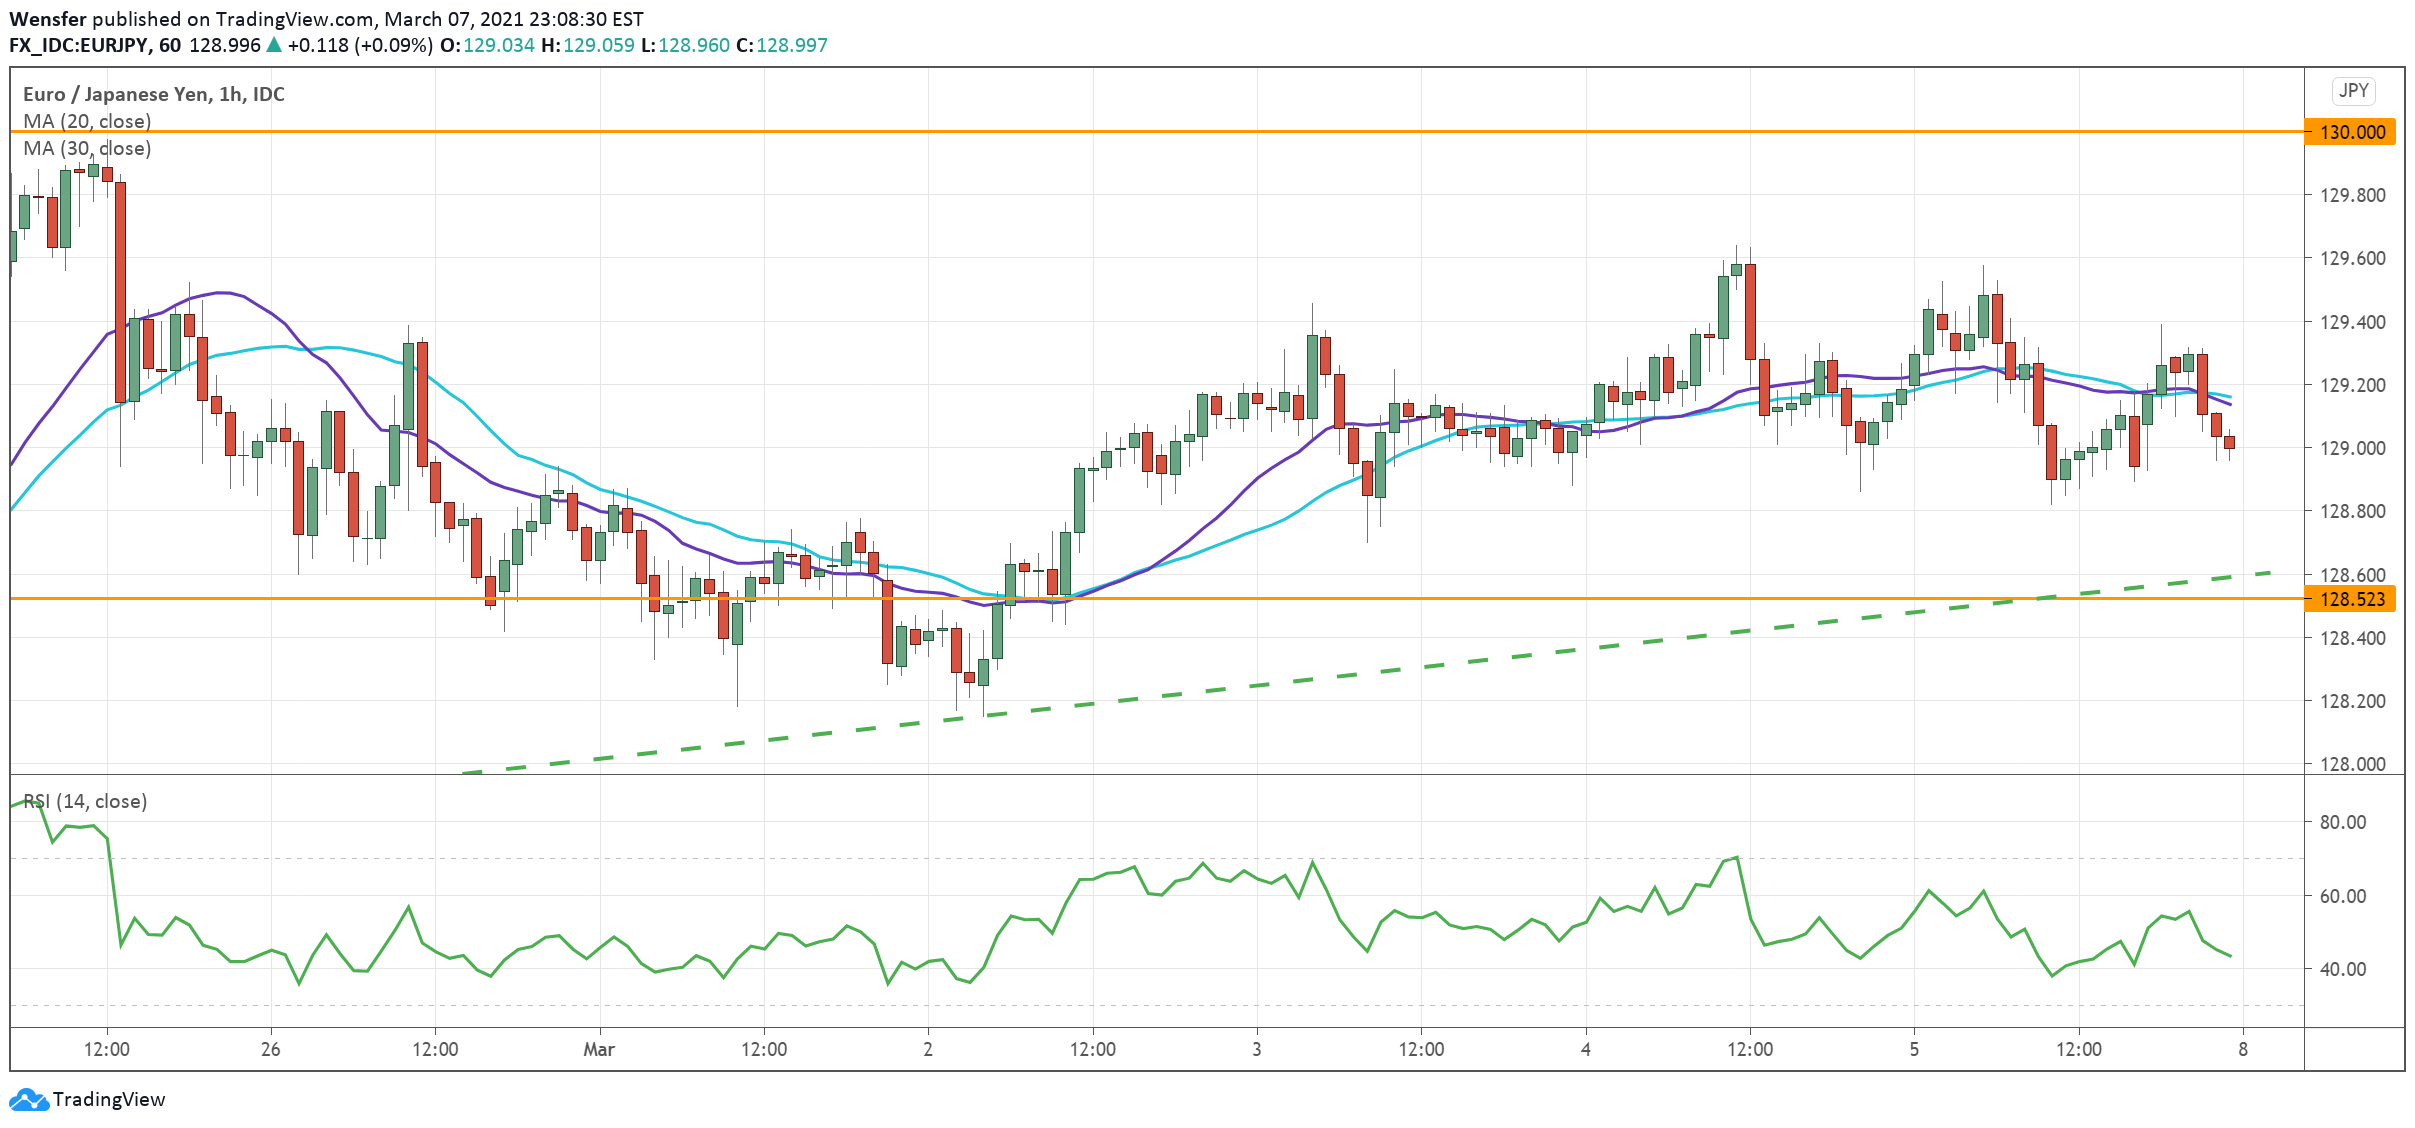
The Japanese yen has gone sideways ahead of the GDP release tonight. The previous high and psychological level of 130.00 seems too much to digest and the market needs a reason to make a breakout.
The latest retreat is pushing the RSI towards 30 near an oversold condition. Though the overall trend remains bullish as per rising trend lines on both hourly and daily charts. Buyers are likely to be waiting around the support area of 128.50.
– There’s a global shortage in semiconductors, and it’s becoming increasingly serious. The US is currently reviewing its supply of the technology, following a landmark executive order from President Joe Biden.
The president also pledged US$37 billion (£26 billion) to cover the short-term costs of rebuilding and securing America’s supply of semiconductors, which are a fundamental part of microchips and thus integral to everything from computers to smartphones to renewable energy and military hardware.
The automotive sector has been worst affected by the drought, in an era where microchips now form the backbone of most cars. Ford is predicting a 20% slump in production and Tesla shut down its model 3 assembly line for two weeks. In the UK, Honda was forced to temporarily shut its plant as well.
Even highly experienced tech companies such as Nvidia and Microsoft are struggling to provide a steady stock of graphics cards and Xboxes respectively. It appears that no company, big or small, tech or non-tech, is safe from the wide-ranging impact of the great semiconductor famine of 2021.
The concentration problem
While it is easy to blame the COVID-19 pandemic for this situation, the truth is that the global semiconductor supply chain had this coming for some time. As much as 70% of the world’s semiconductors are manufactured by just two companies, Taiwan Semiconductor (TSMC) and Samsung.
The entry barriers into semiconductor manufacturing are astronomically high. There’s a steep learning curve required to set up a semiconductor foundry, entailing an upfront investment of US$10-$12 billion and then at least three years to become production-ready.
Even then, there are no guarantees that a new foundry’s chip yields will match those of the incumbents. Chips rapidly become obsolete and price pressures are a major problem in the tech sector, so there are lots of risks to profitability.
Due to such harsh economics, it has only made sense for a handful of large players to invest in manufacturing capabilities and then spread those costs and risks across hundreds of thousands of customers. Global tech has historically been very happy to hand the manufacturing reins to TSMC and Samsung. And in turn, this has created the supply-chain equivalent of a house of cards.
High demand
The pandemic has driven unexpectedly high demand for home electronics such as laptops and gaming consoles, as many people started working from home and seeking more sources of indoor entertainment.
Automotive companies had been expecting lower demand, given that car sales tend to move lower in an economic downturn. This, however, proved to be an erroneous assumption, as new car sales started bouncing back quickly by the tail end of 2020. Automotive companies tried to re-book previously cancelled semiconductor orders only to discover that home electronics manufacturers had taken their place.
At the same time, President Trump’s trade war with China led to new rules that made it harder for Chinese companies to source semiconductors from TSMC and Samsung. With China’s own semiconductor technology inferior to the industry leaders, Chinese tech behemoths like Huawei stockpiled semiconductor chips in advance of the new restrictions in 2020, soaking up any spare capacity with large orders.
But the straw that finally broke the proverbial camel’s back was the sharp rise in bitcoin prices in early 2021. This increased the demand for the graphics processing units that are traditionally used in mining the digital currency, exacerbating the semiconductor supply issues further.
All of this has been enough to cause TSMC and Samsung to run out of capacity and significantly increase lead times to fulfil orders, leading to the drought we see today.
Who loses
The share prices of TSMC and Samsung have risen by 190% and 61% respectively in the past 12 months thanks to the supply shortfall. Despite President Biden’s best efforts, the situation is unlikely to improve in the next three years because of all the barriers to entry in this sector.
Prices of consumer electronics have shot up, thanks to scalpers who routinely buy graphics cards and consoles at recommended retail prices and sell them for higher prices on sites like eBay.
It is only a matter of time before tech manufacturers and retailers decide to increase prices to match the high demand and low supply of the components. Expect to see releases of more expensive variants of existing electronic products hitting the market soon.
Just like in an actual famine, the end consumers of these goods are going to be significantly worse off, with little or no respite coming their way.
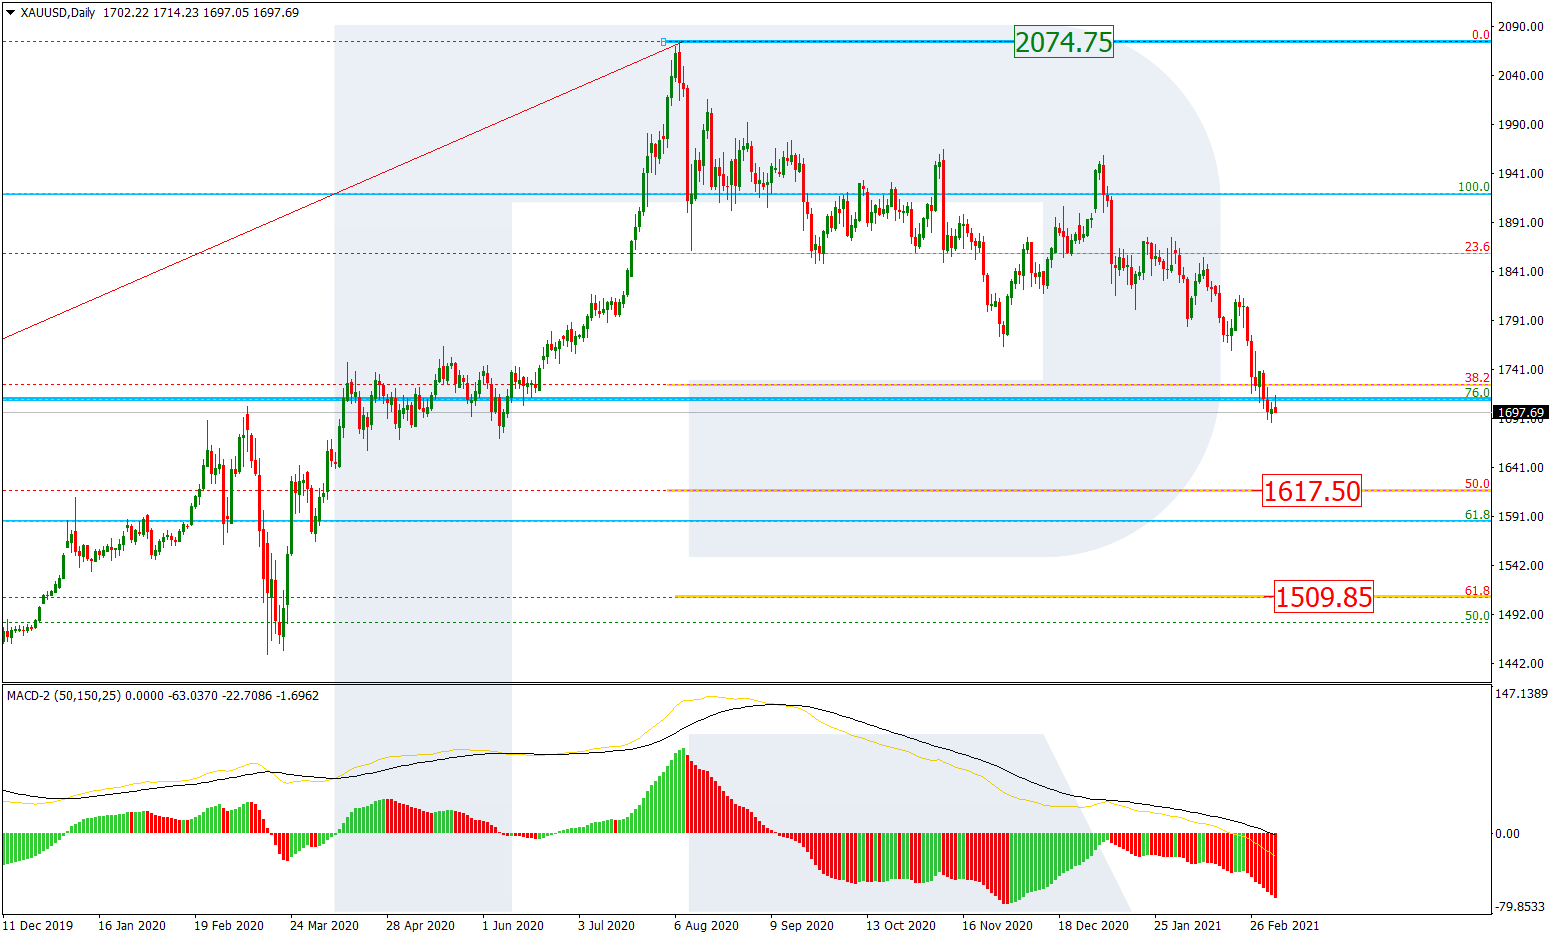
In the daily chart, the long-term correction continues; the descending wave has broken 38.2% fibo and may continue towards 50.0% and 61.8% fibo at 1617.50 and 1509.85 respectively. However, there is a convergence on MACD, which may hint at a possible pullback after the instrument reaches one of its key downside targets. The key resistance is the high at 2074.75.
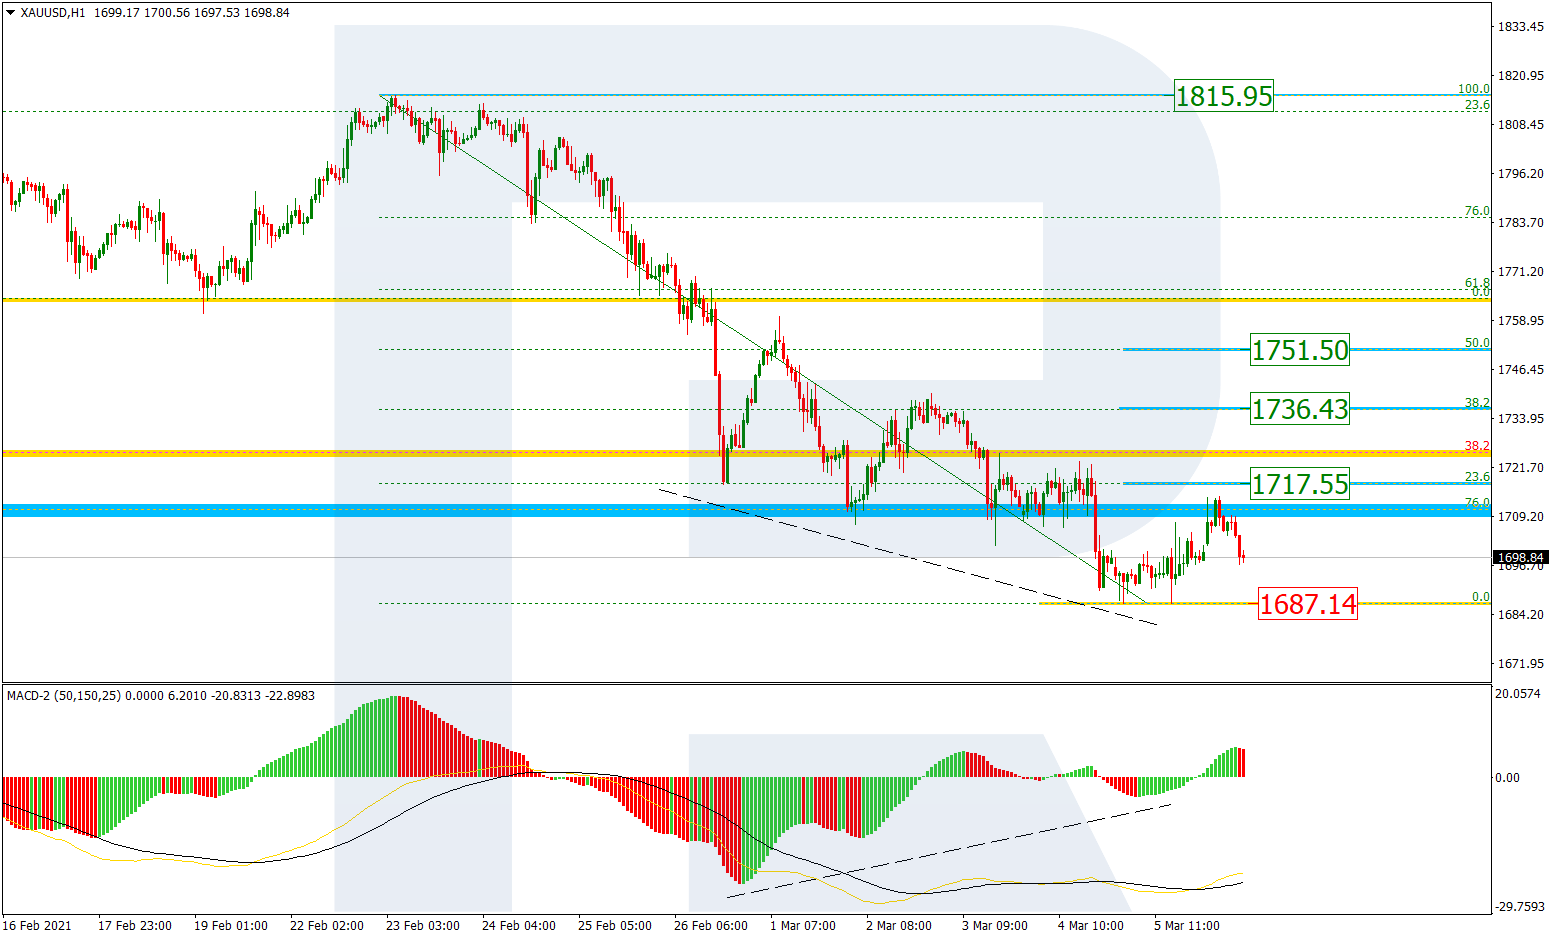
In the H1 chart, a convergence on MACD made the pair start a new pullback to the upside. The possible correctional targets are 23.6%, 38.2%, and 50.0% fibo at 1717.55, 1736.43, and 1751.50 respectively. However, if the price breaks the local low at 1687.14, XAUUSD may continue falling to reach the long-term 50.0% fibo at 1617.50.
USDCHF, “US Dollar vs Swiss Franc”
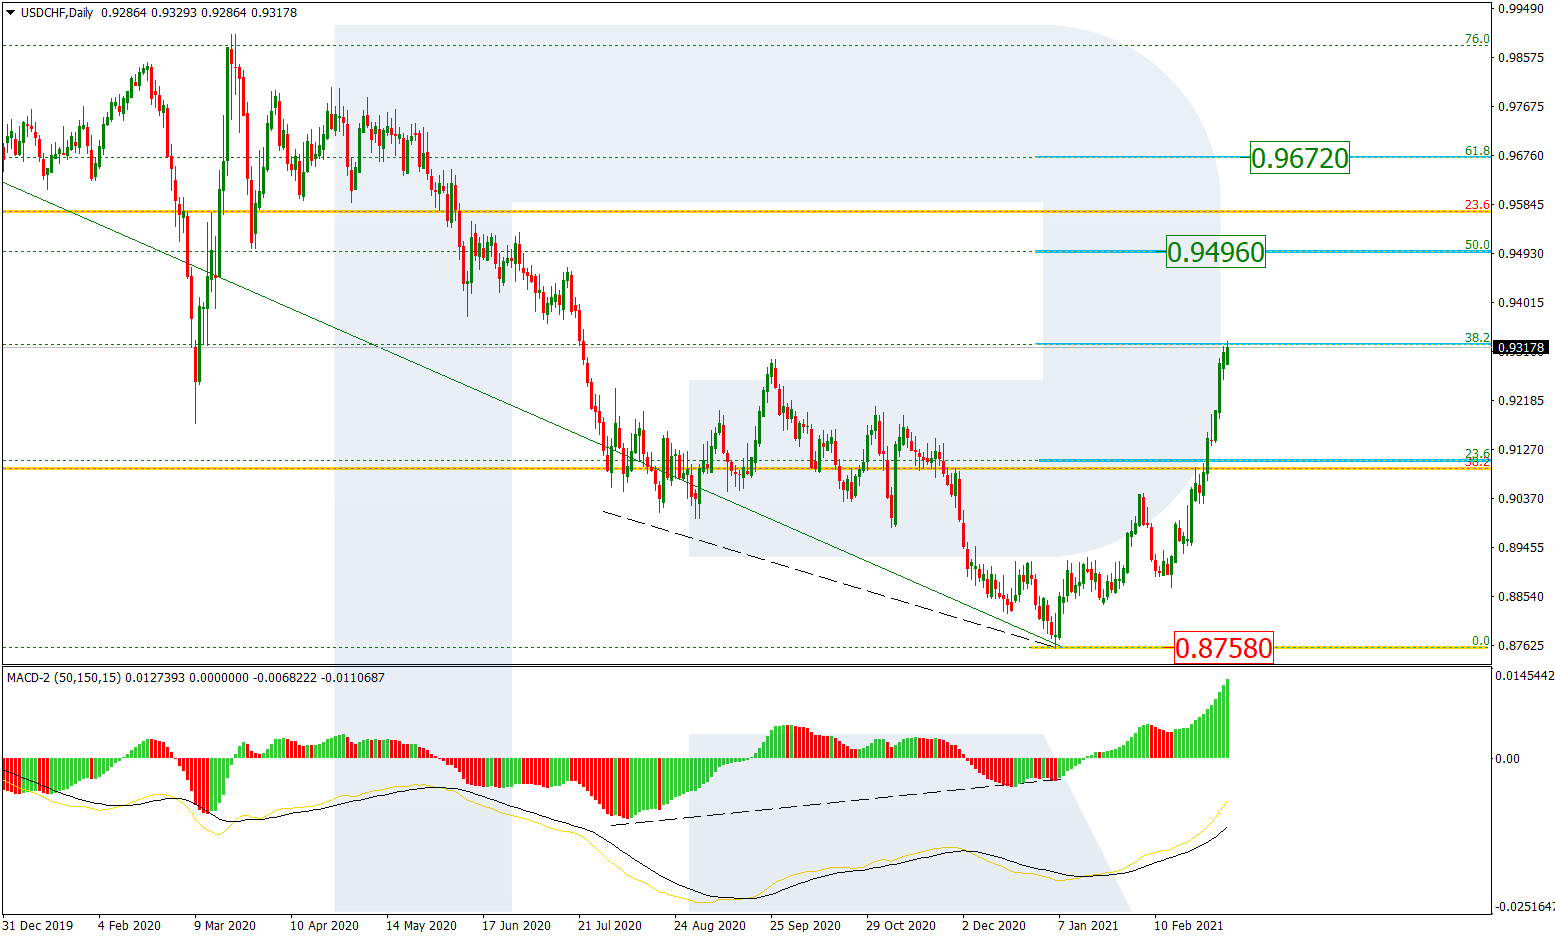
The daily chart shows that USDCHF has reached a very important level, 38.2% fibo. Later, the market may continue growing towards 50.0% and 61.8% % fibo at 0.9496 and 0.9672 respectively. However, if the asset breaks the support at 0.8758, the correction may be over.
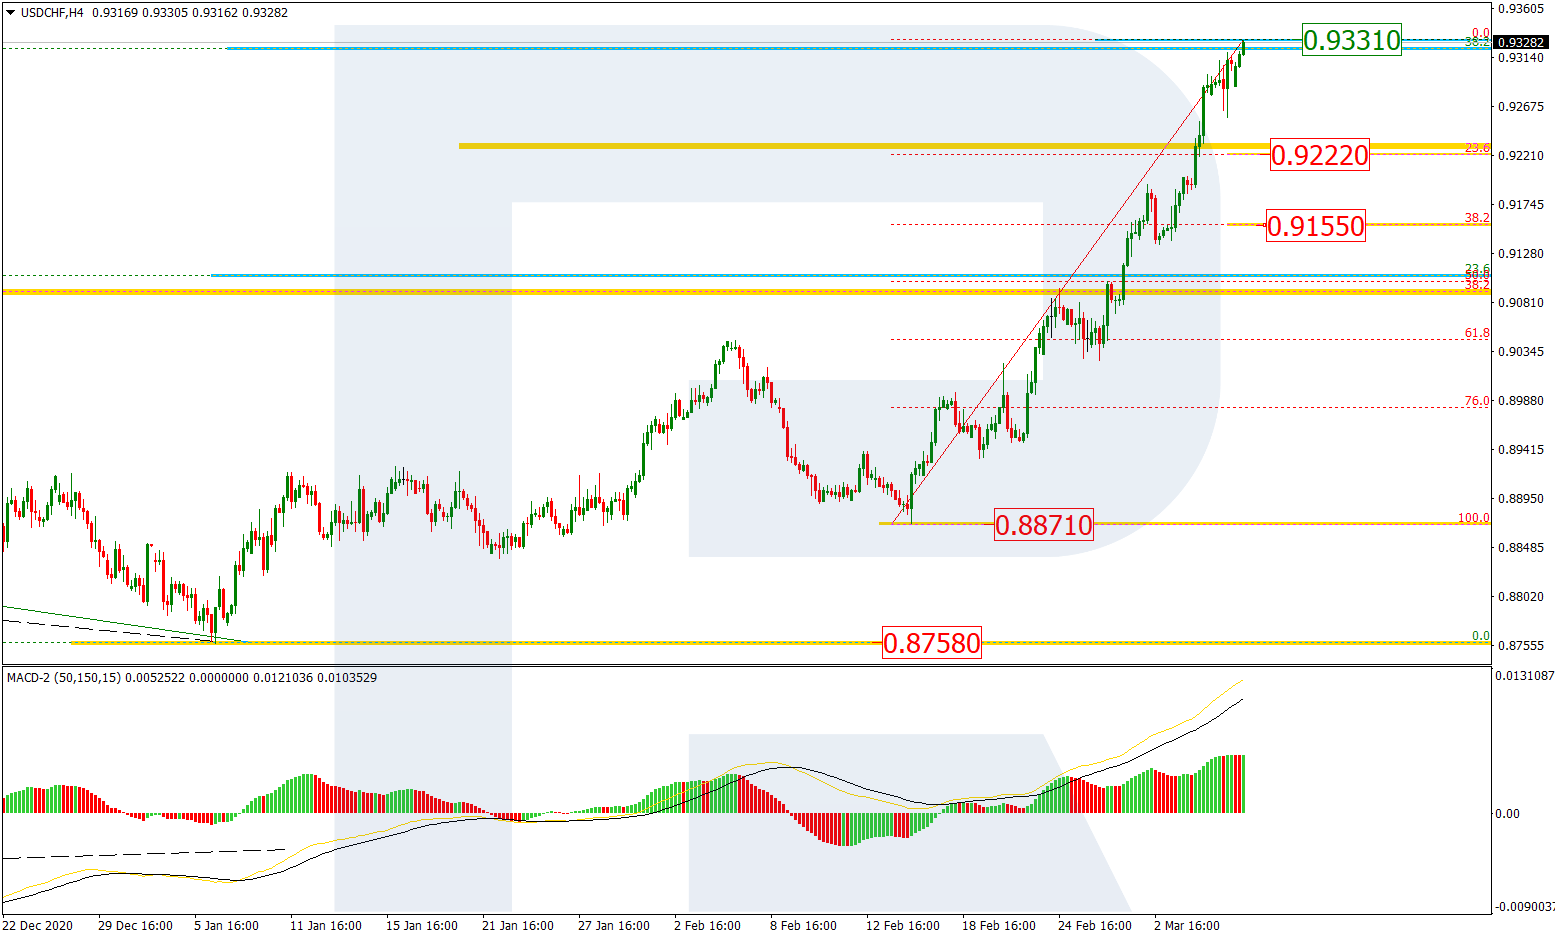
As we can see in the H4 chart, the asset is moving within a stable uptrend but may start a new pullback to the downside after reaching the long-term 38.2% fibo. The correctional targets may be 23.6% and 38.2% fibo at 0.9222 and 0.9155 respectively. The support is the local low at 0.8871.
Attention! Forecasts presented in this section only reflect the author’s private opinion and should not be considered as guidance for trading. RoboForex LP bears no responsibility for trading results based on trading recommendations described in these analytical reviews.
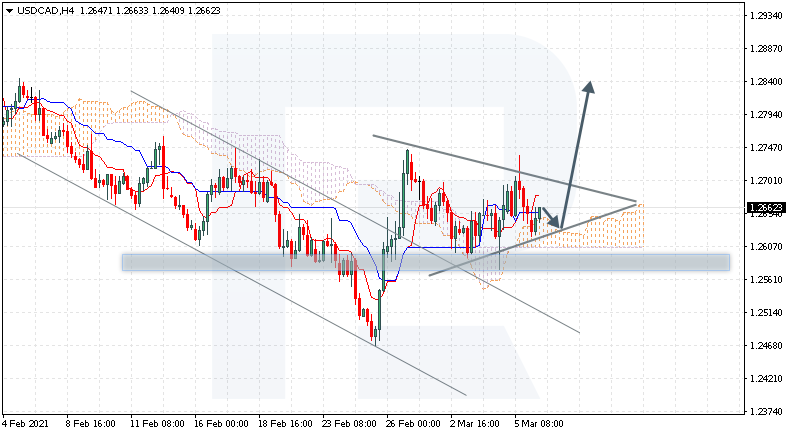
USDCAD is trading at 1.2662; the instrument is moving above Ichimoku Cloud, thus indicating an ascending tendency. The markets could indicate that the price may test the cloud’s upside border at 1.2615 and then resume moving upwards to reach 1.2845. Another signal in favor of a further uptrend will be a rebound from the downside border of the Triangle pattern. However, the bullish scenario may no longer be valid if the price breaks the cloud’s downside border and fixes below 1.2555. In this case, the pair may continue falling towards 1.2465. To confirm further growth, the asset must break the pattern’s upside border and fix above 1.2715.
XAUUSD, “Gold vs US Dollar”
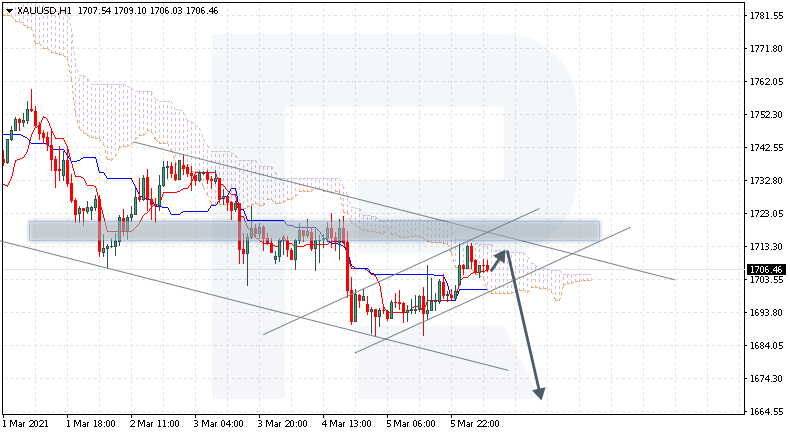
XAUUSD is trading at 1706.00; the instrument is moving inside Ichimoku Cloud, thus indicating a sideways tendency. The markets could indicate that the price may test the cloud’s upside border at 1710.00 and then resume moving downwards to reach 1665.00. Another signal in favor of a further downtrend will be a rebound from the descending channel’s upside border. However, the bearish scenario may no longer be valid if the price breaks the cloud’s upside border and fixes above 1725.00. In this case, the pair may continue growing towards 1765.00. To confirm further decline, the asset must break the rising channel’s downside border and fix below 1690.00.
NZDUSD, “New Zealand Dollar vs US Dollar”
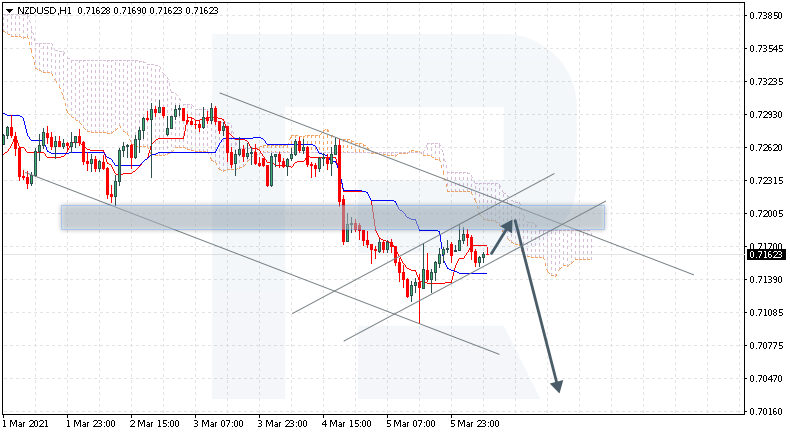
NZDUSD is trading at 0.7162; the instrument is moving below Ichimoku Cloud, thus indicating a descending tendency. The markets could indicate that the price may test the cloud’s downside border at 0.7195 and then resume moving downwards to reach 0.7035. Another signal in favor of a further downtrend will be a rebound from the descending channel’s upside border. However, the bearish scenario may be canceled if the price breaks the cloud’s upside border and fixes above 0.7245. In this case, the pair may continue growing towards 0.7335. To confirm further decline, the asset must break the rising channel’s downside border and fix below 0.7125.
Attention! Forecasts presented in this section only reflect the author’s private opinion and should not be considered as guidance for trading. RoboForex LP bears no responsibility for trading results based on trading recommendations described in these analytical reviews.
Following a strong recovery on Friday, Tech stocks are driving global equity indices lower today as higher Treasury yields continue to drive rotation from growth to value companies. The dollar remains the biggest winner from rising yield differentials with USD/JPY holding at nine month high. Brent crude shot up 2% early Monday passing the $70 threshold for the first time since the pandemic began after Yemen’s Houthi forces fired missiles on a Saudi Aramco facility. Investors await the final vote for Biden’s $1.9 trillion pandemic relief package, although the passing of the bill seems widely priced in.
Financial markets are becoming ever more exciting. Many forces are at play and investors are trying to digest a mutltitude of information. Hence, we should expect volatility to remain elevated over the upcoming days and probably weeks.
There are reasons to be positive about a robust rebound in global growth prospects. The US economy added 379,000 jobs in February, well above markets expectations of 200,000. Data released over the weekend showed China’s export growth soared to the highest levels in over two decades. Despite the figures being distorted by the low base in 2020, the sharp recovery in exports represents strong global demand. The rollout of Covid19 jabs and fall in global cases are also a source of optimism.
Given this background and the anticipated $1.9 trillion in new US stimulus, investors are growing increasingly optimistic about corporate earnings. Many households and corporations are sitting on large piles of cash which will be deployed in the upcoming months. Hence analysts are increasing their earnings estimates for companies in the S&P 500 by wide ranges.
According to FactSet, S&P 500 companies are projected to report a 21.5% rise in EPS for Q1 2021, almost a 5% increase from end of year estimates. However, the S&P 500 is failing to make new highs and the Tech-heavy Nasdaq Composite has dropped nearly 10% from its record highs, briefly entering correction territory. This tells us that even if the economy is set to boom in 2021, the performance of stocks will be extremely bumpy.
The most loved stocks in 2020 are turning out to be the most hated in 2021. Tesla, Zoom Video Communications and Peloton are just a few examples. Those benefiting the most are in the financials, materials and industrial sectors. It sounds kind of boring to invest in these sectors for new investors, but with rising interest rates, higher inflation expectations and extremely rich valuations the rotation out of growth into value may persist for several months.
Those waiting to be rescued by the Federal Reserve might be disappointed unless we see financial conditions tightening. A 30% or 50% drop in Tesla won’t force Powell’s hand. In fact, Fed officials might like to see those richly valued stocks come down a bit to prevent bubbles in equity markets. As long as this is occurring in a way that is not disruptive to the overall economy, yields may continue to be allowed to go higher without intervention.
Given this environment expect the most crowded trades in 2020 to become the laggards this year, and the rotation which started in November 2020 to continue for longer than expected.
Disclaimer: The content in this article comprises personal opinions and should not be construed as containing personal and/or other investment advice and/or an offer of and/or solicitation for any transactions in financial instruments and/or a guarantee and/or prediction of future performance. ForexTime (FXTM), its affiliates, agents, directors, officers or employees do not guarantee the accuracy, validity, timeliness or completeness, of any information or data made available and assume no liability as to any loss arising from any investment based on the same.
– At this point in our lives, we are hoping the new COVID-19 vaccines will do their part to help move the world towards more normal consumer and economic activities. The US Senate recently a new $1.9 Trillion stimulus package that should continue to provide assistance to various levels of consumer, state governments, and corporate enterprises. The next question in our mind is “what will the recovery look like if/when it happens?”. We need to look at three critical components of the global economy to help answer this question: Consumer Activity, Debt, and Supply/Demand Functions.
Consumer activity makes up more than 60% of the US GDP. It also drives money flow as consumers engage in economic activity, create credit for new purchases and help to balance the supply/demand equilibrium functioning properly. The participation of the consumer within an economy is essential for a healthy growing economy.
Where Are Consumers Now & Where Will They Be In The Future?
The US has passed more than $4 Trillion in COVID-19 stimulus over the past 12+ months. At the same time, global central banks have also engaged in various easy money policies to spark global economic activity. When we combine the efforts of world governments and central banks, we’ve seen an unprecedented amount of money deployed throughout the globe recently – and that money needs to find its purpose and use in the global economy quickly of the global economy is going to recover enough to spark a new wave of economic growth.
We believe two key components of consumer engagement are at play right now; investing/trading in the US and global markets and Real Estate. Whereas US consumers have been reducing debt exposure on credit cards and tightening their spending in other ways, trading volumes in the stock market Indexes and ETFs have increased dramatically over the past 12 months. Additionally, low supply and low interest rates have kept the US housing market active, in addition to the boost in activity from people moving to more rural areas as the work-from-home phenomenon settles into the new normal.
Case-Shiller Home Price Index
This Case-Shiller 20-City Composite Home Price Index chart, below shows how quickly home prices have rallied over the past 12 months. Just prior to the COVID-19 pandemic, this index was flattening. Then the moratorium on foreclosures and extended assistance for homeowners pulled many homes back off the market in early 2020. That reduced supply and prompted a rally in home prices across the US.
The assistance provided to these “at-risk” homeowners accomplished two very important economic benefits. It eliminated a wave of new foreclosures (albeit possibly temporarily) and it prompted a seller’s market because supply had been constricted. The result is that many homeowners witnessed a 6% to 10% increase in their home values over the last 12+ months.
Delinquency Rates On Consumer Loans
Unlike in 2006-2008 when delinquency rates skyrocketed during the housing crisis, throughout the COVID-19 pandemic, delinquency rates collapsed to the lowest levels over the past 25+ years. Consumers took their extra capital, stimulus checks, and federal assistance and used the past 12+ months to eliminate certain debts. Even though we are starting to see an uptick in delinquency rates in Q4 2020, these levels would have to climb considerably before we get close to the levels before the COVID-19 pandemic.
This suggests that a broad spectrum of US consumers are in a much better economic position related to revolving debt, or credit card debt, than they were before the COVID-19 pandemic. If these consumers begin to engage in a new economic recovery by engaging in a healthy credit expansion, we may see a boost to certain sectors of the economy over the next 24 to 36+ months.
Real Personal Consumption Expenditures
Unlike many other indicators, Real Personal Consumption has risen past the pre-COVID-19 peak levels. This suggests that consumers are still spending money on Durable Goods and are continuing to buy essential items to support their lifestyles and families. Yes, there are a number of people that are unemployed or have transitioned to other types of work, but the stimulus efforts and extended unemployment assistance has translated into real consumer engagement for Durable Goods, as we can see from the chart below.
Remember, Durable Goods are not typically found at Grocery Stores or Walmart. They are items that have extended life-cycles (greater than three years); such as cars, planes, trains, furniture, appliances, jewelry, and books. This rise in Durable Goods suggests that a large segment of the US consumer is actively engaged in making bigger-ticket purchases recently – possibly as a result of buying a new home, transitioning away from traditional work environments, and/or repositioning family essentials in preparation for a post COVID-19 world. This type of economic engagement may continue for many months forward.
Consumer Price Index – All Urban Consumers
The following Consumer Price Index chart shows that general consumer prices briefly dipped when COVID-19 hit in March 2020, but they have since rallied to new highs. This is partially a result of the rise in home prices and rising commodity prices, which contribute to a rise in price levels for consumers.
All of this data is showing that the US consumer is actually much more economically healthy than consumers were in the midst of the 2007-08 housing crisis. The stimulus efforts and partial economic shutdown did result in a large number of displaced or disadvantaged consumers, but it also shows that many US consumers were able to quickly transition into a different type of economic environment with very little extended economic risks.
The new $1.9 Trillion stimulus package will offer even more assistance to consumers. This new stimulus will be spent as new COVID-19 vaccines are being rolled out, suggesting the US is quickly moving away from extended risks related to the pandemic. This means consumers will likely start attempting to go back to normal in certain ways. Does this mean that the recovery efforts will strengthen the bullish price trend in the future and the US stock markets will continue to rally?
In our effort to better identify opportunities for traders and investors as the post-COVID-19 recovery unfolds, we will continue to identify various market sectors that my research team and I believe have a strong potential for increased bullish price trends. All of the data we’ve presented so far suggests the US consumer is much healthier than many people consider and that many US consumers are still actively engaged in some type of work/income solution. The only reason why housing, durable goods, CPI, and other economic indicators continue to rise is because US consumers are actively engaged in buying/consuming bigger, durable goods. This suggests the new $1.9 Trillion COVID relief effort may begin to push the US economy further into overdrive, and possibly pushing the supply/demand balance even further beyond the equilibrium zone.
Don’t miss the opportunities to profit from the broad market sector rotations we expect this year, which will be an incredible year for traders of my Best Asset Now (BAN) strategy. You can sign up now for my FREE webinar that teaches you how to find, enter, and profit from only those sectors that have the most strength and momentum. Staying ahead of sector trends is going to be key to success in volatile markets.
For those who believe in the power of trading sectors that show relative strength and momentum but don’t have the time to do the research every day, let my BAN Trader Pro newsletter service do all the work for you with daily market reports, research, and trade alerts. More frequent or experienced traders have been killing it trading options, ETFs, and stocks using my BAN Hotlist ranking the hottest ETFs, which is updated daily for my BAN Trader Pro subscribers.
In Part II of this article, we’ll take the data we’ve reviewed already and apply it to current market conditions, trends, and technical setups as we look for new opportunities in consumer-based sectors. My team and I believe some very big sector trends are going to set up as a result of everything that is converging on the US and global markets. It’s time to get ready for some big trends.
Trading in the financial markets requires a lot of skills in tandem with valuable knowledge, as traders need to spot which variables may or may not influence asset valuations. With the help of various trading tools, they can further enhance their understanding, potentially leading to better decision making in the long run.
INDEX-REVIEW.COM is one of the brokers offering a broad range of such trading tools and due to the increased interest, here’s a complete guide on how to use them and what their main benefits are.
About INDEX-REVIEW.COM
As a financial services provider offering a range of investment products, INDEX-REVIEW.COM stands out thanks to the cutting-edge technologies used for building the trading platform. High security standards and a vision oriented toward the end-user are also game changers for the brand now that retail trading interest is at a record level.
Opening an account with the broker means access to a broad range of trading resources, and that’s why traders with limited or no experience in the markets need a comprehensive guide on these resources. That way, they can better decide whether or not these tools can ultimately improve their decision-making process.
Trading tools available at INDEX-REVIEW.COM
Access to 6 different account types is only one of the reasons why the offer assembled by the broker is considered diversified. The Index Review trading tools section includes several important benefits. We shall describe each of them, so users can better comprehend when and how they are to be used.
Financial news
New developments occur across the markets and given that the IndexReview trading offer includes over 1,000 instruments (FX, stocks, indices, commodities, and crypto), the financial news section is constantly updated with price-moving news and market reviews. Traders can use these to spot the most actively traded assets and to understand why valuations are performing in a given way.
Signals
Trading signals can be useful for traders still in their early stages and requiring assistance in the process of spotting new opportunities. Hence, there is a dedicated section provided by INDEX-REVIEW.COM where traders can find updated trading ideas. Although profits are not guaranteed, signals can offer a glimpse into how experts view different heavily traded financial assets.
Market research videos
Understanding the markets and conducting proper research from the very start can be difficult without accumulating knowledge first. At IndexReview traders can take advantage of market research videos. These resources help with price analysis, as the broker claims to rely on certified experts. The videos analyze the market’s most popular assets and assist traders in making optimal decisions.
Market summary
Seeing the “big picture” is as important as analyzing the small market details. The market summary section available at IndexReview was designed so traders can see overall performance. This can be useful for traders with a portfolio of assets, who need to see where the bulk of market activity is concentrated.
Economic calendar
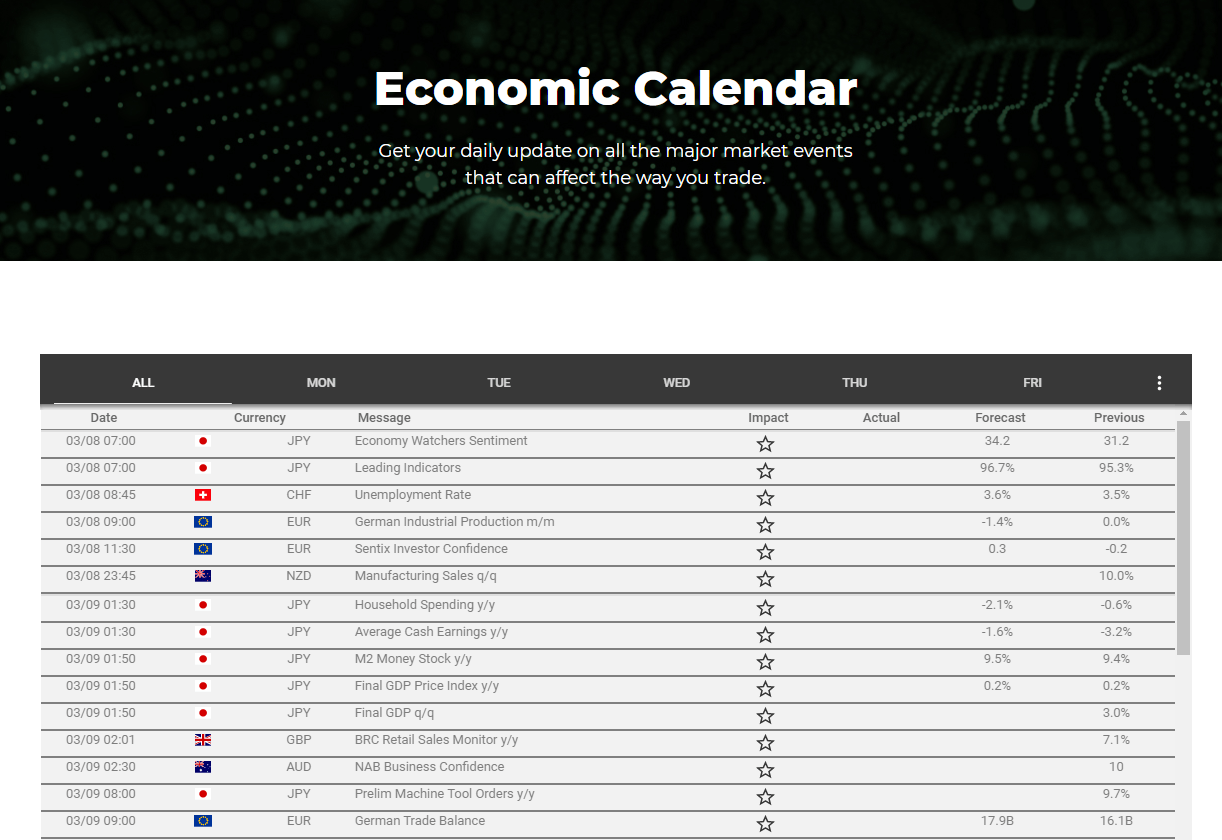
Trading when economic indicators are being released becomes crowded, as a larger number of market players are placing orders simultaneously. An economic calendar, instantly updated when these indicators are out, can play an important role and IndexReview is offering one of these on its website. Job reports, GDP figures, inflation, and commercial balance continue to weigh in on valuations. The calendar offers daily updates on the major releases which can affect the way traders get involved.
INDEX-REVIEW.COM trading platform
Although all of the trading tools provided by the brand can play an important role, the trading platform continues to be the main highlight. That is the main gateway to the financial markets and in the case of IndexReview, traders get access to proprietary software.
The broker claims that this is an advanced trading platform, opening traders to markets with the help of leading trading tools and instruments, real-time data, and more than 1,000 assets from the most popular markets. Thanks to the brand’s goal of reaching a broad audience of traders, the platform can be used by beginners and experts as one, considering it carries a flexible and user-friendly interface.
Can the tools available at INDEX-REVIEW.COM improve trading?
Traders need to be aware that the hardest part of the process ultimately falls on their shoulders and only with hard work and dedication can they ultimately achieve consistent results. However, trading tools like the ones offered by Index Review provide important insights and serve as a helping hand in various circumstances.
Updated information is key for better trading decisions and the broker seems to be committed to ensuring its customer base can enjoy access to some of the latest market-moving headlines. Also, the market summaries and market research videos can be helpful especially for those still crafting their analysis skills.
Overall, the information available on the broker suggests that this is a brand focused on offering added value, and that’s something worth noting when choosing a reliable trading partner.
At the onset of this new trading week, markets are reacting to the Senate’s passing of US President Joe Biden’s $1.9 trillion fiscal stimulus package over the weekend, which the House could then sign into law in the coming days. Asian stockmarkets are pushing higher, with futures contracts for the Dow Jones index and the S&P 500 following suit.
Hopes for more fiscal stimulus have been a bedrock for stock market bulls since last year, though now it could feed into heightened expectations that US inflation could come back with a vengeance, thanks to the trillions that the US government and the Fed have poured into the economy.
Here are some other key events and economic data that markets will be eyeing this week:
Monday, 8 March: BOE Governor Andrew Bailey speech; Germany industrial production
Tuesday, 9 March: Eurozone GDP (final reading); Germany external trade
Friday, 12 March: UK GDP and industrial production; Eurozone industrial production; US consumer sentiment and producers price index
Key themes
US inflation expectations meets reality
Surging Treasury yields have spelt turmoil for global financial markets in recent weeks. As the story among investors goes, faster US inflation should bring forward the Fed’s eventual raising of interest rates. Such expectations prompted traders to ditch US Treasuries, which in turn sent yields soaring and also roiled global equities, especially more expensive tech stocks.
The Nasdaq 100 has endured three consecutive weeks of declines. However, it did manage to avoid a technical correction, which would have been 10% down from its record high in February, thanks to the buy-the-dip market action on Friday.
More selling of tech stocks could make precarious the Nasdaq 100 minis’ position above the 100-day simple moving average (SMA). The asset could then break below last Friday’s 12,212 support level, which was also a key region on several occasions in Q4 2020. To the upside, the 12,750 support-turned-resistance level is also one to watch for the immediate term.
At the time of writing, futures for Nasdaq 100 are tipping into the red and resting on their 100-day SMA.
Much could depend on how Treasury yields fare in light of the imminent fiscal stimulus injection, and also around the mid-week release of the US February consumer prices index.
Should both events point to US inflation making a roaring return, that could exert more downward pressure on the Nasdaq 100. However, a softer-than-expected CPI could dampen yields and offer tech stocks some breathing space.
Investors would also have to juxtapose Wednesday’s backward-looking CPI with Friday’s forward-looking US consumer sentiment data. Should Americans be found raring to spend once more to overcome lockdown fatigue, that could translate into heightened inflation expectations and another surge in Treasury yields, while prompting further losses in the Tech sector.
Will BOE, ECB react to rising yields?
With Fed members entering their blackout period ahead of the mid-March FOMC meeting, investors will be looking to the commentary by BOE Governor Andrew Bailey on Monday, as well as Thursday’s speech by ECB President Christine Lagarde after the European Central Bank’s policy meeting.
Global central bankers have been growing concerned that rising bond yields could tighten financial conditions, which could ultimately disrupt their respective economic recoveries.
Should either central bank official successfully dampen their respective bond yields and widen the gap with Treasury yields, that could weigh on their respective currencies while lending a further boost to the dollar index (DXY).
Note that the euro and the pound are the first and third largest constituents respectively on the DXY. Combined, the euro and sterling account for nearly 70% of the dollar index.
And should the GDP and industrial production readings from either side of the English Channel disappoint markets this week, that could further buffer support for the greenback which has been enjoying a resurgence of late, thanks to rising Treasury yields and also last Friday’s better-than-expected jobs report.
Disclaimer: The content in this article comprises personal opinions and should not be construed as containing personal and/or other investment advice and/or an offer of and/or solicitation for any transactions in financial instruments and/or a guarantee and/or prediction of future performance. ForexTime (FXTM), its affiliates, agents, directors, officers or employees do not guarantee the accuracy, validity, timeliness or completeness, of any information or data made available and assume no liability as to any loss arising from any investment based on the same.
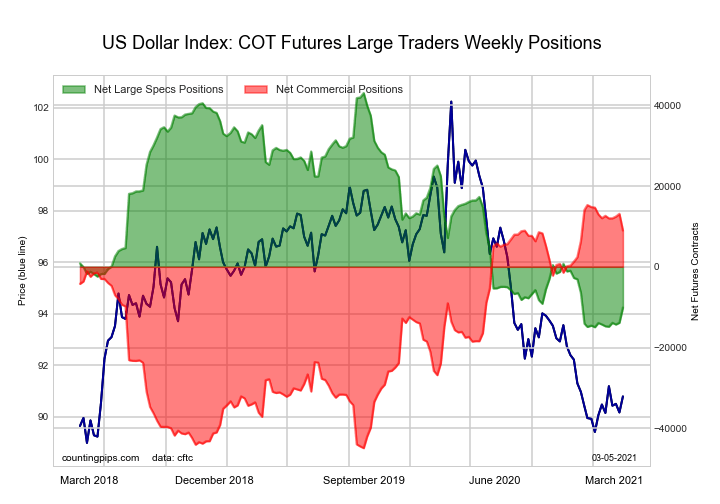
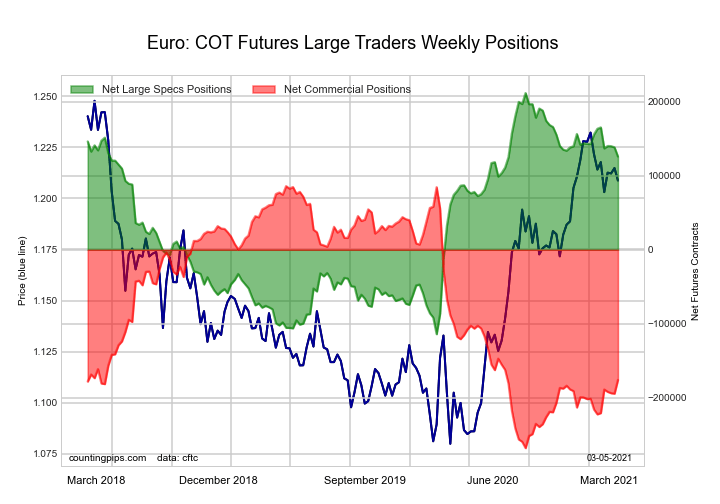
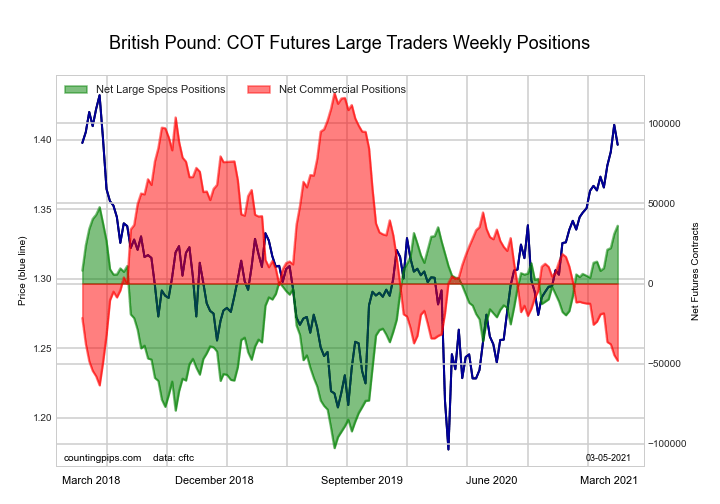
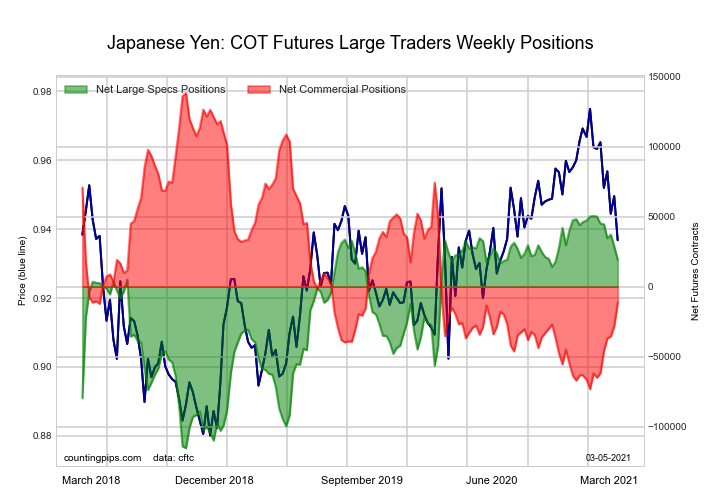
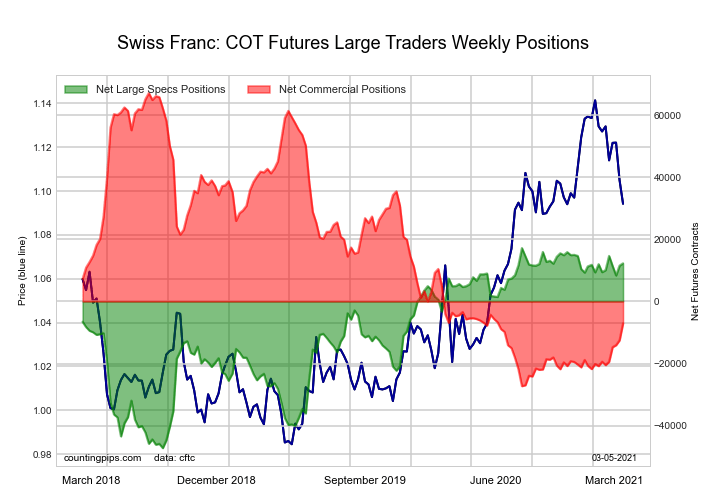
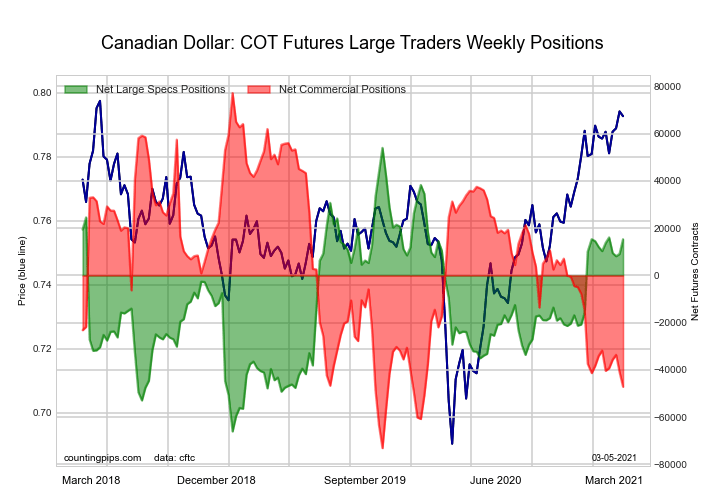
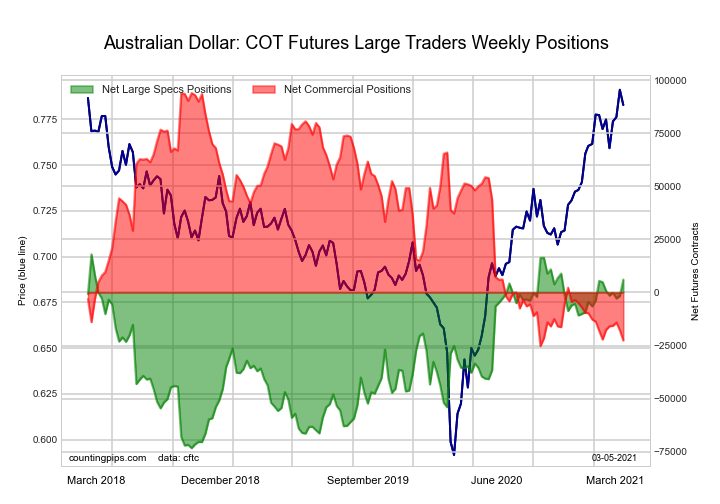
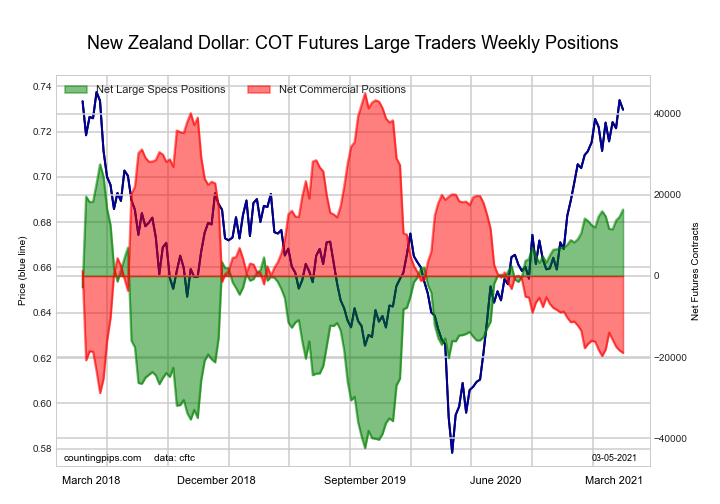
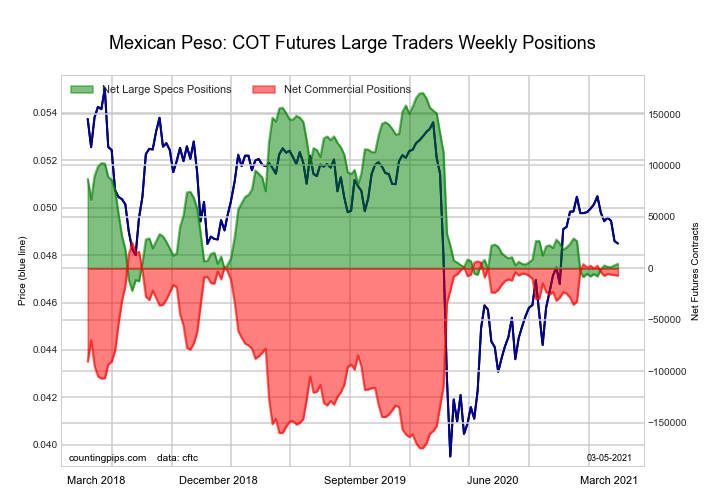
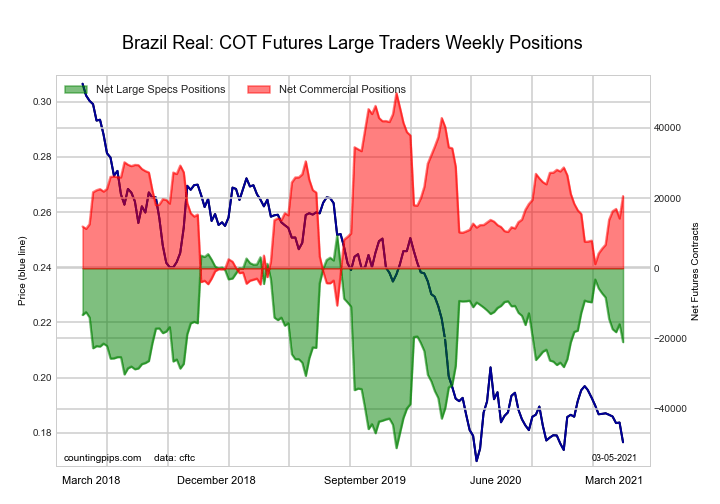
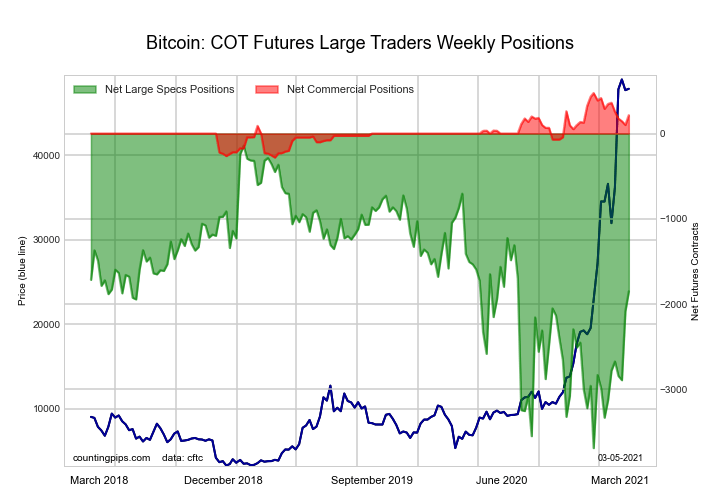
Here are the latest charts and statistics for the Commitment of Traders (COT) data published by the Commodities Futures Trading Commission (CFTC).
The latest COT data is updated through Tuesday March 02 2021 and shows a quick view of how large traders (for-profit speculators and commercial entities) were positioned in the futures markets. All currency positions are in direct relation to the US dollar where, for example, a bet for the euro is a bet that the euro will rise versus the dollar while a bet against the euro will be a bet that the euro will decline versus the dollar.
*COT Report: The COT data, released weekly to the public each Friday, is updated through the most recent Tuesday (data is 3 days old) and shows a quick view of how large speculators or non-commercials (for-profit traders) were positioned in the futures markets.
The CFTC categorizes trader positions according to commercial hedgers (traders who use futures contracts for hedging as part of the business), non-commercials (large traders who speculate to realize trading profits) and nonreportable traders (usually small traders/speculators).







 Article by