Next up on this week’s list of major market events is the European Central Bank which has a policy decision due today.
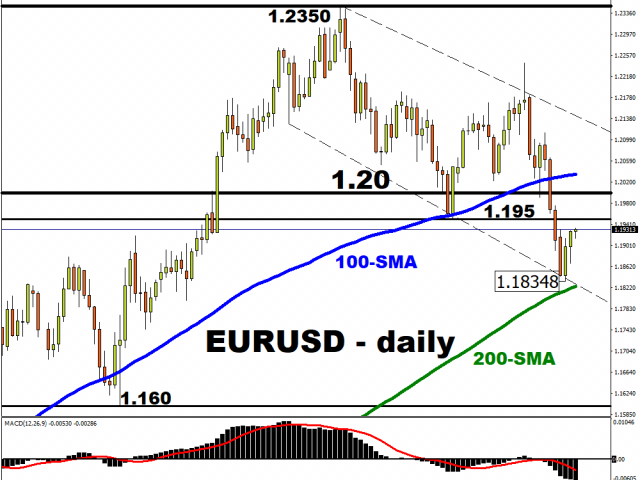
In the leadup to today’s ECB meeting, the euro has only managed to eke out a 0.1 percent advance against the US dollar so far this week, making it the smallest gainer on a week-to-date basis among G10 currencies versus the greenback. On a year-to-date basis, EURUSD has declined by more than 2%, nearly testing its 200-day simple moving average (SMA) as a support level on Monday before pulling back up.
Traders will be closely monitoring whether the world’s most-traded currency pair can breach 1.195, if it gets there, which was the support region for the currency pair in early February. Failure to breach could then see the currency pair come face to face with its 200-day SMA.
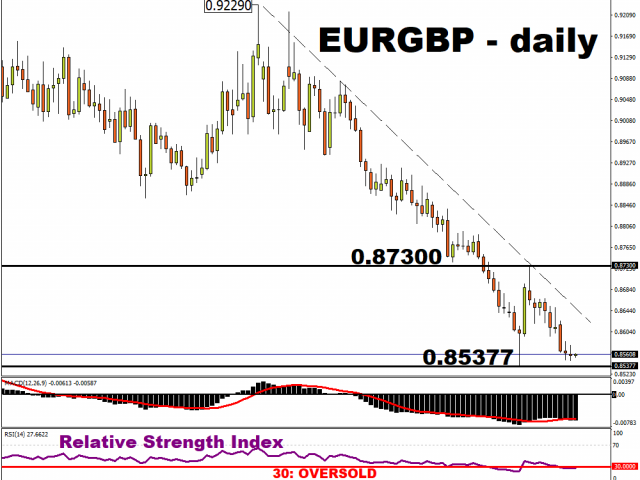
Meanwhile, EURGBP has weakened by more than 4% so far in 2021. However, this currency pair may be due for a pullback in the not-too-distant future, given that its 14-day relative strength index has already broken below the 30 line and is now in oversold territory.
What are markets expecting out of the ECB today?
Today, the European Central Bank is highly unlikely to adjust interest rates or its asset purchases programme. The ECB is also set to unveil its latest economic forecasts, which is expected to show policymakers’ belief that any inflation spike won’t stick around for long.
However, it’ll be the central bank’s characterization of the surging bond yields that harbours the biggest potential to jolt markets today.
Note that rising bond yields can be a double-edged sword. On one hand, it can be interpreted as a sign of economic optimism. On the other hand, it presents higher borrowing costs which impedes the government’s ability to raise funds for the economic recovery.
Hence, the ECB’s interpretation of the unsettling climb in bond yields, which has roiled global markets in recent weeks, could be crucial in determining how European assets perform in the immediate aftermath.
Watch out for these two words in particular: “unwarranted tightening”.
If ECB President Christine Lagarde uses those two words to describe how bond yields have been behaving of late, that could signal to the markets that the ECB is ready to step in to quell the bond rout.
And if markets believe that the central bank wants to and can push yields lower, that could heap even more downward pressure on the euro (note that the bloc’s currency holds a year-to-date decline against most of its G10 peers, except for the Swedish Krona, Japanese Yen, and the Swiss Franc).
Could EURUSD break below its 200-day SMA support?
And if European bond yields are suppressed while Treasury yields keep climbing, especially if today’s auction of $24 billion in 30-year Treasuries is met with lackluster demand, then the widening gap between European and US bond yields could even drag EURUSD below its 200-day SMA.
For now, it remains a battle of wits between the markets and the ECB in ascertaining how high yields can go. And Lagarde’s words may play an outsized role in determining the trajectory for European bond yields, and for the euro.
Disclaimer: The content in this article comprises personal opinions and should not be construed as containing personal and/or other investment advice and/or an offer of and/or solicitation for any transactions in financial instruments and/or a guarantee and/or prediction of future performance. ForexTime (FXTM), its affiliates, agents, directors, officers or employees do not guarantee the accuracy, validity, timeliness or completeness, of any information or data made available and assume no liability as to any loss arising from any investment based on the same.
– Ten years ago, on March 11, 2011, the biggest recorded earthquake in Japanese history hit the country’s northeast coast. It was followed by a tsunami that traveled up to 6 miles (10 kilometers) inland, reaching heights of over 140 feet (43.3 meters) in some areas and sweeping entire towns away in seconds.
This disaster left nearly 20,000 people dead or missing. It also destroyed the Fukushima Daiichi Nuclear Power Station and released radioactive materials over a large area. The accident triggered widespread evacuations, large economic losses and the eventual shutdown of all nuclear power plants in Japan. A decade later, the nuclear industry has yet to fully to address safety concerns that Fukushima exposed.
We are scholars specializing in engineering and medicine and public policy, and have advised our respective governments on nuclear power safety. Kiyoshi Kurokawa chaired an independent national commission, known as the NAIIC, created by the Diet of Japan to investigate the root causes of the Fukushima Daiichi accident. Najmedin Meshkati served as a member and technical adviser to a committee appointed by the U.S. National Academy of Sciences to identify lessons from this event for making U.S. nuclear plants safer and more secure.
An International Atomic Energy Agency investigator examines Reactor Unit 3 at the damaged Fukushima Daiichi plant, May 27, 2011. Greg Webb, IAEA/Flickr, CC BY-SA
Those reviews and manyothers concluded that Fukushima was a man-made accident, triggered by natural hazards, that could and should have been avoided. Experts widely agreed that the root causes were lax regulatory oversight in Japan and an ineffective safety culture at the utility that operated the plant.
These problems are far from unique to Japan. As long as commercial nuclear power plants operate anywhere in the world, we believe it is critical for all nations to learn from what happened at Fukushima and continue doubling down on nuclear safety.
How the 2011 earthquake and tsunami crippled the Fukushima Daiichi nuclear plant, filmed one month after the disaster.
Failing to anticipate and plan
The 2011 disaster delivered a devastating one-two punch to the Fukushima plant. First, the magnitude 9.0 earthquake knocked out off-site electric power. Next, the tsunami breached the plant’s protective sea wall and swamped portions of the site.
Flooding disabled monitoring, control and cooling functions in multiple units of the six-reactor complex. Despite heroic efforts by plant workers, three reactors sustained severe damage to their radioactive cores and three reactor buildings were damaged by hydrogen explosions.
Off-site releases of radioactive materials contaminated land in Fukushima and several neighboring prefectures. Some 165,000 people left the area, and the Japanese government established an exclusion zone around the plant that extended over 311 square miles (807 kilometers) in its largest phase.
For the first time in the history of constitutional democratic Japan, the Japanese Parliament passed a law creating an independent national commission to investigate the root causes of this disaster. In its report, the commission concluded that Japan’s Nuclear Safety Commissionhad never been independent from the industry, nor from the powerful Ministry of Economy, Trade, and Industry, which promotes nuclear power.
For its part, plant operator Tokyo Electric Power Company, or TEPCO, had a history of disregard for safety. The company had recently released an error-prone assessment of tsunami hazards at Fukushima that significantly underestimated the risks.
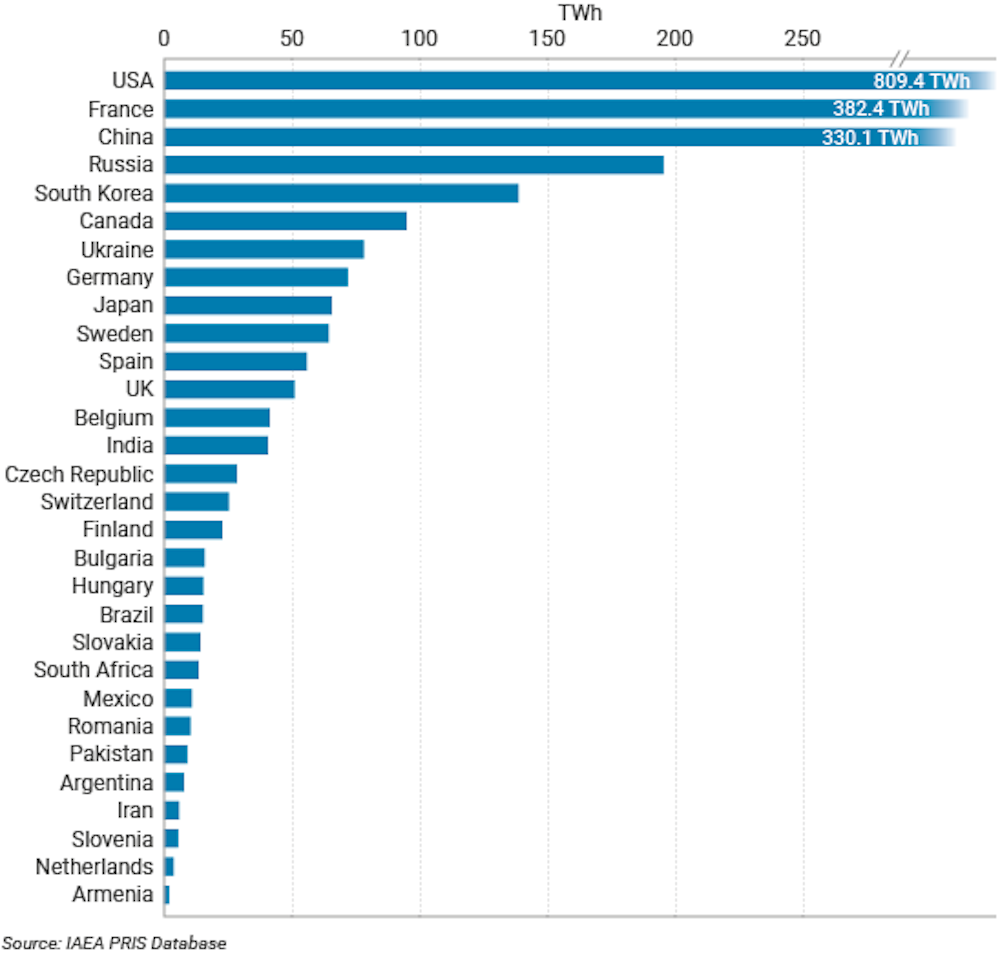
Nuclear power generates about 10% of the world’s electricity (TWh = terawatt-hours). About 50 new plants are under construction, but many operating plants are aging. World Nuclear Association, CC BY-ND
Events at the Onagawa Nuclear Power Station, located 39 miles (64 kilometers) from Fukushima, told a contrasting story. Onogawa, which was owned and operated by the Tohoku Electric Power Company, was closer to the earthquake’s epicenter and was hit by an even larger tsunami. Its three operating reactors were the same type and vintage as those at Fukushima, and were under the same weak regulatory oversight.
But Onogawa shut down safely and was remarkably undamaged. In our view, this was because the Tohoku utility had a deep-seated, proactive safety culture. The company learned from earthquakes and tsunamis elsewhere – including a major disaster in Chile in 2010 – and continuously improved its countermeasures, while TEPCO overlooked and ignored these warnings.
Regulatory capture and safety culture
When a regulated industry manages to cajole, control or manipulate agencies that oversee it, rendering them feckless and subservient, the result is known as regulatory capture. As the NAIIC report concluded, Fukushima was a textbook example. Japanese regulators “did not monitor or supervise nuclear safety….They avoided their direct responsibilities by letting operators apply regulations on a voluntary basis,” the report observed.
Effective regulation is necessary for nuclear safety. Utilities also need to create internal safety cultures – a set of characteristics and attitudes that make safety issues an overriding priority. For an industry, safety culture functions like the human body’s immune system, protecting it against pathogens and fending off diseases.
A plant that fosters a positive safety culture encourages employees to ask questions and to apply a rigorous and prudent approach to all aspects of their jobs. It also fosters open communications between line workers and management. But TEPCO’s culture reflected a Japanese mindset that emphasizes hierarchy and acquiescence and discourages asking questions.
There is ample evidence that human factors such as operator errors and poor safety culture played an instrumental key role in all three major accidents that have occurred at nuclear power plants: Three Mile Island in the U.S. in 1979, Chernobyl in Ukraine in 1986 and Fukushima Daiichi in 2011. Unless nuclear nations do better on both counts, this list is likely to grow.
Global nuclear safety grade: Incomplete
Today there are some 440 nuclear power reactors operating around the world, with about 50 under construction in countries including China, India, Pakistan, Bangladesh, Belarus, Turkey and the United Arab Emirates.
Many advocates argue that in light of the threat of climate change and the increasing need for carbon-free baseload electricity generation, nuclear power should play a role in the world’s future energy mix. Others call for abolishing nuclear power. But that may not be feasible in the foreseeable future.
In our view, the most urgent priority is developing tough, system-oriented nuclear safety standards, strong safety cultures and much closer cooperation between countries and their independent regulators. We see worrisome indications in the U.S. that independent nuclear regulation is eroding, and that nuclear utilities are resisting pressure to learn and delaying adoption of internationally accepted safety practices, such as adding filters to prevent radioactive releases from reactor containment buildings with the same characteristics as Fukushima Daiichi.
Author Najmedin Meshkati holding an earthquake railing in a Fukushima Daiichi control room during a 2012 site visit. Najmedin Meshkati, CC BY-ND
The most crucial lesson we see is the need to counteract nuclear nationalism and isolationism. Ensuring close cooperation between countries developing nuclear projects is essential today as the forces of populism, nationalism and anti-globalism spread.
We also believe the International Atomic Energy Agency, whose mission is promoting safe, secure and peaceful uses of nuclear energy, should urge its member states to find a balance between national sovereignty and international responsibility when it comes to operating nuclear power reactors in their territories. As Chernobyl and Fukushima taught the world, radiation fallout does not stop at national boundaries.
We believe the world remains at the same juncture it faced in 1989, when then-Sen. Joseph R. Biden Jr. made this perceptive argument:
“A decade ago, Three Mile Island was the spark that ignited the funeral pyre for a once-promising energy source. As the nuclear industry asks the nation for a second look in the context of global warming, it is fair to watch how its advocates respond to strengthened safety oversight. That will be the measure of whether nuclear energy becomes a phoenix or an extinct species.”
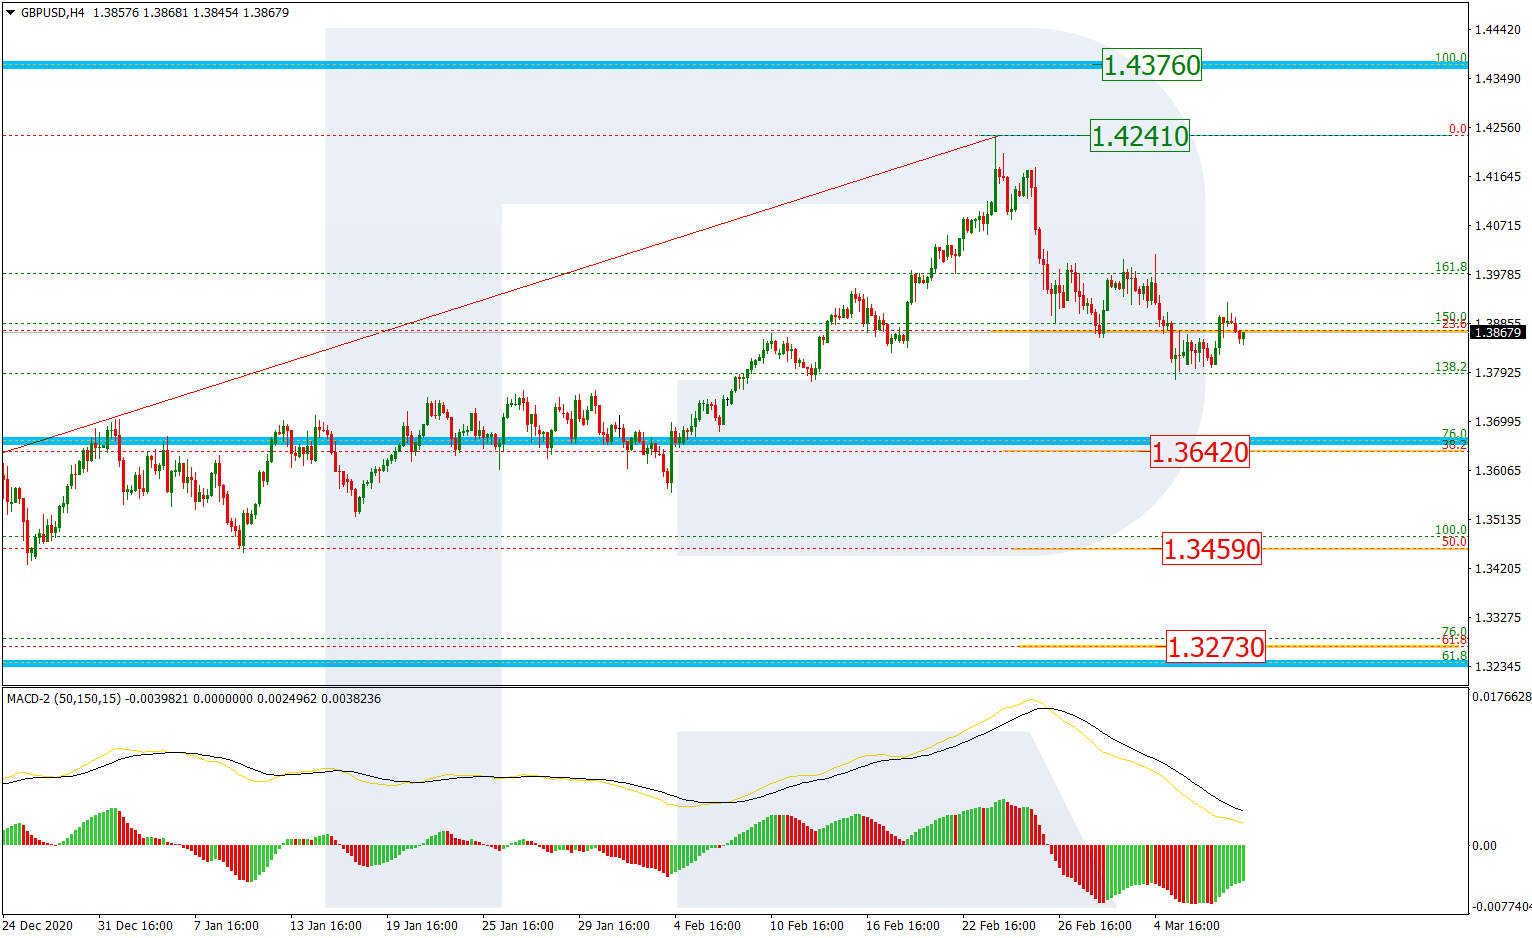
As we can see in the H4 chart, the situation hasn’t changed much. After finishing the uptrend and then reaching 23.6% fibo, GBPUSD is starting a short-term pullback, which may be followed by a further decline towards 38.2%, 50.0%, and 61.8% fibo at 1.3642, 1.3459, and 1.3273 respectively. A breakout of the high will result in a further uptrend towards the long-term fractal high at 1.4376.
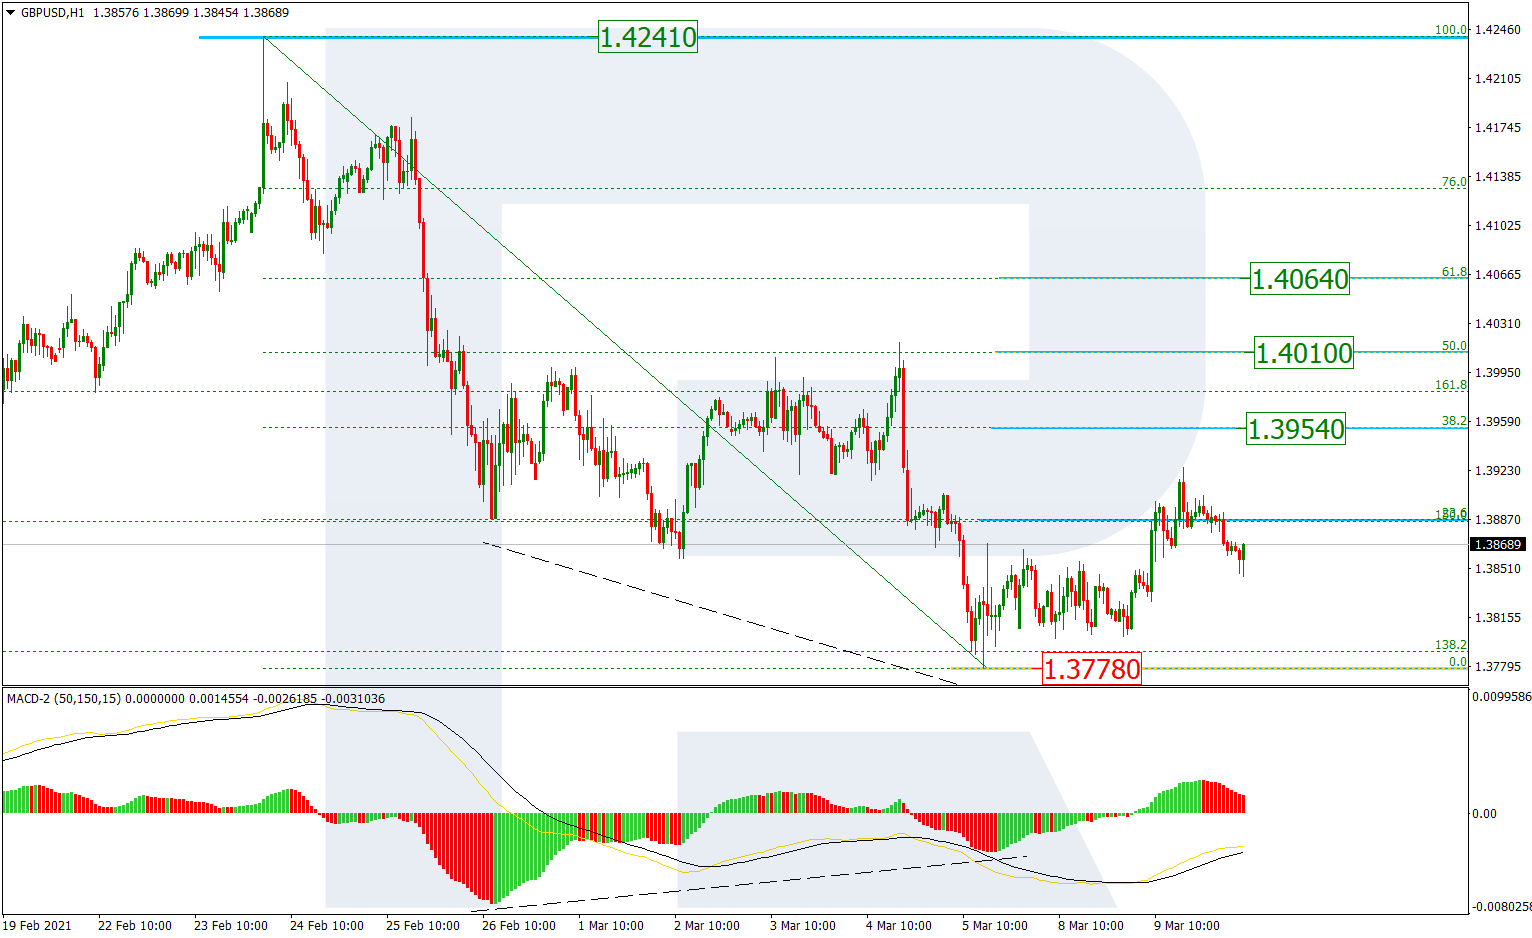
The H1 chart shows an ascending correctional movement after a convergence on MACD, which has already reached 23.6% and may later continue towards 38.2%, 50.0%, and 61.8% fibo at 1.3954, 1.4010, and 1.4064 respectively. A breakout of the low at 1.3778 will result in a further mid-term downtrend.
EURJPY, “Euro vs. Japanese Yen”
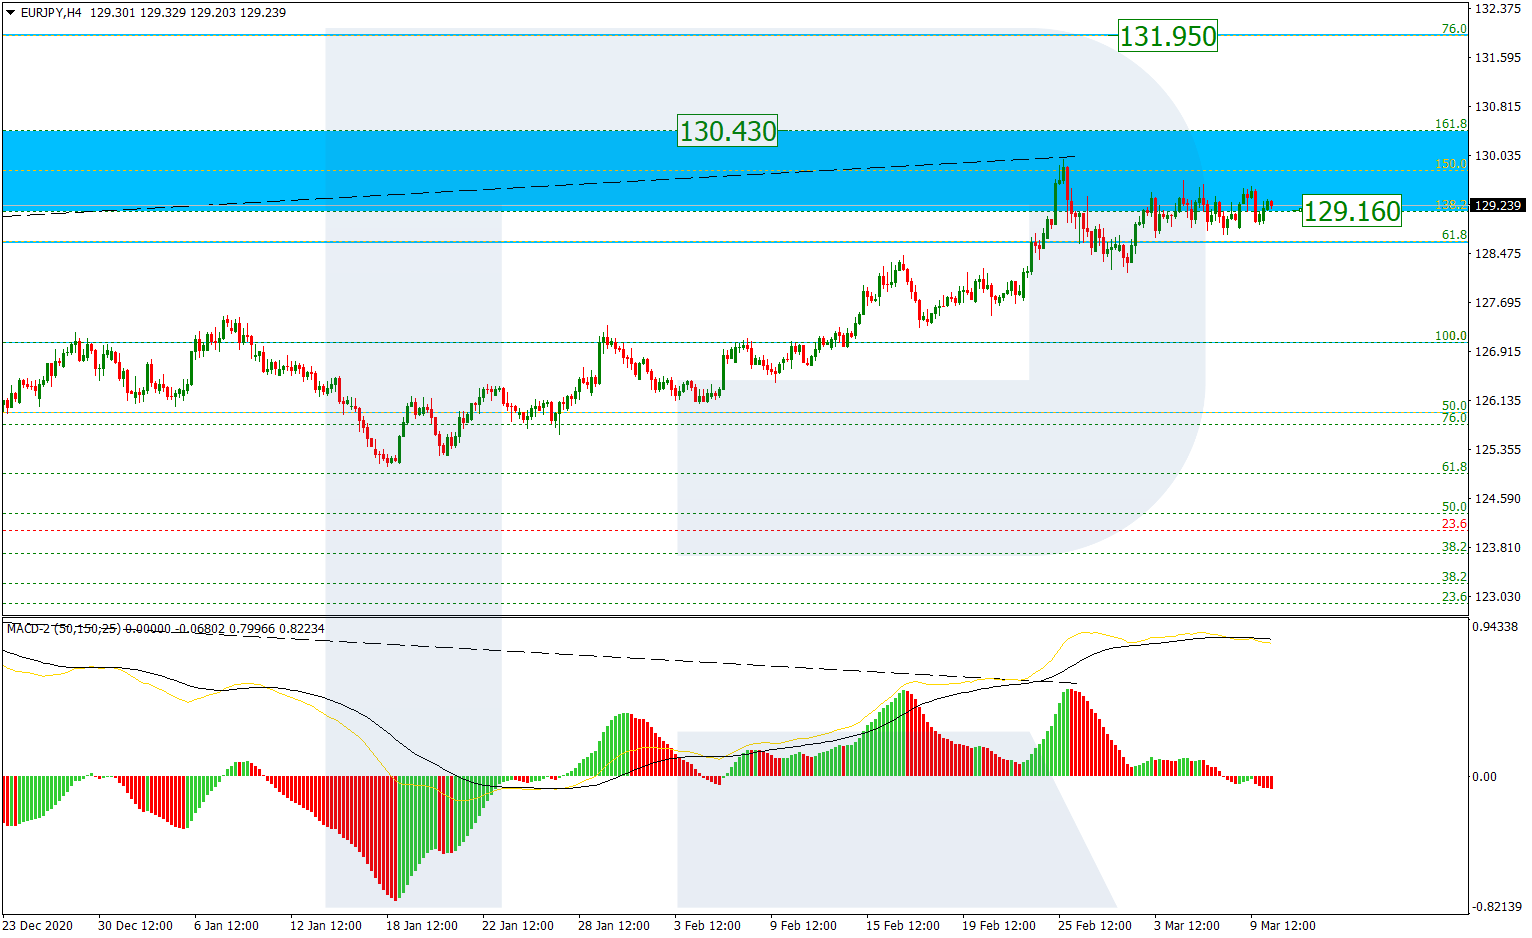
As we can see in the H4 chart, after entering the post-correctional extension area between 138.2% and 161.8% fibo at 129.16 and 130.43 respectively, EURJPY is forming the Triangle correctional pattern. Possibly, the price may complete this correctional movement by breaking the pattern to the upside. After that, the instrument may continue trading within the uptrend to reach 76.0% at 131.95.
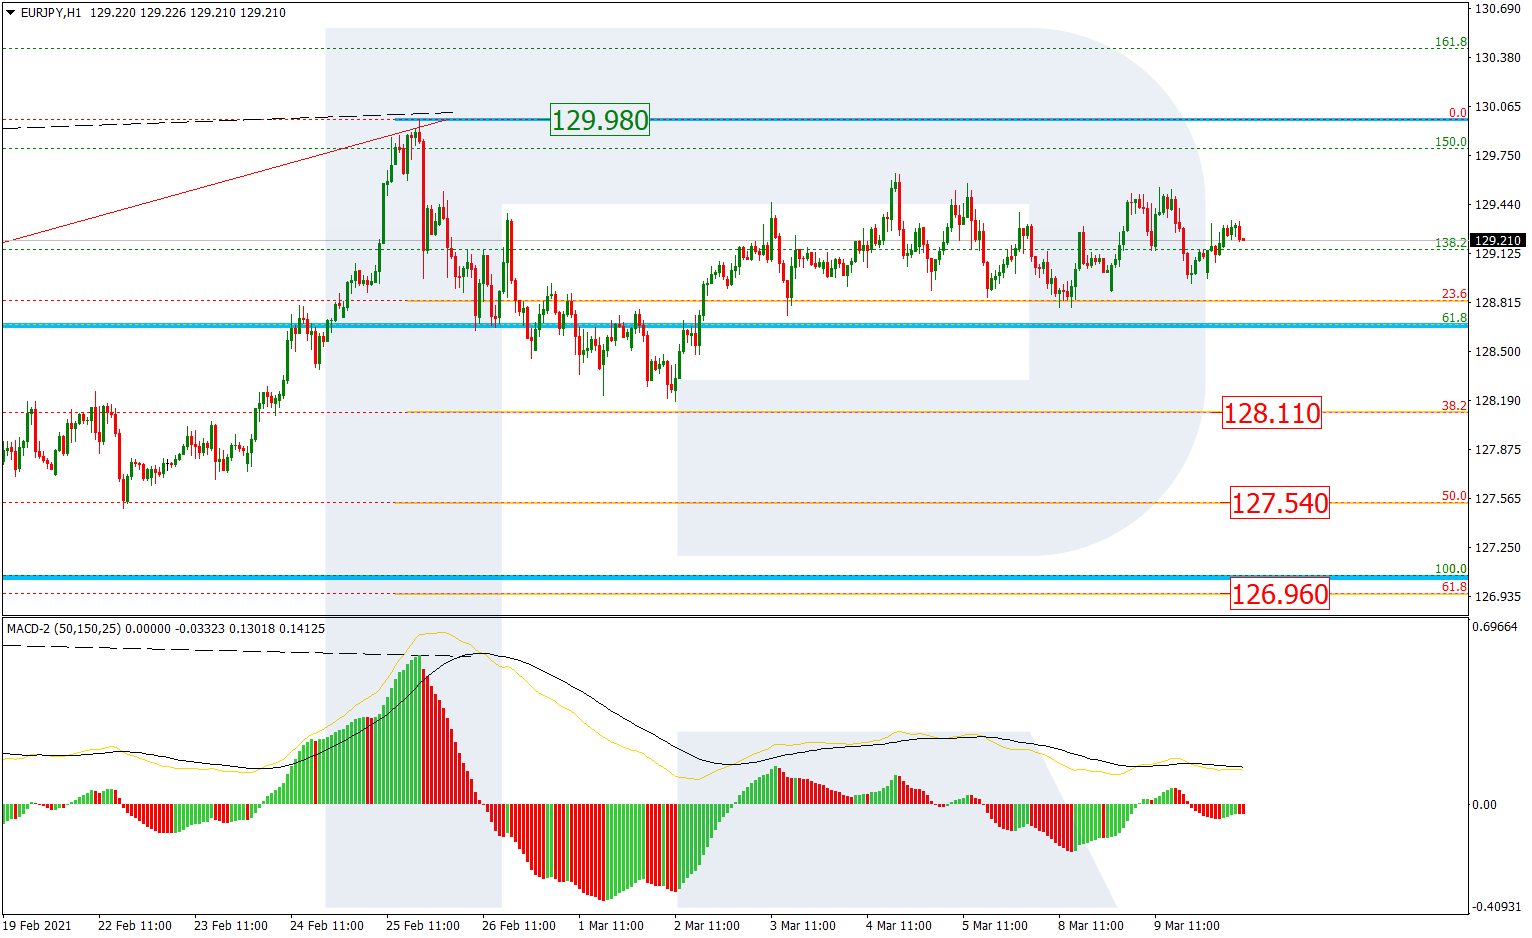
The H1 chart shows a more detailed structure of the current correction. The first descending wave couldn’t reach 38.2% fibo at 128.11 but the rising structure that followed also failed to update the high at 129.98. In this case, the market may start a new decline to reach 50.0% and 61.8% fibo at 127.54 and 126.96 respectively.
Attention! Forecasts presented in this section only reflect the author’s private opinion and should not be considered as guidance for trading. RoboForex LP bears no responsibility for trading results based on trading recommendations described in these analytical reviews.
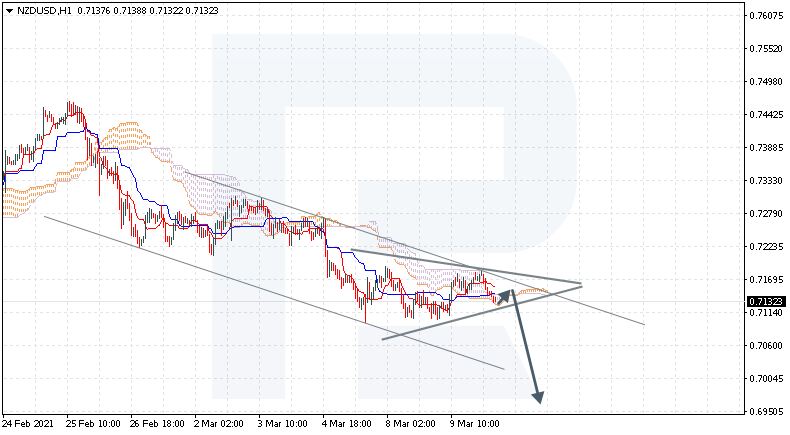
NZDUSD is trading at 0.7132; the instrument is moving inside Ichimoku Cloud, thus indicating a sideways tendency. The markets could indicate that the price may test the cloud’s upside border at 0.7140 and then resume moving downwards to reach 0.6965. Another signal in favor of a further downtrend will be a rebound from the upside border of the Triangle pattern. However, the bearish scenario may be canceled if the price breaks the cloud’s upside border and fixes above 0.7205. In this case, the pair may continue growing towards 0.7295. To confirm further decline, the asset must break the pattern’s downside border and fix below 0.7095.
USDMXN. “US Dollar vs Mexican Peso”
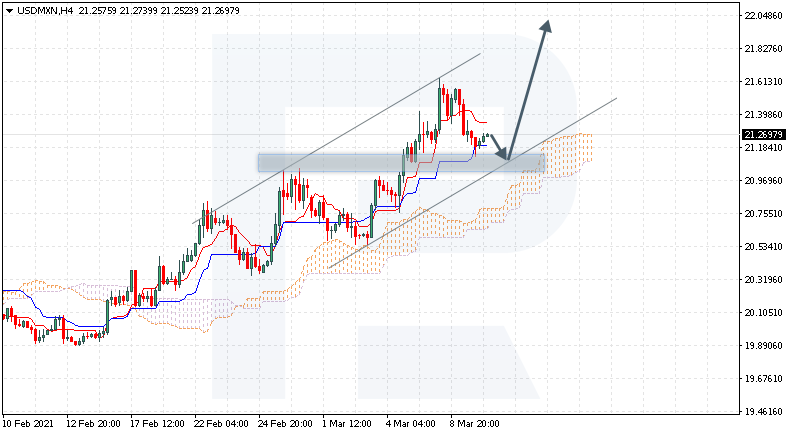
USDMXN is trading at 21.26; the instrument is moving above Ichimoku Cloud, thus indicating an ascending tendency. The markets could indicate that the price may test Tenkan-Sen and Kijun-Sen at 21.45 and then resume moving upwards to reach 22.05. Another signal in favor of a further uptrend will be a rebound from the rising channel’s downside border. However, the bullish scenario may no longer be valid if the price breaks the cloud’s downside border and fixes below 20.50. In this case, the pair may continue falling towards 19.65.
EURUSD, “Euro vs US Dollar”
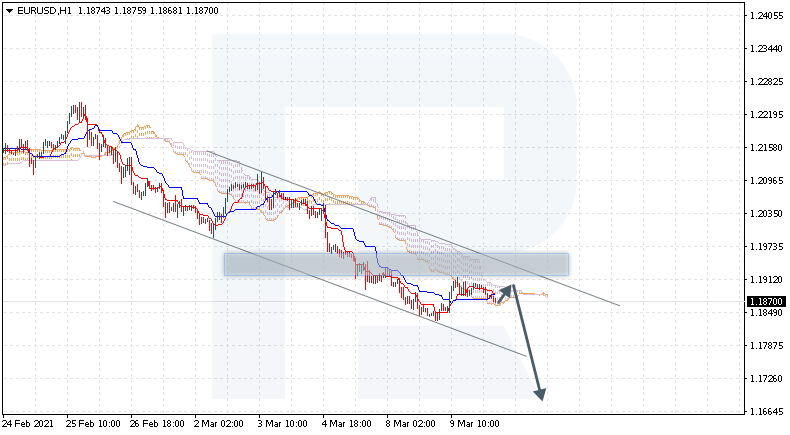
EURUSD is trading at 1.1870; the instrument is moving inside Ichimoku Cloud, thus indicating a sideways tendency. The markets could indicate that the price may test the cloud’s upside border at 1.1895 and then resume moving downwards to reach 1.1675. Another signal in favor of a further downtrend will be a rebound from the descending channel’s upside border. However, the bearish scenario may be canceled if the price breaks the cloud’s upside border and fixes above 1.1920. In this case, the pair may continue growing towards 1.2010.
Attention! Forecasts presented in this section only reflect the author’s private opinion and should not be considered as guidance for trading. RoboForex LP bears no responsibility for trading results based on trading recommendations described in these analytical reviews.
The European currency has regained some of the losses incurred on Tuesday within the expected technical pullback. This week, investors await the ECB’s decision on the further stimulus of the Eurozone economy and the need to put pressure on bond yields. In this light, the growth of the euro may be limited.
Trading recommendations
Support levels: 1.1799, 1.1746
Resistance levels: 1.1952, 1.2113
The main scenario for trading EUR/USD is selling. The ADX is reacting to any southern price movement, which indicates the likelihood of a resumption of the decline soon. After the pullback, there is a slight decrease in bearish pressure, which may signal a short-term stop in the pair. But as long as the price stays below the moving averages, selling remains relevant.
Alternative scenario: if the price gains a foothold above the level of 1.1952, the pair may reach the 1.2113 level.
News feed for 2021.03.10:
– The US Core Consumer Price Index (m/m) (Feb) at 15:30 (GMT+2).
The GBP/USD currency pair
Technical indicators of the currency pair:
Prev Open: 1.3818
Prev Close: 1.3885
% chg. over the last day: +0.48%
The sterling has shown about the same pullback as the euro, which indicates the absence of strong drivers for the price movement in either direction. But the British currency still looks stronger than the others. New OECD forecasts released on Tuesday show an improvement in economic growth expectations by 0.9% to 5.1% in 2021.
Trading recommendations
Support levels: 1.3775, 1.3680
Resistance levels: 1.3924, 1.3997
The main scenario for GBP/USD is trading sideways between 1.3924 and 1.3775. A decline in the Asian session has triggered a strong ADX reaction, which may signal a resumption of southward direction. But the rest of the indicators point to flat. Another important detail is that the price has stopped near the SMA 50 moving average. This casts doubt on the continuation of the pair’s fall.
Alternative scenario: if the pair consolidates above 1.3924, it may resume its growth. A breakdown of 1.3775 could trigger a further decline.
There is no news feed for today.
The USD/JPY currency pair
Technical indicators of the currency pair:
Prev Open: 108.87
Prev Close: 108.47
% chg. over the last day: -0.37%
The decline in Treasury yields and the technical pullback of the dollar index put downward pressure on the pair. At the same time, a bearish engulfing candlestick has formed on the daily chart, which may signal the beginning of a deep correction. However, the fundamental background may prevent further decline in the dollar index. The expected US inflation data may support dollar bulls.
Trading recommendations
Support levels: 107.08, 106.12
Resistance levels: 109.34, 109.86
The main scenario is cautious buying. The pullback on Tuesday did not affect the technical indicators of the northern impulse. The price holds above the moving averages, while the ADX only reacts to price increases. These are all signs of the presence of bullish power in the pair.
An alternative scenario implies the price-fixing below 108.36. In this case, the pair may return to the decline to 107.08.
News feed for 2021.03.10:
– The US Core Consumer Price Index (m/m) (Feb) at 15:30 (GMT+2).
The USD/CAD currency pair
Technical indicators of the currency pair:
Prev Open: 1.2661
Prev Close: 1.2636
% chg. over the last day: -0.20%
USD/CAD continues to remain in a narrow sideways range. The intraday price movement leaves long shadows in both directions, which is a sign of a flat. But today the pair may get out of the narrow range after the publication of the decision of the Bank of Canada.
Trading recommendations
Support levels: 1.2592, 1.2467
Resistance levels: 1.2745, 1.2845
The main scenario is trading in a sideways range between 1.2745 and 1.2592. None of the indicators signal the beginning of any movement in the medium term. The MACD is near zero, and the price shows frequent breakouts of the moving averages. This indicates the continuation of trading in a narrow sideways range.
Alternative scenario: if the price manages to gain a foothold above 1.2745, the pair may resume growth to 1.2845. A breakdown of 1.2592 will resume southward movement.
News feed for 2021.03.10:
– The US Core Consumer Price Index (m/m) (Feb) at 15:30 (GMT+2);
– Bank of Canada Interest Rate Decision at 17:00 (GMT+2);
This article reflects a personal opinion and should not be interpreted as an investment advice, and/or offer, and/or a persistent request for carrying out financial transactions, and/or a guarantee, and/or a forecast of future events.
After a four-day rise of the dollar, the foreign exchange market began to show a correction tendency. Against the backdrop of falling oil prices, the government bonds yield declined. American Treasuries stabilized near 1.55%, which led to a slight pullback of the dollar index. At the same time, the 2-year US bonds yield is indicating an upward tendency, remaining slightly above 0.15%.
The Nasdaq 100 gained 4% amid prices leap of some of the most expensive stocks, such as Tesla Inc., which increased by 20%. The resumption of the bullish rally is based on optimism about economic growth. On Tuesday, OECD released its updated forecasts, which boosted the need for risky assets. According to the organization, the US economic recovery, boosted by President Joe Biden’s stimulus package, will help to accelerate the global economic recovery.
The global growth forecast for 2021 has been revised from 4.2% to 5.6%. For the United States, the expected figures were twice as high as in December forecasts – 6.5%. The OECD models are based on the assumption that the US government stimulus measures will increase the volume of production by about 3-4%, which will add 1% to the total world production.
But economic growth is expected to be unbalanced. OECD reduced growth estimates for European countries. For Germany, estimates of growth declined by 0.2%, for France – by 0.6%, and for Italy – by 1.0%. OECD forecasts for this and the next year assume that the economies of Italy, Spain, and the United Kingdom will not make up for GDP losses even by the end of 2022. Trade Department data that was released on Tuesday shows that Eurozone GDP decreased by 0.7% in the last three months of 2020, which is 0.1% more than it was previously calculated.
The market will now shift its focus to central banks meetings from Tokyo to Ottawa. The decision of the Bank of Canada is expected to be published today, and after that, the investors will look forward to the announcement of the results of the ECB meeting on Thursday. Against this background, volatility can gradually increase.
Main market quotes:
S&P 500 (F) 3,871.62 -1.63 (-0.04%)
Dow Jones 31,832.74 +30.30 (+0.10%)
DAX 14,456.05 +18.11 (+0.13%)
FTSE 100 6,702.04 -28.30 (-0.42%)
USD Index 92.093 +0.129 (+0.14%)
Important events:
– US Core Consumer Price Index (m/m) (Feb) at 15:30 (GMT+2);
– Bank of Canada Interest Rate Decision at 17:00 (GMT+2);
This article reflects a personal opinion and should not be interpreted as an investment advice, and/or offer, and/or a persistent request for carrying out financial transactions, and/or a guarantee, and/or a forecast of future events.
If you have an appetite for volatility, then feast your eyes on Tesla.
Shares of the electric car marker closed almost 20% higher on Tuesday, their biggest single day gain since February 2020!
This development has brought bulls back into the game, halting a five-day slump that saw shares drop 21.63% before Tuesday’s rally.
Why did shares rally?
Buying sentiment towards Tesla shares was boosted by a rally in Bitcoin. Remember when Tesla announced that it bought $1.5 billion worth of bitcoin and said it would start accepting the cryptocurrency as a payment method for its product? Well, the company stocks are now strongly linked to the performance on Bitcoin!
In yesterday’s afternoon report, we discussed how the “great rotation” was taking a breather. This pause in the rotation trade offered a chance for tech stocks to stage a stunning recovery.
Reports that car sales in China climbed in February while local rivals saw declines. The electric car market sold 18,318 Shanghai-made Model 3s and Model Ys last month, up 18.3% from the 15,484 sold in January.
A change in overall sentiment towards expensive technology stocks, magnetizing investors back towards Tesla and other EV markets.
Musk laughing all the way to the bank
Imagine making $25 billion in one day?
After Tesla Inc.’s near 20% jump on Tuesday, this became Elon Musk’s reality. Such has pushed the billion founder’s fortune to a whopping $174 billion, narrowing the gap with Jeff Bezos, the world’s richest person.
Will bulls remain in the driving seat?
Tesla continues to reinforce its position as the leading electric car marker globally, even with competition heating up.
After taking a giant step towards blue-chip respectability last year, its market value has swelled to over $640 billion.
Over the past few weeks, there have been some sharp selloffs, especially after higher Treasury yields fuelled a rotation from expensive growth stocks to value companies. This is telling on the company’s shares which are down over 4.5% year-to-date. However, the business outlook remains encouraging with average annual growth in vehicle deliveries set to hit 50% over a multi-year horizon. It just remains a question of whether bulls could weather the great rotation punishing expensive growth stocks. Time will tell.
What about the technicals?
Tuesday’s rally could be a turning point for Tesla shares.
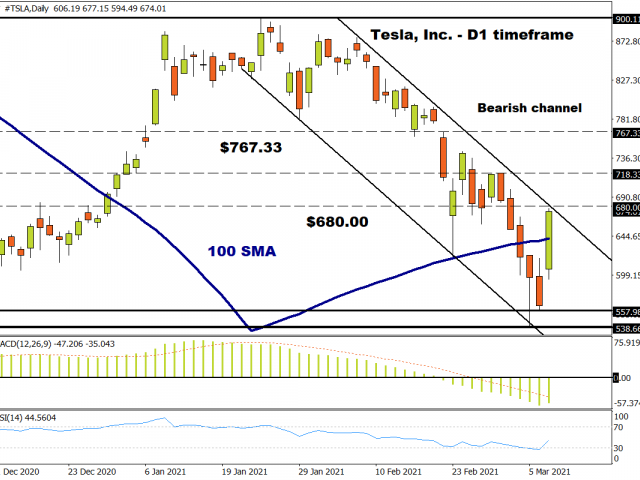
Prices are trading back above the 100 Simple Day Moving Average while the RSI has rebounded from the oversold territory (below 30.00). An intraday breakout above $680 may encourage an incline towards $718.33 and $767.33.
Should prices fail to break out of the daily bearish channel, this could result in a decline back towards $619.10 and $557.98. Overall, lagging indicators are offering a mixed picture. Although the MACD trades to the downside, the RSI signals a possible rebound.
Disclaimer: The content in this article comprises personal opinions and should not be construed as containing personal and/or other investment advice and/or an offer of and/or solicitation for any transactions in financial instruments and/or a guarantee and/or prediction of future performance. ForexTime (FXTM), its affiliates, agents, directors, officers or employees do not guarantee the accuracy, validity, timeliness or completeness, of any information or data made available and assume no liability as to any loss arising from any investment based on the same.
Global investors are readying themselves for two major events today:
The February US consumer price index (CPI) announcement
The House of Representative’s possible vote on the $1.9 trillion fiscal stimulus plan
Both events could spur inflation expectations higher and trigger a massive reaction in Treasury yields, which could then jolt multiple major assets including the dollar, gold, and tech stocks.
Wall Street is expecting the headline CPI to register a year-on-year growth of 1.7%, which would be its highest reading since February 2020, before the pandemic took hold. And the vote on President Joe Biden’s pandemic relief bill, if passed, could strengthen investors’ belief that inflation will come roaring back.
Heightened inflation expectations are arguably the biggest talking point in global markets at the moment. And with this viewpoint gaining critical mass, investors are forced to reassess their portfolios.
Today’s release of the CPI figures, though backward-looking, may lend more insight as to whether markets are getting ahead of themselves, or if their repositioning of late has been warranted.
92 DXY depends on higher-than-expected CPI
At the onset of 2021, most on Wall Street were firm in their belief that the US dollar would weaken further, based on the idea that faster inflation would erode the greenback’s purchasing power.
Yet the dollar index (DXY) has advanced by more than 2% on a year-to-date basis, thank to those rising Treasury yields which in turn make dollar assets more appealing.
So here we are, with the Dollar index hovering just below the 92 mark at the time of writing, despite completing a head-and-shoulders pattern earlier this year.
The DXY’s pullback yesterday to around the 92 line was in tandem with moderating yields on Tuesday, as 10-year yields fell by some 7 basis points. There were technical factors at play as well, with the DXY’s 14-day relative strength index (RSI) hitting the 70 line. Such a technical event typically heralds an immediate pullback, as was the case overnight.
Although momentum is still pointing north, the dollar index’s ability to hang on to the 92 handle may depend on the upcoming inflation data release.
A lower-than-expected CPI could mean further moderation in Treasury yields, which in turn should translate into the DXY paring more of its recent gains. However, the passage of the fiscal stimulus plan could convince investors to stick with their inflation outlook, which has supported the DXY so far in 2021.
Gold resurfaces above $1700 … for now
Gold prices have been able to come up for air above the psychologically-important $1700 level, thanks to the moderating dollar.
Note that bullion has an inverse relationship with the greenback; each tends to move in the opposite direction to the other. From a technical perspective, spot gold’s reprieve comes after its 14-day RSI hit oversold territory which triggered the slight recovery.
Still, gold’s downward trend since posting its new record high in August remains firmly intact, with its 100-day simple moving average (SMA) having followed its 50-day counterpart to move below the 200-SMA. These technical events are referred to as a ‘death cross’.
Although gold has historically been seen as a hedge against inflation (preserve wealth when prices are rising), it now has to contend with rising Treasury yields too. Given the fact that bullion is a zero-yielding asset, higher Treasury yields make gold less appealing. And even though real yields (yields after stripping out inflation) remain in negative territory, gold is still finding it extremely tough to garner favour among investors in this current market climate.
So if today’s events translate into higher yields, that could drag gold back below the $1700 once more.
Disclaimer: The content in this article comprises personal opinions and should not be construed as containing personal and/or other investment advice and/or an offer of and/or solicitation for any transactions in financial instruments and/or a guarantee and/or prediction of future performance. ForexTime (FXTM), its affiliates, agents, directors, officers or employees do not guarantee the accuracy, validity, timeliness or completeness, of any information or data made available and assume no liability as to any loss arising from any investment based on the same.
The price of West Texas Intermediate (WTI) crude oil has surged higher more than 500% since the lows of the pandemic in March 2020. Demand for crude oil has rapidly increased as countries roll out the coronavirus vaccine and get their economies moving once again.
Oil prices received a further boost earlier this month after OPEC and Russia mutually agreed to not increase the output. This is after the supply curbs that were initiated by the countries to help rebalance the oil market after dropping to an 18-year low last year.
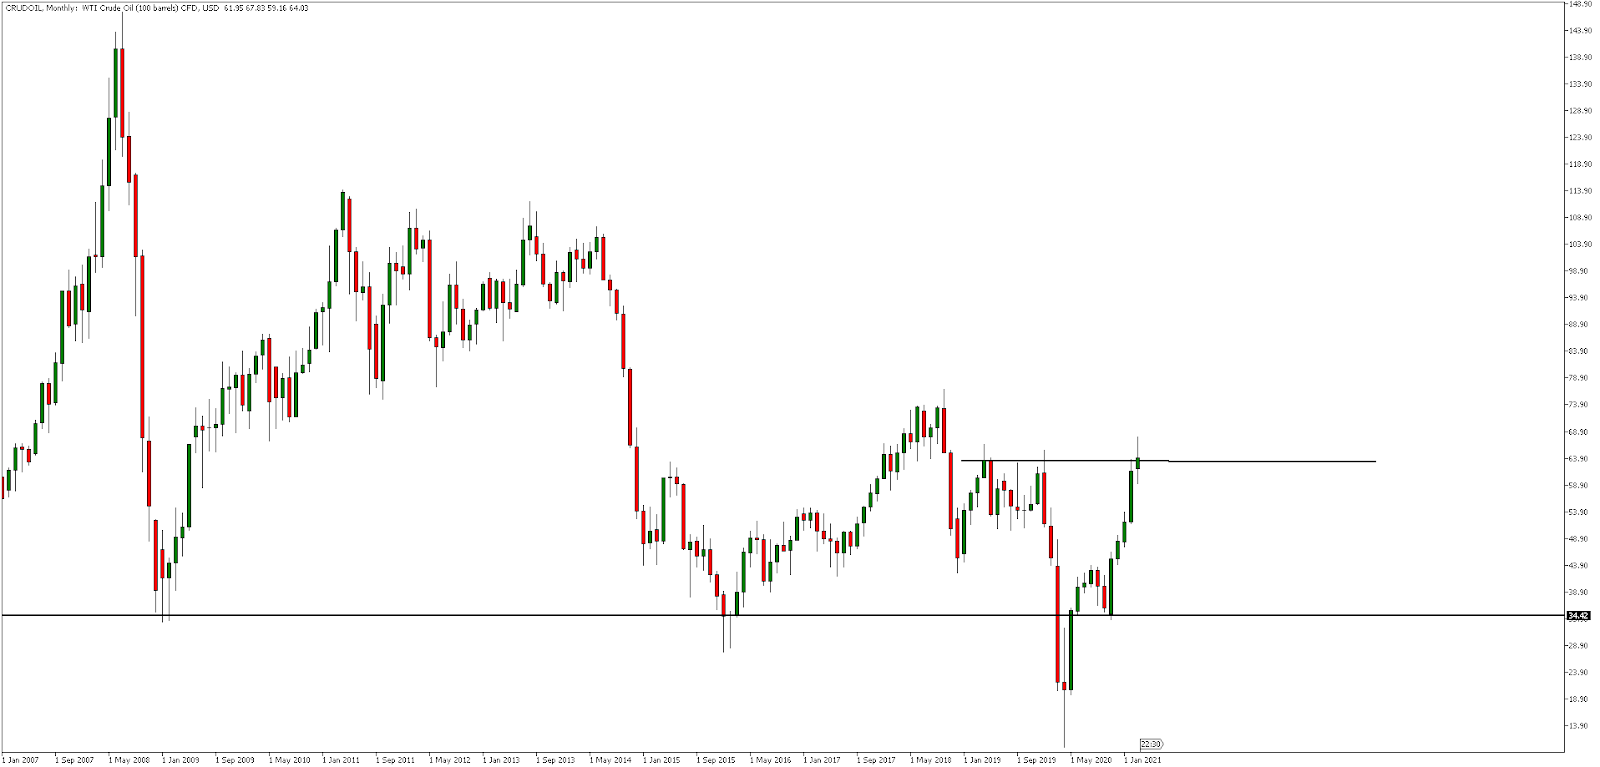
Source: Admiral Markets MetaTrader 5, CRUDOIL, Monthly – Data range: from Jan 1, 2007, to Mar 9, 2021, performed on Mar 9, 2021, at 8:30 pm GMT. Please note: Past performance is not a reliable indicator of future results.
In the long-term, monthly price chart above it is clear to see the recent surge higher. However, from a technical perspective, the price now sits at historical horizontal resistance at ~$64.00. Sellers have turned up at this level in both 2019 and 2020.
We are now back at this level in 2021 and some traders may well be looking to enter short positions yet again. However, the context is very different now then it was in the past. Analysing price action for clues on whether sellers are likely to turn up again will be key.
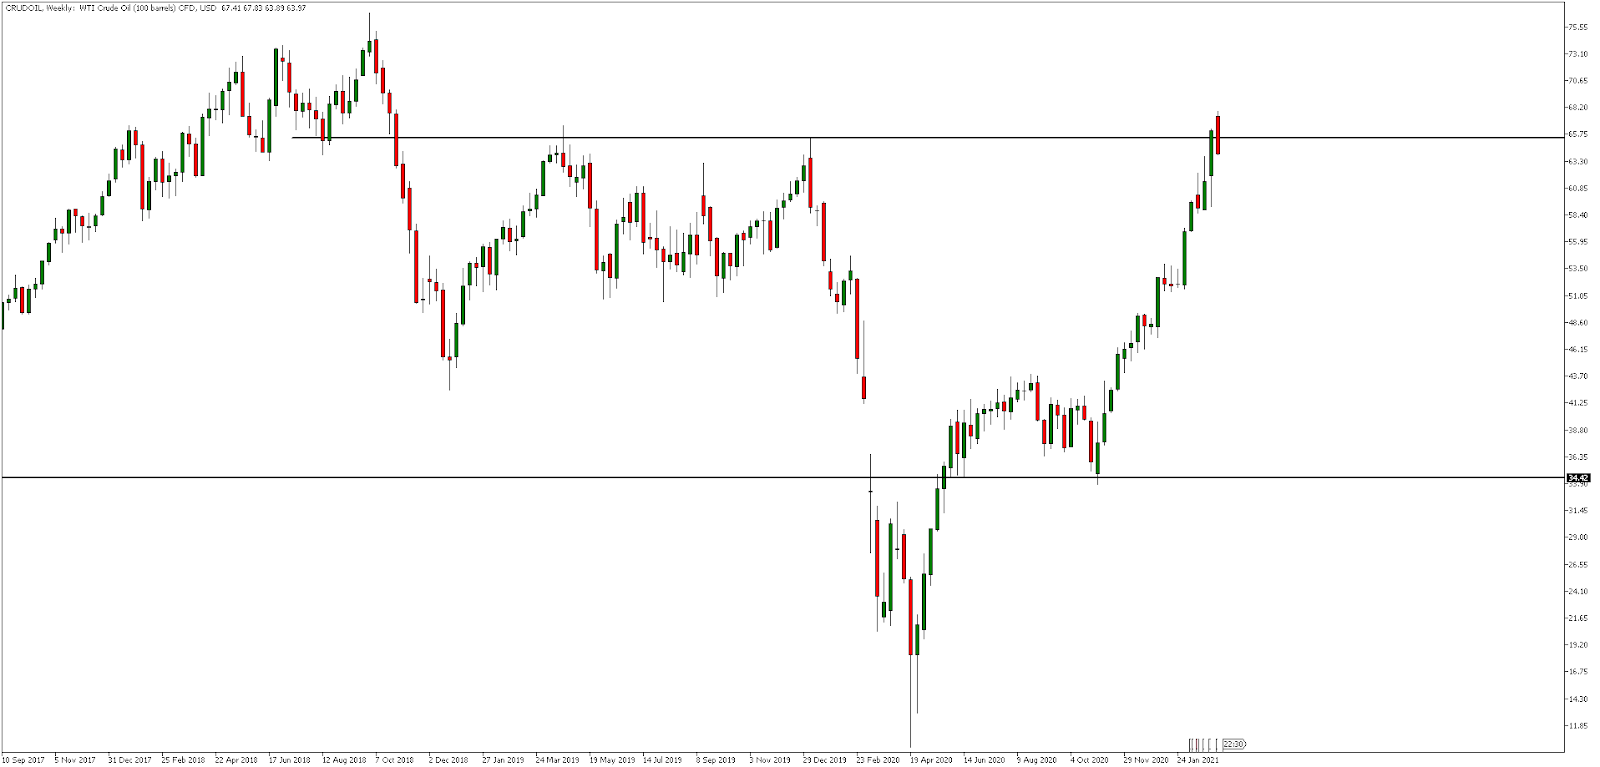
Source: Admiral Markets MetaTrader 5, CRUDOIL, Weekly – Data range: from Sep 10, 2017, to Mar 9, 2021, performed on Mar 9, 2021, at 8:35 pm GMT. Please note: Past performance is not a reliable indicator of future results.
In the weekly price chart of WTI crude oil above, the horizontal resistance line is clear to see. While there are not many analysts with bearish views on oil prices, market positioning may become an issue as the market is heavily long.
Any small news announcement could, therefore, have a much larger impact. Traders may look for technical confirmations of sellers stepping at this horizontal resistance line by identifying double top patterns, indicator divergence, bearish engulfing bars and many other common reversal patterns.
Did you know that you can use the Trading Central Technical Ideas Lookup indicator to find actionable trading ideas on thousands of other instruments across Forex, stocks, indices, commodities and more?
You can get this indicator completely FREE by upgrading your MetaTrader 5 trading platform provided by Admiral Markets UK Ltd to the exclusive Admiral Markets Supreme Edition! You’ll also receive a whole range of advanced trading tools such as correlation and sentiment indicators!
Start your free download by clicking on the banner below:
INFORMATION ABOUT ANALYTICAL MATERIALS:
The given data provides additional information regarding all analysis, estimates, prognosis, forecasts, market reviews, weekly outlooks or other similar assessments or information (hereinafter “Analysis”) published on the websites of Admiral Markets investment firms operating under the Admiral Markets trademark (hereinafter “Admiral Markets”) Before making any investment decisions please pay close attention to the following:
This is a marketing communication. The content is published for informative purposes only and is in no way to be construed as investment advice or recommendation. It has not been prepared in accordance with legal requirements designed to promote the independence of investment research, and that it is not subject to any prohibition on dealing ahead of the dissemination of investment research.
Any investment decision is made by each client alone whereas Admiral Markets shall not be responsible for any loss or damage arising from any such decision, whether or not based on the content.
With view to protecting the interests of our clients and the objectivity of the Analysis, Admiral Markets has established relevant internal procedures for prevention and management of conflicts of interest.
The Analysis is prepared by an independent analyst, Jitan Solanki (analyst), (hereinafter “Author”) based on their personal estimations.
Whilst every reasonable effort is taken to ensure that all sources of the content are reliable and that all information is presented, as much as possible, in an understandable, timely, precise and complete manner, Admiral Markets does not guarantee the accuracy or completeness of any information contained within the Analysis.
Any kind of past or modeled performance of financial instruments indicated within the content should not be construed as an express or implied promise, guarantee or implication by Admiral Markets for any future performance. The value of the financial instrument may both increase and decrease and the preservation of the asset value is not guaranteed.
Leveraged products (including contracts for difference) are speculative in nature and may result in losses or profit. Before you start trading, please ensure that you fully understand the risks involved.
Oat futures’ recent surge to 7-year highs wasn’t caused by the oat milk craze; think “market psychology” instead
By Elliott Wave International
Generally speaking, the idea of oats is about as exciting as, well, a bowl of steel cut oatmeal.
But this chart of oat futures shows why this ordinarily ordinary grain has stolen the commodity spotlight. For starters, February 2021 saw oat prices soar to their highest level in 7 years.
As for what’s behind this newfound dev-oat-tion — mainstream experts like these below cite the craze for alternative milk products and oat milk specifically.
“Oat Milk is Everywhere…. In fact, oat milk is the second most popular plant milk now, right behind almond milk, racking up over $249 million in sales last year.” (Feb. 9 Today.com)
For some perspective, fever for the world’s most popular oat milk producer Oatly is so hot it was featured in this year’s Super Bowl ad lineup in a still talked about spot featuring the company’s CEO, sitting in a field of oats behind a single keyboard awkwardly singing “Wow No Cow!” over and over for 30 seconds! The spot became the butt of jokes across the globe and was dubbed the “Worst Superbowl Ad Ever” by Australia’s news.com.au:
Speaking of Wow Holy Cow! Oatly also announced in February its plans to go public in the U.S. Thanks to investments in the company by famous celebrities like Oprah Winfrey, Natalie Portman and Jay-Z, its IPO is estimated to be worth between $5 and $10 billion.
Ergo, the oat-milk craze caused the late 2020 rally in oat futures to 7-year highs — right?
Not exactly. We believe this line of thinking is a bit — well — lact-oat intolerant of the facts. See, the oat bloat trend is not a new phenomenon. For those following these trends for more than a hot minute, there was the summer of 2018, when a shortage on oat milk prompted news sites across the country to riff satirical about how hip cities like Brooklyn, NY would survive the alt-dairy deficit. See this August 15, 2018 Guardian headline, for example:
In January 2019, the Guardian coined the term “white gold” for oats amidst the mania for alternative milk products
In September 2020, oat milk was crowned #2 plant-based dairy alternative in the world.
In February 2020, many experts warned that the ever-expanding “oat bubble was about to burst” (Feb. 28, 2020 Bloomberg)
And, in June-July 2020, the star-studded line to board the Oatly bandwagon began to form with the likes of Oprah Winfrey and Blackstone Group.
Yet — as you can see on the chart of oat futures below, the consistent craze for oat products during this period did not materialize as soaring prices, but rather as a down-up-down holding pattern that didn’t end until late August 2020.
In late August, the soaring commercial demand for oat products didn’t change; however, the slacking trend in oat prices did — from down to way UP! The question is, was there a way to anticipate the latter?
Yes. In our September 11, 2020 Daily Commodity Junctures, we presented the oat chart below, which identified the August low as the end of a three-wave correction and start of a strong advance:
From there, oat prices soared into the $3/bushel level. In the December 4 Daily Commodity Junctures, we revisited the grain to address its upside potential. Our chart extended its up arrow into the $3.75 levels of 2014, seen here:
And from there, oat futures rallied to the upside target projected by Daily Commodity Junctures some two months earlier.
At the end of the day, there will always be a perfect reason in the news to explain market action — after the fact. For traders and investor, however, the goal is to arrive at those turns in advance.
Here, our Commodity Junctures Service keeps you in front of high-confident setups in the world’s leading markets in grain, livestock, meat, softs, and more. See below to read the latest forecasts now.
Commodity Opportunities Abound: We’ll Drink to That
Whether you like oat milk or not, everyone likes the taste of anticipating market turns — before they become front page news!
FREE REPORT: Want to discover more about Elliott waves?
You’re in luck: For a limited time, we are offering “Learn How the Wave Principle Can Improve Your Trading” free (a $39 value).
This article was syndicated by Elliott Wave International and was originally published under the headline Oat Prices AND the Truth Behind the “White Gold” Rush. EWI is the world’s largest market forecasting firm. Its staff of full-time analysts led by Chartered Market Technician Robert Prechter provides 24-hour-a-day market analysis to institutional and private investors around the world.

 Article by ForexTime