Higher US GDP data and a decreasing number of jobless claims supported the stock market and the dollar

by JustForex

On Thursday, the US Bureau of National Statistics reported higher-than-expected US GDP data. The economy grew at a faster pace in the fourth quarter, reaching 4.3% which is 0.2% higher than it was forecasted.

Apart from that, expectations for an early economic recovery have increased as the labor market continues to show signs of accelerating growth. US jobless claims have dropped to their lowest level in a year as more Americans get vaccinated and the restrictions on doing business in many states are easing. That figure decreased by 97,000 to 684,000 for the past week. The average four-week figure fell to 736,000 from 749,000 earlier.

Initial jobless claims data suggest that job cuts are slowing as businesses are reopening. It was the first week that the number of claims fell below 700,000 since the start of the pandemic. At the same time, there is still a long way to go before the labor market recovers as weekly figures are above their highs since the last 2009 recession.

Against this backdrop, US stocks rose, followed by the Asian stock market. The index of regional shares added more than 1%, primarily due to the shares of China and Japan. US and European futures continue to grow, with the small-cap corporate securities being ahead, boosted by President Joe Biden’s promise to double the vaccination rate. The US dollar also continues to rise on the back of positive data and has already renewed its highs on March 9.

Oil prices fell but rose again in the Asian session. American WTI is close to $60 p/b. The turning operations of the long containership Ever Given blocking the Suez Canal will be undertaken at least until next Wednesday, raising the likelihood of more serious disruptions in the supply of black gold.

Main market quotes:

S&P 500 (F) 3.919.88 +19.38 (+0.50%)

Dow Jones 32.619.48 +199.42 (+0.62%)

DAX 14.621.36 +10.97 (+0.08%)

FTSE 100 6.674.83 -38.06 (-0.57%)

USD Index 92.770 -0.056 (-0.06%)

Important events:
  • – UK Retail Sales (m/m) (Feb) at 09:00 (GMT+2);
  • – IFO Germany Business Climate Index (Mar) at 11:00 (GMT+2);
  • – University of Michigan US Consumer Sentiment (Mar) at 16:00 (GMT+2).

by JustForex


This article reflects a personal opinion and should not be interpreted as an investment advice, and/or offer, and/or a persistent request for carrying out financial transactions, and/or a guarantee, and/or a forecast of future events.

Markets set to end week on positive note

By Han Tan Market Analyst, ForexTime

Asian stocks are in the green, while US and European equity futures are pushing higher. The dollar index is easing slightly, allowing some reprieve for gold and oil prices.

Although Thursday’s 7-year Treasury auction was met with a dull response again, yields are still some 10 basis points below last week’s peak. Moderating Treasury yields for the week has contributed to the relative calm in equity markets, with the VIX index now back in line with its long-term average around 20.

Steps to normality

Market risk sentiment was buoyed by the lower-than-expected US weekly initial jobs claims, while continuing claims dropped below the 4 million mark for the first time since the pandemic broke out. US stocks also reacted positively Thursday to President Biden’s upward revision to his ambitious vaccination target, which now aims to administer 200 million doses by the end of April.

Markets have shown that investors’ optimism is predicated on the vaccine’s rollout reaching more of the population, forming the basis for the expected economic recovery.

The rotation into cyclically-sensitive counters are testament to such hopes, while the euro’s declines against its major peers are testament to persisting concerns over the snags in the EU’s vaccination efforts.

Financial stocks are set to see another boost when US markets open today, having been the best-performing sector on the S&P 500 on Thursday, after the Fed announced plans to ease up on the pandemic-induced restrictions over US banks’ dividend raises and share buybacks. This presents yet another sign that the worst of the pandemic is behind us, as the financial sector takes another significant stride back towards the world we once knew.

Barring any negative surprises, the Dow Jones index is set to erase its mid-week declines and avoid posting back-to-back weekly declines for the first time this year.

US personal income and spending prints to influence risk appetite

Investors will be monitoring the February US personal income and spending data due to be released later today. Noting that this print is sandwiched between late December’s $600 stimulus checks and the $1400 payments just approved this month, both personal income and spending levels for February are expected to register declines.

A better-than-expected reading may help ensure that US equities go into the weekend on a positive note.

Market participants must stay on their toes

Still, a fresh major catalyst is needed in order for risk assets to roar higher.

In the interim, market participants will just have to continue contending with major cross-currents affecting risk appetite. From signs that Covid-19 cases are making a resurgence globally, to simmering US-China tensions, amid the shifting expectations for the Fed’s policy outlook, the relative calm in markets could yet be upended by the realization of such risks.


Disclaimer: The content in this article comprises personal opinions and should not be construed as containing personal and/or other investment advice and/or an offer of and/or solicitation for any transactions in financial instruments and/or a guarantee and/or prediction of future performance. ForexTime (FXTM), its affiliates, agents, directors, officers or employees do not guarantee the accuracy, validity, timeliness or completeness, of any information or data made available and assume no liability as to any loss arising from any investment based on the same.


Forex-Time-LogoArticle by ForexTime

ForexTime Ltd (FXTM) is an award winning international online forex broker regulated by CySEC 185/12 www.forextime.com

Market woes compounded by quarter end?

By Lukman Otunuga Research Analyst, ForexTime

US stocks have opened modestly in the red today, while European bourses have been faring worse this morning reflecting the divergent views for the region’s economies based on their progress in the vaccine rollout. The market is also having to consider vaccine diplomacy that is currently pervading the rising number of infections in Europe. The EU’s threat to curb vaccine exports may not be followed through this time around but it definitely remains a drag on euro sentiment.

Dollar technical level in focus

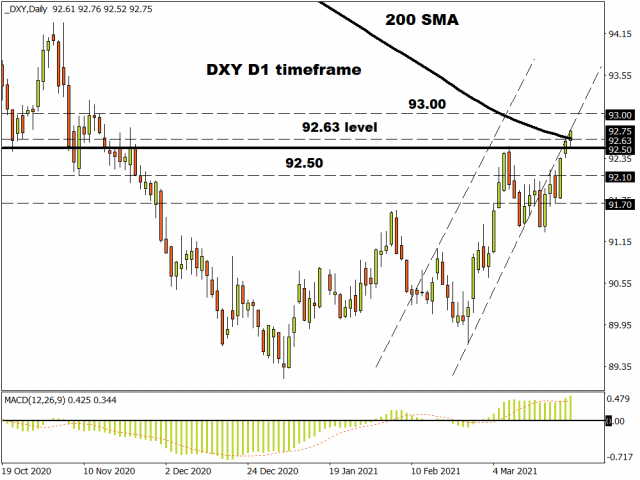
This environment is helping the dollar for sure, as the greenback makes its way past the widely watched 200-day moving average (92.63) on the DXY. With US yields supportive of dollar sentiment so far this year, any fall back in those yields is likely needed to curb the USD’s attractiveness. The final estimate of Q4 GDP ticked up two tenths to 4.3% while the weekly jobs numbers from across the pond were also positive, although we saw a similar decline in the initial jobless claims four weeks ago.

If the bulls can hold above the 200-day moving average, then they will take aim at 93.00 as the next level above which could then see momentum indicators become a little stretched.

Equity and fixed income rebalancing

It’s quarter-end soon (where did those few months go!?) which means many pension funds have to rebalance their portfolios due to the massive selloff in bonds over the past quarter. Essentially, fund managers have to top up their holdings of fixed income which means selling down part of their equity holdings. This is also magnified by the solid performance of stocks over the last few months. Estimates as to the quantities to be bought range between $80 billion to over $140 billion and the peak of rebalancing is generally around the 25th of the month ie today!

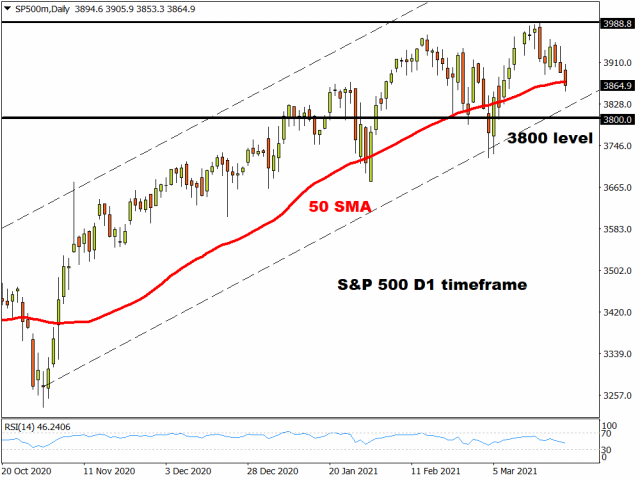
However impactful this is, we see that the S&P 500 is sitting on its 50-day moving average which has acted as decent support over the last several months.

Bearish momentum has picked up recently so if that moving average fails to work its magic again, the 3,800 marker beckons.

Disclaimer: The content in this article comprises personal opinions and should not be construed as containing personal and/or other investment advice and/or an offer of and/or solicitation for any transactions in financial instruments and/or a guarantee and/or prediction of future performance. ForexTime (FXTM), its affiliates, agents, directors, officers or employees do not guarantee the accuracy, validity, timeliness or completeness, of any information or data made available and assume no liability as to any loss arising from any investment based on the same.


Forex-Time-LogoArticle by ForexTime

ForexTime Ltd (FXTM) is an award winning international online forex broker regulated by CySEC 185/12 www.forextime.com

Will WTI Crude Oil drop 30% from long-term resistance?

By Admiral Markets

Since the lows of the pandemic in March 2020, the price of West Texas Intermediate (WTI) crude oil – an international benchmark – has risen more than 500%.

However, the price of WTI crude oil is now trading at historical resistance where buyers have struggled to break through before. This opens the doorway for short sellers to take control of the market.

In the long-term price chart of WTI crude oil below, it’s clear to see the descending trend line which has formed from the highs of 2008, 2013, 2014 and 2018.

Source: Admirals MetaTrader 5, CRUDOIL, Monthly – Data range: from Jan 1, 2007, to Mar 25, 2021, performed on Mar 25, 2021, at 8:30 pm GMT. Please note: Past performance is not a reliable indicator of future results. 


With concerns surrounding the lack of supply of coronavirus vaccines around the world and some countries – most notably in Europe – moving into a third lockdown, risk assets like oil have already taken a hit.

Traders may wait for bearish price action to form at the end of the month to confirm the struggle from buyers to break through this historical level of resistance and then move down to the lower timeframes for possible entries.

The weekly chart below also shows another historical resistance level that is in focus. The black horizontal resistance line, shown in the chart above, converges with the long-term descending trend line from the monthly chart shown previously.

Source: Admirals MetaTrader 5, CRUDOIL, Weekly – Data range: from Jun 11, 2017, to Mar 25, 2021, performed on Mar 25, 2021, at 8:30 pm GMT. Please note: Past performance is not a reliable indicator of future results. 


Sellers have already managed to step into the market and drive price lower. If the market moves to the next level of support around the ~$45.70 price level, this would record a 30% drop from the highs of the year so far.

Did you know that you can use the Trading Central Technical Ideas Lookup indicator to find actionable trading ideas on thousands of other instruments across Forex, stocks, indices, commodities and more?

You can get this indicator completely FREE by upgrading your MetaTrader 5 trading platform provided by Admirals (formerly Admiral Markets) to the exclusive Supreme Edition! You’ll also receive a whole range of advanced trading tools such as correlation and sentiment indicators!

Start your free download by clicking on the banner below:

Download MetaTrader 5 Supreme Edition

INFORMATION ABOUT ANALYTICAL MATERIALS:

The given data provides additional information regarding all analysis, estimates, prognosis, forecasts, market reviews, weekly outlooks or other similar assessments or information (hereinafter “Analysis”) published on the websites of Admiral Markets investment firms operating under the Admiral Markets trademark (hereinafter “Admiral Markets”) Before making any investment decisions please pay close attention to the following:

  1. This is a marketing communication. The content is published for informative purposes only and is in no way to be construed as investment advice or recommendation. It has not been prepared in accordance with legal requirements designed to promote the independence of investment research, and that it is not subject to any prohibition on dealing ahead of the dissemination of investment research.
  2. Any investment decision is made by each client alone whereas Admiral Markets shall not be responsible for any loss or damage arising from any such decision, whether or not based on the content.
  3. With view to protecting the interests of our clients and the objectivity of the Analysis, Admiral Markets has established relevant internal procedures for prevention and management of conflicts of interest.
  4. The Analysis is prepared by an independent analyst, Jitan Solanki (analyst), (hereinafter “Author”) based on their personal estimations.
  5. Whilst every reasonable effort is taken to ensure that all sources of the content are reliable and that all information is presented, as much as possible, in an understandable, timely, precise and complete manner, Admiral Markets does not guarantee the accuracy or completeness of any information contained within the Analysis.
  6. Any kind of past or modeled performance of financial instruments indicated within the content should not be construed as an express or implied promise, guarantee or implication by Admiral Markets for any future performance. The value of the financial instrument may both increase and decrease and the preservation of the asset value is not guaranteed.
  7. Leveraged products (including contracts for difference) are speculative in nature and may result in losses or profit. Before you start trading, please ensure that you fully understand the risks involved.

By Admiral Markets

Goldman Sachs: banks benefit from trainees who think they must be superhuman to measure up

By Bogdan Costea, Lancaster University and Peter Watt, Lancaster University 

– The working conditions at leading investment bank Goldman Sachs are “inhumane” and “abusive”, according to a group of junior bankers who work there. In an unofficial survey circulating on social media, they complained of 95-hour average working weeks and getting only five hours of sleep a night, starting at 3am.

This wasn’t entirely news. Such conditions are not uncommon in financial services and have been for a long time, as explored so intelligently by the recent BBC series Industry.

Neither are the Goldman junior bankers demanding a radical change. They make clear in the survey that they knew they weren’t getting into a nine-to-five job. Their main demands are maximum 80-hour weeks and no work between 9pm on Friday nights and Sunday mornings.

One case we previously looked at was the notorious story of Moritz Erhardt, a summer intern at Bank of America Merrill Lynch, who died in August 2013 after attempting to work non-stop for three days and nights. The 21-year-old had been desperately trying to ensure a “return offer” – a job offer after finishing his university studies.

We analysed Moritz’s case at the time. What struck us, among other things, was that his father, a psychoanalyst, emphasised that the bank was not exploiting his son. He believed that Moritz did it to himself:

He wasn’t just interested in the money. He wanted to do good in the world. I’ve been sorting through some of his things and I found a quote from Marilyn Monroe he’d made a note of which went, ‘I don’t want to make money, I just want to be wonderful’.

It raises a question that we had been trying to answer even before Moritz’s tragic death. Why are people in finance willing to work to such levels of intensity on a continuous basis?

The obvious answer would be the financial rewards, but it might not be as simple. Moritz’s father explained that “part of what Moritz loved about the work was the intensity and the esprit de corps that developed during those long days and nights in the office”.

To make sense of this, we have to look at the cultural context.

Employability above all

When the leading philologist George Steiner gave an extensive autobiographical interview in 2007, he said:

The young in Europe have never been as hopeless … [They have] no sense of an ideology, no sense of any political or utopian future … Nobody is going to die for a hedge fund, nobody is going to die for the enormous entertainment industries, for the mass media, for athletic worship – which is all the young have.

Professor Steiner was a refined observer of society and culture, but did not somehow see that hedge funds, entertainment industries, mass media and sport have become prime sources of a new ideology of personal success and advancement. They mobilise, sometimes totally, the interests, energies and commitment of large numbers of people around the world.

It is a world in which money, success, status and celebrity are now central ingredients of culture. They dictate what is of value, and popular culture seems to reinforce them constantly.

Having observed intake after intake of university students, they nowadays view their education as an “investment” in terms of how employable it will make them. Their primary preoccupation is with the status of the job they will get after graduation. Financial services are among the most sought-after. As a result, financial institutions can create intense, almost desperate bonds of commitment from the people they hire.

Super me

The last two decades have witnessed the exponential growth of a new language about employment in major corporations. Replete with the superlative human qualities that these employers expect of candidates, the vocabulary of employability has been fused with the jargon of the “self”.

As one recent advert put it by quoting a successful graduate from its management scheme, “I’m still me, but the most confident, all-conquering version of me.” This was the supermarket chain Aldi, but it neatly sums up the mindset in financial services.

Something very powerful happens through this kind of vocabulary. It provides clues for understanding why employability has gained such overarching importance too: corporations have become almost like temples, and in an era obsessed with the self, we believe that we must become somehow superhuman to meet their standards – it’s a vicious circle in which the self and perceptions of top corporations reinforce one another.

Working for such employers is not the only thing that validates people’s sense of self here. The accounting consultancy PricewaterhouseCoopers (PwC) advertised its graduate scheme some years ago with the following message: “Being the one who never stands still.” This is not to suggest that PwC shares a work culture with Goldman, but it encapsulates the other side of the coin to the complaints of the junior bankers: working for such organisations promises personal growth, development, learning, achievement, creativity and so on.

These now define the horizon of expectations for such jobs. But when workers reach breaking point, be it in the financial sector or elsewhere, we must recognise this as the moment when superlative expectations run into reality. None of this superlative human “potential” is endless.

When performing at work is presented as a kind of absolute and inescapable test of the “self”, we need to grasp the broader cultural dynamic in which many young people need to be valued in this way. We are all “creative talents” now – we keep telling ourselves this constantly and demand recognition for it too.

This is why the revelations at Goldman Sachs do not feel surprising or exceptional. It means that calls for intervention and regulation to improve conditions might be futile. We need to have an urgent debate about the values that we have instilled in young people, and the ways in which they are judged by would-be employers.

A Goldman spokesperson said:

We recognise that our people are very busy, because business is strong and volumes are at historic levels … A year into COVID, people are understandably quite stretched, and that’s why we are listening to their concerns and taking multiple steps to address them.The Conversation

About the Author:

Bogdan Costea, Professor of Management and Society, Lancaster University and Peter Watt, International Lecturer in Management and Organisation Studies, Lancaster University

This article is republished from The Conversation under a Creative Commons license. Read the original article.


 

Have Commodities Peaked? We Doubt It

By TheTechnicalTraders 

– While everyone was paying attention to the FOMC, Gold & Silver, and the Treasury Yields, it appears the recent commodity rally trend took a big hit on Thursday, March 18, 2021.  Our guess is that the FOMC statement did nothing to support the continued commodity price rally as the US Fed continued with near-zero interest rates and economic support through 2023.  The rally in commodities was likely based on expectations of a much stronger economic recovery as the COVID vaccines take the pressure off economic shutdowns and further restrictive economic conditions, but that may not be the case.

Commodities Rollover May Be Misleading Traders

The rollover in commodities suggests the markets are reacting to renewed expectations, post-FOMC.  They may continue to consolidate near support (near $16.30) before attempting to move higher as traders digest the Fed comments and fall back into economic recovery expectations.  Any move below $16.00 as seen on the chart below may likely prompt a consolidation phase within historical support channels (see the Weekly DBC chart below).

Commodities Attempting to Base Near Support

The following weekly DBC chart shows how the COVID-19 event collapsed commodity prices and how they’ve just recently rallied back to levels above the pre-COVID price range – above $15.00. When we start to look at longer-term trends, we start to see a number of key price levels that become important technical factors related to future trends.  The support levels that setup in 2019, pre-COVID, are still very valid current support levels for commodities.  If a continued economic recovery takes place, DBC will likely find support above $15 and then begin another rally phase targeting prices above $19 to $20.  This current rollover in commodity prices may be nothing more than a pause in price before another rally starts.

Commodities Break Major Monthly Price Channel

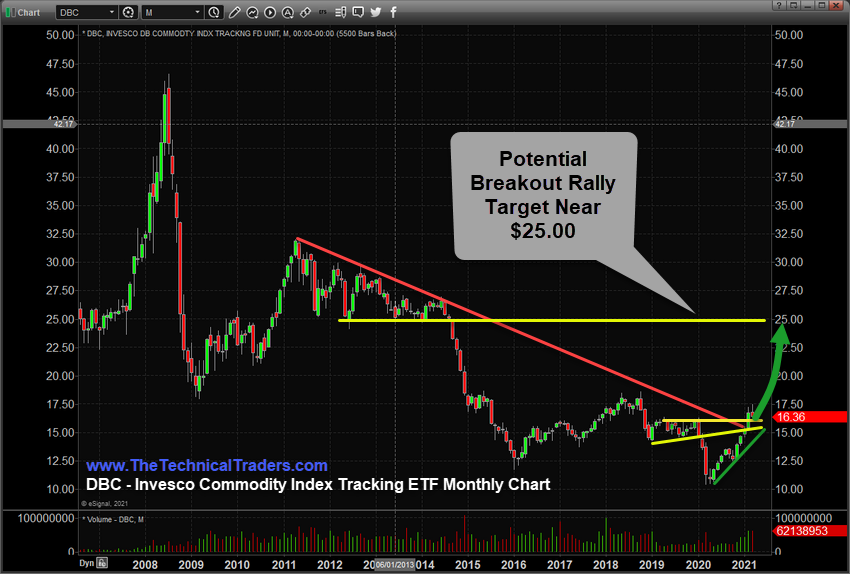
Lastly, looking at the Monthly DBC chart, below, highlights the very long-term price trends and what becomes immediately evident is that price has recently broken above the RED downward sloping price channel line. The momentum of the price rally that recently broke this downward price channel was strong enough to pierce this downward sloping channel – and it would not be uncommon for price to pause after this price breach.  The YELLOW support levels, from the weekly DBC chart, continue to confirm the $15 to $16 as active support.  Any price rotation or pause near this level will likely hold within this support range before attempting another move higher.

Be sure to sign up for our free market trend analysis and signals now so you don’t miss our next special report!

We targeted price lows from 2012~2014 as a potential upside price target if the rally phase continues.  After breaking the major downward sloping price trend, it is very likely that once DBC prices rally above $18.50, a continued rally phase may target the $25 price level with an extended run over many months.


Historically, a rally in commodities does not always prompt a rally in the US major indexes.  In 2007~08, commodities rallied extensively while the US stock market collapsed.  In 2010~11, commodities rallied as the US stock market rallied more than 27%.  In 2016~2018, commodities rallied as the US stock market rallied more than 62%.  The current breakout above the RED longer-term price channel suggests we may see a stock market rally aligned with a commodity price rally based on the recent comments by the US Fed.  Unless a major credit market or other catastrophic event takes place, we believe this upward trend in commodities may prompt an extended recovery rally in both commodities and the US stock market.

Don’t miss the opportunities to profit from the broad market sector rotations we expect this year, which will be an incredible year for traders of my Best Asset Now (BAN) strategy.  You can sign up now for my FREE webinar that teaches you how to find, enter, and manage positions for maximum profits from only those sectors that have the most strength and momentum. Staying ahead of sector trends is going to be key to success in volatile markets, and this year we see a change in leading sectors taking place from what they were last year.

For those who believe in the power of trading sectors that show relative strength and momentum but don’t have the time to do the research every day, let my BAN Trader Pro newsletter service do all the work for you with educational daily market video, updates, research, and my trade alerts. More frequent or experienced traders have been killing it trading options, ETFs, and stocks using my BAN Hotlist, which ranks the hottest ETFs, which is updated daily for my subscribers.

Happy Trading!

Chris Vermeulen
Founder & Chief Market Strategist

TheTechnicalTraders.com

Turkey’s plunging lira: don’t expect an end to this saga soon

By Emre Tarim, Lancaster University 

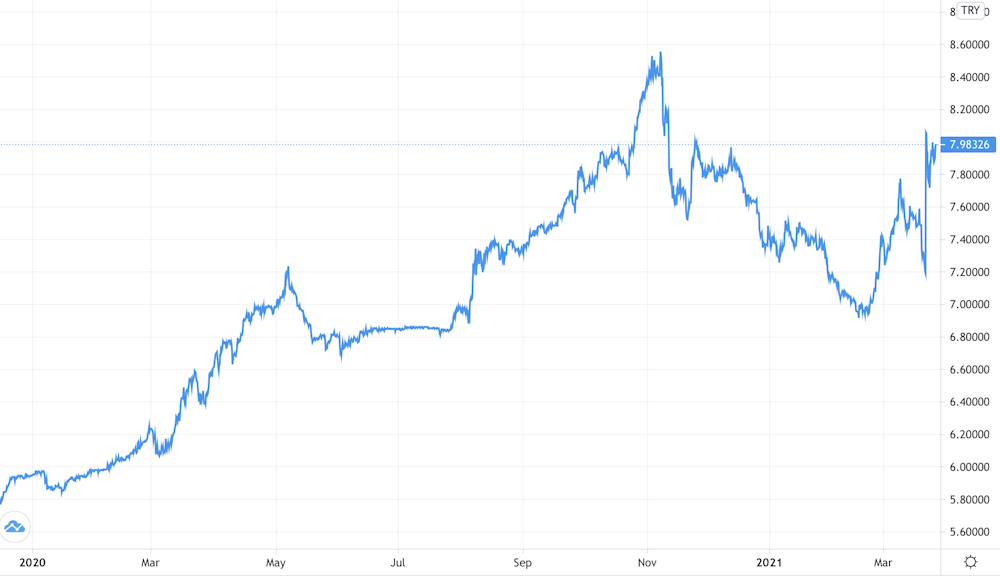
– The Turkish lira has once again made global headlines, with a steep drop of 15% on March 22, running from below 7.20 to the US dollar to over 8.28, before settling just below 8.00. This came on the back of a midnight decree on March 19 by the Turkish president, Recep Tayyip Erdoğan, to sack Naci Ağbal, the governor of the central bank.

This is the third time Erdoğan has sacked a governor since being elected the first executive president of Turkey in June 2018. Such a turnover of governors in the age of independent central banks is unusual.

It helps to understand that the president and his brand of “folk economics” argues that high interest rates cause high inflation. This is contrary to economic orthodoxy, which would say that raising interest rates is the remedy for inflation. Ağbal was dismissed a day after hiking interest rates.

The three governors

The first governor to serve under Erdoğan was Murat Çetinkaya. He was sacked in July 2019 for allegedly refusing to cut interest rates, citing the bank’s independence.

He was replaced by Murat Uysal, who instigated sharp interest rate cuts after coming into office. This brought rates into negative territory once inflation is factored in.

This may have chimed with Erdoğan’s views on economics, but the markets and the economy had other ideas: there followed a cheap credit boom, which stoked inflation and saw the lira weaken to the point that it hit historical lows against the US dollar and euro. In November 2020, Uysal was summarily dismissed.

Turkish lira vs US dollar

Graph of lira vs US dollar
Trading View

When Naci Ağbal replaced Uysal, investors were cautiously optimistic. Ağbal had been the minister of finance and economy in the final cabinet of Turkey’s parliamentary system, before it was replaced by the executive presidency in 2018.

On assuming the central bank governorship, he reversed the low interest rate policies of his predecessor and started raising rates instead. He repeatedly stressed the importance of price stability and low inflation as the central bank’s two legal mandates since 2001.

Not only was Ağbal saying the right things, he seemed to have the president’s endorsement. Only two days after Ağbal had assumed the governorship, Erdoğan’s son-in-law, Berat Albayrak, who had overseen Erdoğanomics for almost three years as minister of finance and economy, infamously resigned via his Instagram account.

Former party insiders claimed that Ağbal had been critical of Albayrak’s policies, including restrictions on having a free-floating currency and the alleged sale of US$128 billion in central bank reserves to prop up the free-falling lira. These had led to significant capital outflows and growing questions about whether Turkey was a viable emerging market for foreign investment.

Meanwhile, Erdoğan has been stressing the importance of price stability and market-friendly economic governance in various speeches during Ağbal’s tenure. It all seemed to suggest that Erdoğan had U-turned on his unusual economic beliefs. Perhaps three years of low interest rates, high inflation and heady boom and bust cycles might finally have been coming to an end.

Investors responded by ploughing an estimated US$15 billion (£11 billion) into the Turkish capital markets since Ağbal’s appointment. Over the period, the lira appreciated more against the US dollar than any other emerging markets currency. But following a final interest rate hike to 19% to tame inflation whose official rate of nearly 16% is allegedly underreported, Ağbal has turned out to be the shortest serving governor under Erdoğan so far.

Where next

This is not an easy time to be taking over the management of Turkey’s economy. As well as the high inflation and high interest rates, Turkish savers seem to have lost faith in the lira as their foreign currency holdings reached record levels in 2020. None of this bodes well for a country with a sizeable private and public debt of some US$440 billion owed to foreign creditors and mostly denominated in US dollars.

The new central bank governor is Şahap Kavcıoğlu. He is a former banker and a current professor of banking and finance. He is a columnist in a pro-government newspaper, which on its front page accused Naci Ağbal of a conspiracy against the Turkish economy a day before he was sacked.

Kavcıoğlu has written columns supporting Erdoğanomics, including its low interest rate low inflation theory. One can therefore easily understand why he has been appointed. We will probably see successive interest rate cuts starting from April when the central bank’s monetary policy committee gathers for its regular monthly meeting.

This will probably be followed by another economic boom fuelled by cheap credit alongside runaway inflation on the way to the second presidential election in 2023. Given the unsoundness of Erdoğanomics for an open economy like Turkey, we will probably also see new record lows for the lira along the way.The Conversation

About the Author:

Emre Tarim, Lecturer in Behavioural Sciences, Lancaster University

This article is republished from The Conversation under a Creative Commons license. Read the original article.

Why companies’ ‘net-zero’ emissions pledges should trigger a healthy dose of skepticism

By Oliver Miltenberger, The University of Melbourne and Matthew D. Potts, University of California, Berkeley 

Hundreds of companies, including major emitters like United Airlines, BP and Shell, have pledged to reduce their impact on climate change and reach net-zero carbon emissions by 2050. These plans sound ambitious, but what does it actually take to reach net-zero and, more importantly, will it be enough to slow climate change?

As environmental policy and economics researchers, we study how companies make these net-zero pledges. Though the pledges make great press releases, net-zero is more complicated and potentially problematic than it may seem.

What is ‘net-zero’ emissions?

The gold standard for reaching net-zero emissions looks like this: A company identifies and reports all emissions it is responsible for creating, it reduces them as much as possible, and then – if it still has emissions it cannot reduce – it invests in projects that either prevent emissions elsewhere or pull carbon out of the air to reach a “net-zero” balance on paper.

The process is complex and still largely unregulated and ill-defined. As a result, companies have a lot of discretion over how they report their emissions. For example, a multinational mining company might count emissions from extracting and processing ore but not the emissions produced by transporting it.

Companies also have discretion over how much they rely on what are known as offsets – the projects they can fund to reduce emissions. The oil giant Shell, for example, projects that it will both achieve net-zero emissions by 2050 and continue to produce high levels of fossil fuel through that year and beyond. How? It proposes to offset the bulk of its fossil-fuel-related emissions through massive nature-based projects that capture and store carbon, such as forest and ocean restoration. In fact, Shell alone plans to deploy more of these offsets by 2030 than were available globally in 2019.

Environmentalists may welcome Shell’s newfound conservationist agenda, but what if other oil companies, the airline industries, the shipping sectors and the U.S. government all propose a similar solution? Is there enough land and ocean realistically available for offsets, and is simply restoring environments without fundamentally changing the business-as-usual paradigm really a solution to climate change?

Concerns about voluntary carbon markets

Outside of compliance emissions markets, which primarily focus on government regulation in the energy sector, voluntary markets create most of the offsets that are used to reach net-zero.

Voluntary markets are organized and operated by a diverse range of groups where anyone can participate. Have you ever seen the option to offset your flight? That offset probably happens through a voluntary carbon market. The activities that produce the offsets include projects like forestry and ocean management, waste management, agricultural practices, fuel switching and renewable energy. As the name implies, they are voluntary and therefore largely unregulated.

Because of the wave of net-zero pledges and subsequent demand for offsets, voluntary carbon markets are under pressure to expand quickly. A task force launched by United Nations Special Envoy on Climate Action Mark Carney and involving several major companies released a sweeping blueprint at Davos 2021 that predicts voluntary carbon markets need to grow fifteenfold over the next decade. It suggests that the net-zero surge represents one of the largest commercial opportunities of our time – prompting keen interest from investors and big business. It also identifies and proposes solutions to some persistent challenges and critiques of voluntary carbon offset markets.

Some critics of the blueprint argue that it overlooks deeper problems rooted in the overall reliance on and effectiveness of voluntary carbon markets as a solution.

Though there is historical evidence of misuse and plenty of criticism, voluntary carbon markets are not inherently bad or useless in the pursuit of climate targets. In fact, quite the opposite. Some voluntary carbon market projects, in addition to mitigating climate change, provide other benefits, such as improvements to biodiversity habitats, water quality, soil health and socioeconomic opportunities.

However, there are real concerns about the ability of voluntary markets to legitimately deliver what they promise. Common concerns include questions about the permanence of the projects for storing carbon long term, verifying that offsets actually reduce emissions beyond a business-as-usual scenario and confirming that credits are not being used more than once. These and other challenges expose voluntary carbon markets to potential manipulation, greenwashing, unintended consequences and, regrettably, failure to achieve their purpose.

It’s getting better, but over-reliance on this method for counterbalancing emissions does risk some entities’ using offsets as a right to pollute.

Can global ecology meet the demand?

Voluntary carbon markets can improve landscapes and help make up for unavoidable emissions. However, they cannot accommodate all of the developed world’s net-zero targets.

Most of these initiatives have not yet started, yet emitters from developed countries are already seeking offsets outside their borders. This is raising concerns that wealthier companies may be placing the burden of their emissions onto poorer countries that can produce offsets cheaply, begging the notion of a newfound climate colonialism. Local communities may benefit from some environmental improvements or socioeconomic opportunities, but should economically developed polluters be forcing that decision?

Beyond ethics, in statistical terms, there is simply not enough ecological capacity to offset the world’s emissions.

Take the interest in using forests as offset solutions. There are around 3 trillion trees on Earth today with room for about 1 to 2.5 trillion more. The Trillion Tree Initiative, 1T program, Trillion Trees, and the CEO of Reddit, among others, aim to plant a trillion trees each. From just a few examples, there is already a paradoxical impasse.

Offsets can realistically do only so much for reaching climate targets. That is why the focus must turn toward reducing rather than offsetting global emissions. Voluntary carbon markets serve a critical role as innovation sandboxes for creative offset solutions, and they are mobilizing the private sector to act; however, they must be limited.

While some prominent organizations are pursuing net-zero, most businesses and governments have not yet pledged, let alone developed, clear and plausible road maps to meet targets in line with a 2050 net-zero global economy.

The needed goal: A negative net

The Intergovernmental Panel on Climate Change suggests that the world can keep global warming in check if emissions are cut in half by 2030, compared to 2010 levels, and reach net-zero by midcentury. However, it also states a need for greenhouse gas removal beyond net-zero emissions targets.

The real act of climate cleanup begins at net-negative emissions for all greenhouse gases. Only then will their atmospheric concentrations finally begin shrinking. That feat will require more renewable energy, widespread infrastructure and transportation developments, improved land management and investments in carbon capturing activities and technologies.

While net-zero is a critical step toward addressing climate change, it must be achieved smartly. And, importantly, it can’t be the end goal.

About the Author:

Oliver Miltenberger, Ph.D. Candidate in Environmental Economics, The University of Melbourne and Matthew D. Potts, Professor, S.J. Hall Chair in Forest Economics, University of California, Berkeley

This article is republished from The Conversation under a Creative Commons license. Read the original article.


How to Stop Being Scared or Shaken Out Of Winning Trades

By TheTechnicalTraders 

– The markets really frightened a lot of people in the last month. We’ve received lots of emails and comments from people wondering what’s happening in the markets and why the deeper downtrend didn’t prompt new trade triggers.  Well, the quick answer is “this downtrend did prompt new BAN trade  triggers and this pullback is still quite mild compared to historical examples”.  Allow me to explain my thinking.

The recent FOMC meeting as well as the expiration of the future contracts usually prompts some broad market concerns.  Many professional traders refuse to trade over the 7+ days near an FOMC meeting – the volatility levels are usually much higher and this can throw some trading strategies into chaos. Our BAN Trader Pro strategy handles volatility quite well most of the time.

Recently, the BAN Trader Pro strategy initiated new trade triggers of subscribers and myself.  Our members are engaged in the best-performing assets for the potential upside price rally that may take place over the next couple of months.  Our strategies target opportunities based on proven quantitative technology – not emotions and use proven position management to maximize gains while reducing drawdowns.

Transportation Index Daily Chart Is Bullish

This leading index shows early strength in the market with an upside target of $14,668. That is a 3.5%-4.5% upside move ahead of us.

Recently, we’ve seen some substantial support in the Transportation Index that aligns with our BAN Trader Pro strategy.  The rally in the Transportation Index, which usually leads the US economy by at least 2 to 4 months, suggests the markets are actively seeking out a support level/momentum base for another rally phase.

Using a Fibonacci Extension tool, we can clearly see the TRAN has another 3.5% to 4.5% to rally before reaching the 100% measured move target near $14,668.  This level represents a full 100% rally phase equaling the initial rally from levels near $12,000 which started back in February 2021.

Dow Jones Industrial Index Daily Chart is Bullish

The Dow Jones Industrial Average has already reached the 100% Fibonacci Measured move – and broken above that level.  If the markets rally from this recent pullback, we believe a 4% to 5%+ rally in the Dow index is very possible.  This type of bullish price trend suggests a target level near $34,000.

One thing, many traders fail to consider is these 4% to 5% rallies in the Transportation Index and/or the Dow Jones Industrial Average will likely prompt an 8% to 20%+ rally in some of the best-performing assets/sectors.  For example, after the bottom in early February, during a time when the index rallied less than 1%, the best-performing assets we tracked rallied more than 7% to 25%.  The strength of these top-performing sectors/symbols can be very powerful – even while the US major indexes are drifting sideways.


If the Transportation and Dow Index rally 4% or more over the next few weeks, then some of the best performing sectors will strong gains in our favor.  It depends on how strong these top-performing sectors react to the underlying momentum associated with each symbol though.

How to Avoid Emotional Trading Decisions

Trading based on emotions can lead to early, and sometimes foolish, entry and exits of positions.  The market has a way of faking/shaking price which often prompt traders to react to the 2% to 4% swings in the markets as if they are catastrophic. Some of the best advice we can offer active traders other than becoming part of our trading group and pre-market analysis and trade alerts are…

_  Trust your system/strategy and follow it from entry to exit trigger.
_  Define your risks and run the strategy efficiently
_  Develop ways to identify and resolve strategy failure early and often
_  Trading involves risks – learn to execute the strategy within your risk parameters (position sizing)
_  Don’t let emotions control you. Trade rules should protect you during high & low volatility conditions.

If you don’t have a strategy and can’t see yourself sticking to these simple rules, then maybe it is time to find a better strategy or to attempt to develop some of these tactics into your existing strategy. You can follow me to success with my ETF Swing Trading Strategy, or our Options Trading Strategy at any time if you want all the work done for you.

Be sure to sign up for our free market trend analysis and signals now so you don’t miss our next special report!

Far too many people get lucky with a strategy then leverage their trading because they feel they will never fail.  Failure of any strategy, often represented as the largest drawdown amount, should be multiplied by at least 3x when comparing risks.  Just because your strategy showed one period of drawdown representing a -$5,500 loss does not mean that type of price activity is an isolated event.  That type of drawdown could happen repeatedly, over a very short period of time, representing a -$16,500 loss.

The strongest strategy components are those that help to contain losses, manage risks and allow for the protection of capital.  Remember, “living to trade another day” is far more important than huge gains off of one or two trades followed by a string he big losers that blow up your account.

In closing, get ready for a recovery in stock prices. With the indexes poised to move higher by another 3.5% – 5% before reaching the next 100% measured move suggests some sectors will post spectacular gains. Don’t let emotions dictate your decisions – run your strategy (or find a better strategy to trade with).  The best performing sectors/symbols usually continue to outperform the US major indexes when trending higher.

Don’t miss the opportunities in the broad market sectors over the next 6+ months.  2021 and beyond are going to be incredible years for traders and investors.  Staying ahead of these sector trends is going to be key to developing continued success.  As some sectors fail, others will begin to trend higher.  Learn how BAN Trader Pro can help you spot the best trade setups and deliver alerts to your phone and inbox.

We’ve built this technology to help us identify the strongest and best trade setups in any market sector.  Every day, we deliver these setups to our subscribers along with the BAN Trader Pro system trades.  You owe it to yourself to see how simple it is to trade 30% to 40% of the time to generate incredible results.

Chris Vermeulen
Chief Market Strategist
TheTechnicalTraders.com

NOTICE: Our free research does not constitute a trade recommendation or solicitation for our readers to take any action regarding this research.  It is provided for educational purposes only.  Our research team produces these research articles to share information with our followers/readers in an effort to try to keep you well informed.  Visit our website (www.thetechnicaltraders.com) to learn how to take advantage of our members-only research and trading signals.


Murrey Math Lines 25.03.2021 (USDCHF, GOLD)

Article By RoboForex.com

USDCHF, “US Dollar vs Swiss Franc”

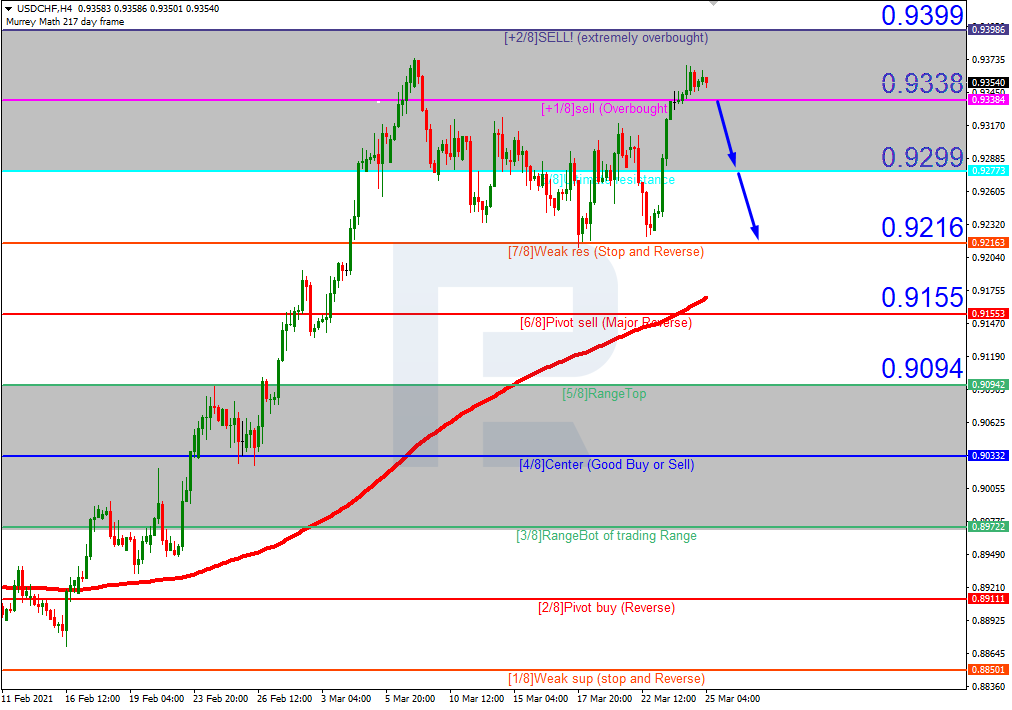
As we can see in the H4 chart, USDCHF is trading within the “overbought area”. In this case, the price is expected to break +1/8 and then continue falling towards the support at 7/8. Still, this scenario may no longer be valid if the price breaks the resistance at +2/8 to the upside. After that, the lines in the chart will be redrawn, thus helping us to define new targets.

USDCHF_H4
Risk Warning: the result of previous trading operations do not guarantee the same results in the future

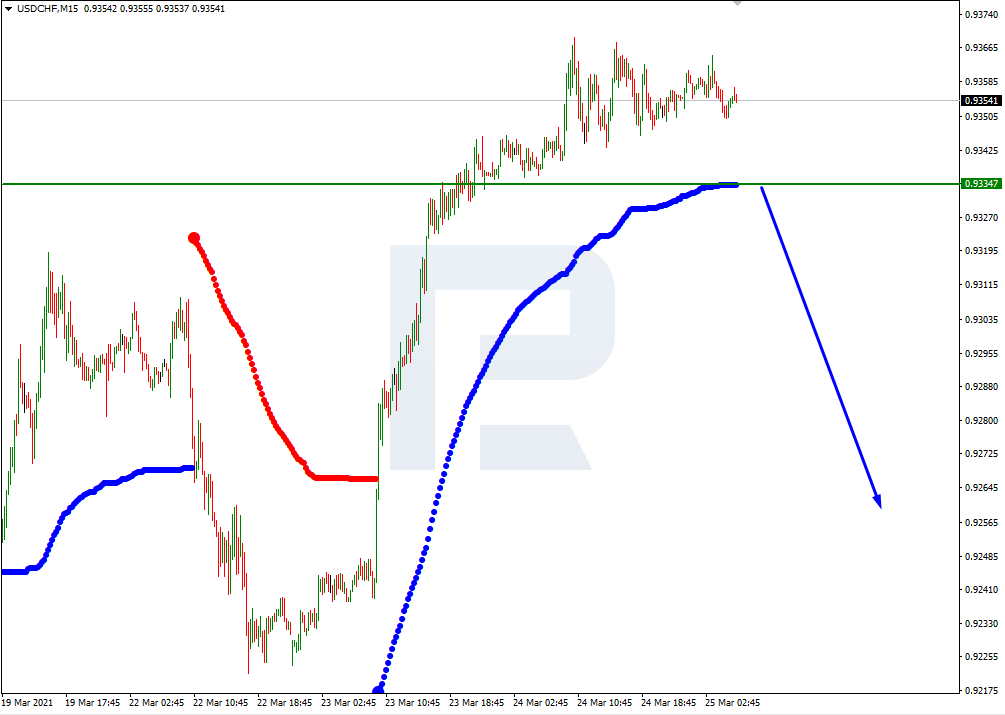
In the M15 chart, the pair may break the downside line of the VoltyChannel indicator and, as a result, continue the descending tendency.

USDCHF_M15
Risk Warning: the result of previous trading operations do not guarantee the same results in the future

XAUUSD, “Gold vs US Dollar”

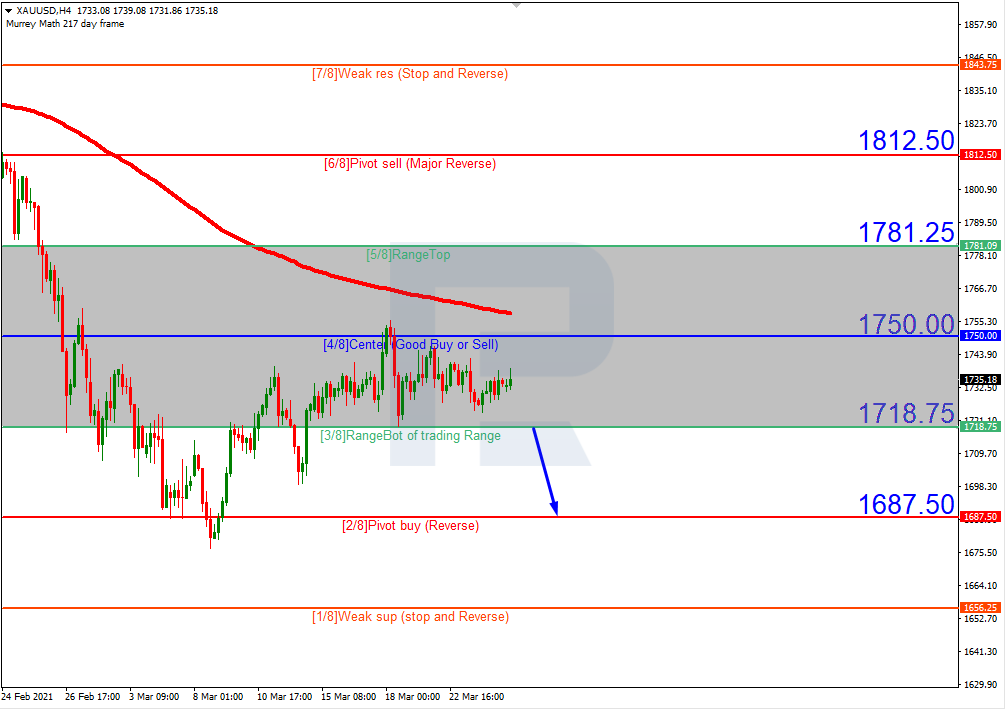
As we can see in the H4 chart, after failing to break the resistance at 4/8, XAUUSD is expected to break 3/8 and continue falling to reach the support at 5/8. However, this scenario may no longer be valid if the price breaks the resistance at 4/8 to the upside. After that, the instrument may continue growing towards 5/8.

USDCAD_H4
Risk Warning: the result of previous trading operations do not guarantee the same results in the future

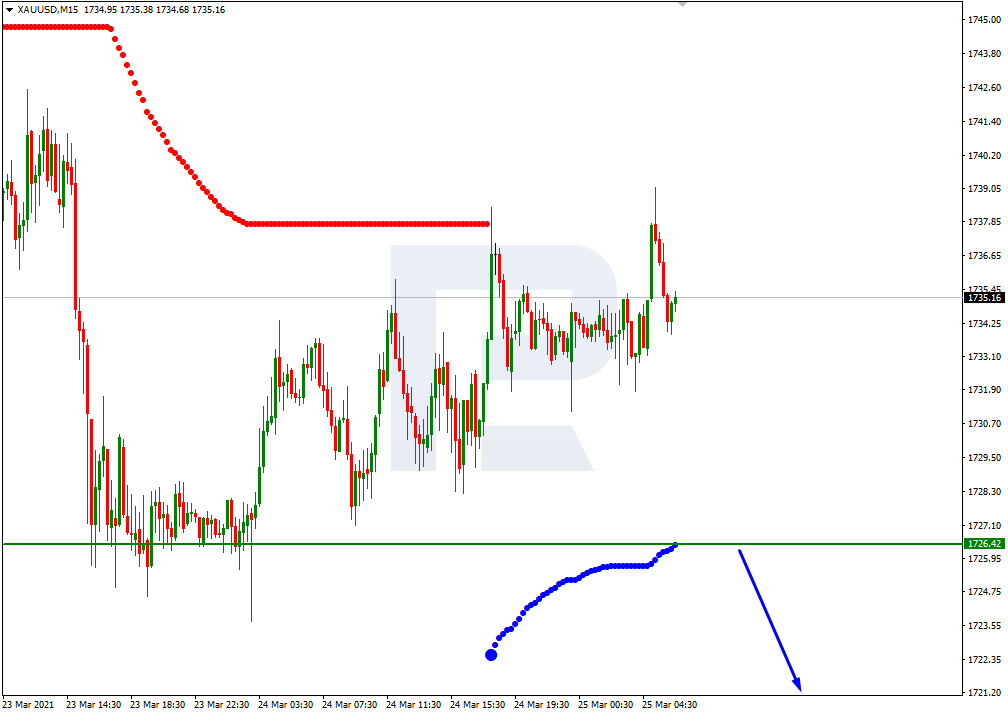
In the M15 chart, the price may break the downside line of the VoltyChannel indicator and, as a result, continue falling.

USDCAD_M15

Article By RoboForex.com

Attention!
Forecasts presented in this section only reflect the author’s private opinion and should not be considered as guidance for trading. RoboForex LP bears no responsibility for trading results based on trading recommendations described in these analytical reviews.