On Friday, the EUR/USD pair traded in the range of 1.1950 – 1.1995 and closed the day with a result of +0.16%. On the H1 and the H4 timeframes, the price is above the moving average. The MACD is in the positive zone. The uptrend persists, which tells us that it is better to stick with ideas towards buying.
Trading recommendations
Support levels: 1.1990, 1.1927, 1.1860, 1.1797, 1.1700
Resistance levels: 1.2100, 1.2242
As for EUR/USD, the upward movement remains. We recommend looking for entry points to buy. It is best to look for entry points after the price corrects to the support level of 1.1990.
Alternative scenario: after the price breaks through and consolidates below the level of 1.1990, the price may go to the support level of 1.1927.
There is no news feed for today.
The GBP/USD currency pair
Technical indicators of the currency pair:
Prev Open: 1.3773
Prev Close: 1.3830
% chg. over the last day: +0.41%
On Friday, the GBP/USD currency pair was trading in an uptrend and closed the day with +0.41%. On the hourly chart, the pair is trading above the 200-day moving average. The situation is similar on the four-hour chart. The MACD indicator is in the positive zone on the H1. So it is worth buying the instrument.
Trading recommendations
Support levels: 1.3667, 1.3750, 1.3807
Resistance levels: 1.3917
At the moment, the price is above the moving average, which tells us about an uptrend. The MACD is also in positive territory. Only buying should be considered. It is best to look for entry points on the price correction to the 1.3800 level.
Alternative scenario: after the price breaks through and consolidates below the level of 1.3800, short positions to the level of 1.3750 should be considered.
There is no news feed for today.
The USD/JPY currency pair
Technical indicators of the currency pair:
Prev Open: 108.72
Prev Close: 108.78
% chg. over the last day: +0.06%
On Friday, the USD/JPY pair traded in a narrow range of 108.60 – 108.95 and showed a change of +0.06%. On the H1 and H4 timeframes, the price is below the moving average, which tells us about the continuation of the downward movement. For now, it is better to stick to the bearish trade.
Trading recommendations
Support levels: 107.00
Resistance levels: 108.60, 109, 109.75
While the price is below the moving average on the H1 timeframe, it is worth looking for entry points to sell the instrument. The main scenario is the search for a sell entry point after price correction to the level of 108.60.
Alternative scenario: if the price breaks out and consolidates above the level of 109.08, it is worth buying to 109.75.
There is no news feed for today.
The USD/CAD currency pair
Technical indicators of the currency pair:
Prev Open: 1.2538
Prev Close: 1.2505
% chg. over the last day: -0.25%
On Friday, the USD/CAD currency pair was trading in a downtrend and showed a 0.25% drop. At the moment, the currency pair is below the moving average, and the MACD indicator is in the negative zone. So it is worth selling the instrument.
Trading recommendations
Support levels: 1.2477, 1.2364
Resistance levels: 1.2628, 1.2560
At this point, it is best to consider selling. The entry point should be sought after the price breaks down and consolidates below the level of 1.2477.
Alternative scenario: after breaking out and consolidating above the level of 1.2560, one should open buy deals to 1.2628.
This article reflects a personal opinion and should not be interpreted as an investment advice, and/or offer, and/or a persistent request for carrying out financial transactions, and/or a guarantee, and/or a forecast of future events.
On Friday, the US stock exchanges trading ended with an increase in the three major indexes by 0.1-0.5%, updating all-time highs after positive data from the housing market in March.
On Friday, trading ended with an increase in the EURO STOXX 50 Index by 1%, which reached its highest point since the beginning of 2008.
There is positive dynamics that prevail during the trading session in Asia this morning. Japanese JPN225 fell less than by 0.1%. Australian AUS200 increased less than by 0.1%. Chinese indices are increasing by 1.5-2.5%, continuing to follow the positive economic data for March and the 1st quarter published on Friday.
On Monday, oil prices fell as the accelerating spread of COVID-19 in India and other countries raises concerns that more drastic measures for the pandemic containment will hit the economic activity and demand for raw materials. India has reported a record rise in the number of coronavirus cases.
In China, markets are closely following the first meeting between Biden and Japanese Prime Minister Yoshihide Sugi and a possible joint statement that could mention Taiwan for the first time since 1969. Investors haven’t priced the risk of increased activity by the Chinese Navy near Taiwan yet, but the likelihood of tensions with China is purring pressure on the Japanese stocks.
Main market quotes:
S&P 500 (F) 4,171.38 -4.87 (-0.12%)
Dow Jones 34,200.67 +164.68 (+0.48%)
DAX 15,456.60 -3.15 (-0.02%)
FTSE 100 7,028.21 +8.68 (+0.12%)
USD Index 91.157 -0.387 (-0.42%)
Important events:
– Eurozone Construction Output (April) at 12:00 (GMT+3).
This article reflects a personal opinion and should not be interpreted as an investment advice, and/or offer, and/or a persistent request for carrying out financial transactions, and/or a guarantee, and/or a forecast of future events.
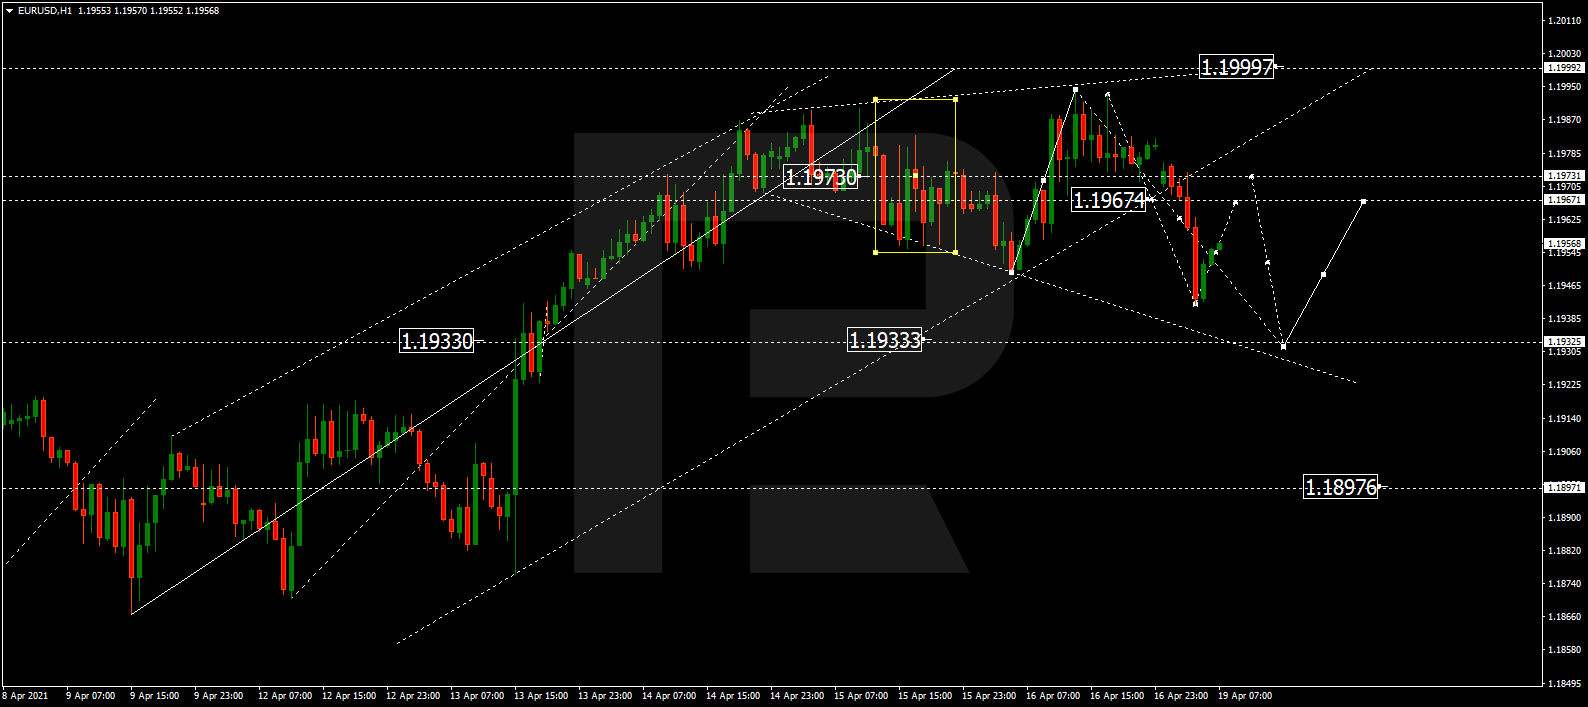
After breaking the ascending channel at 1.1973, EURUSD has reached the target at 1.1955; right now, it is growing towards 1.1967. Later, the market may fall to reach 1.1933 and then form one more ascending structure to return to 1.1967.
GBPUSD, “Great Britain Pound vs US Dollar”
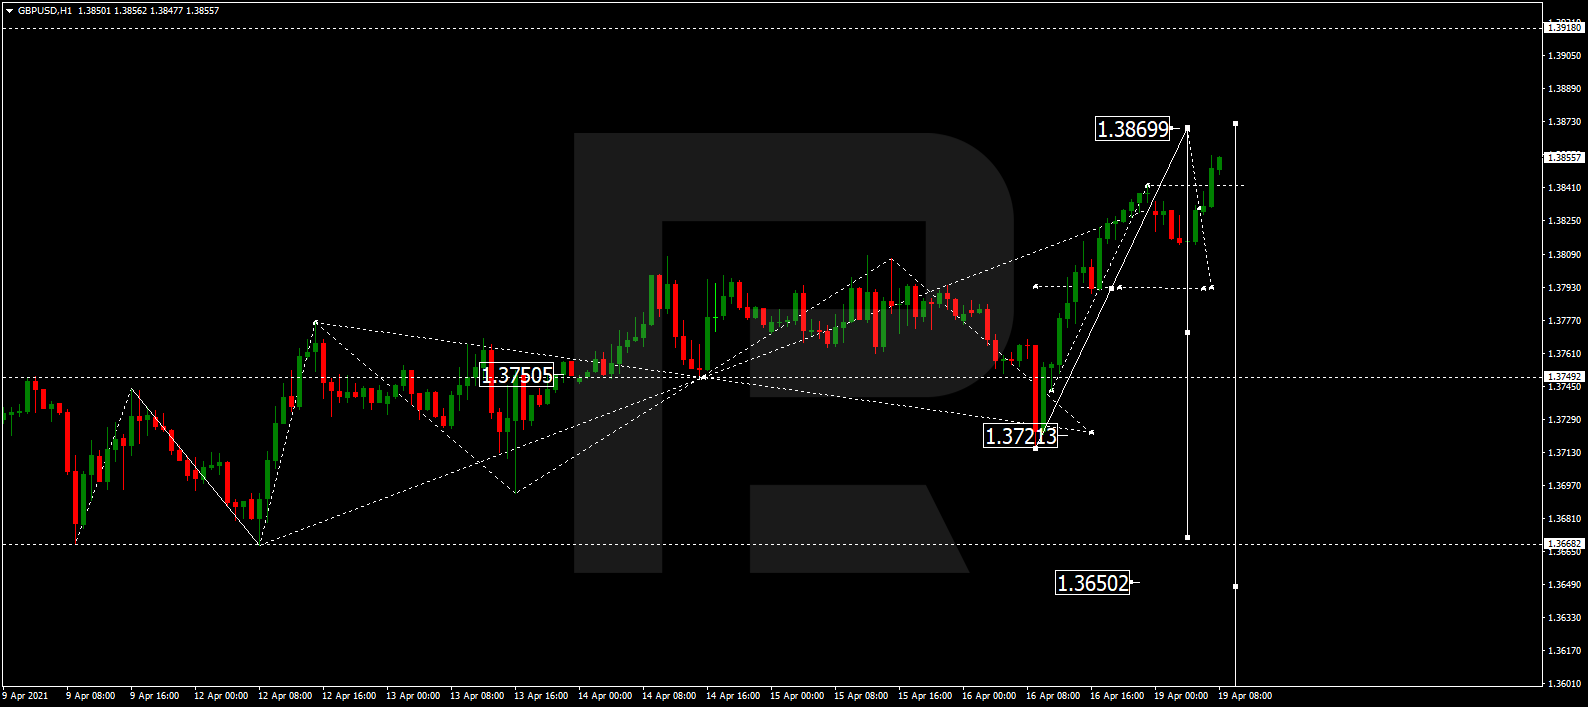
GBPUSD has completed the ascending wave at 1.3830; right now, it is still moving upwards. Possibly, today the pair may reach 1.3869 and then resume trading downwards with the target at 1.3750.
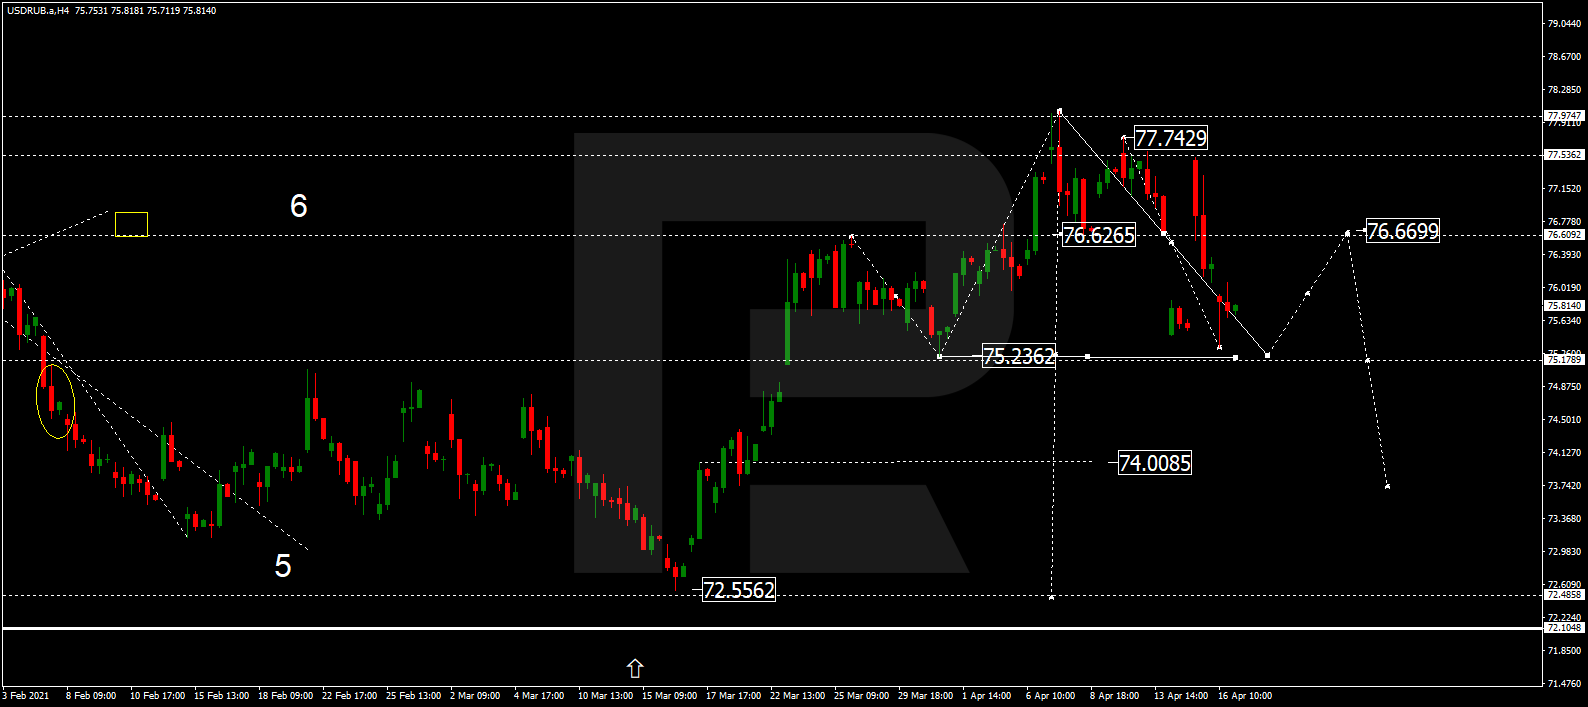
USDRUB, “US Dollar vs Russian Ruble”
After finishing the descending wave at 75.30, USDRUB is expected to grow towards 76.66. After that, the instrument may form a new descending structure with the short-term target at 74.00.
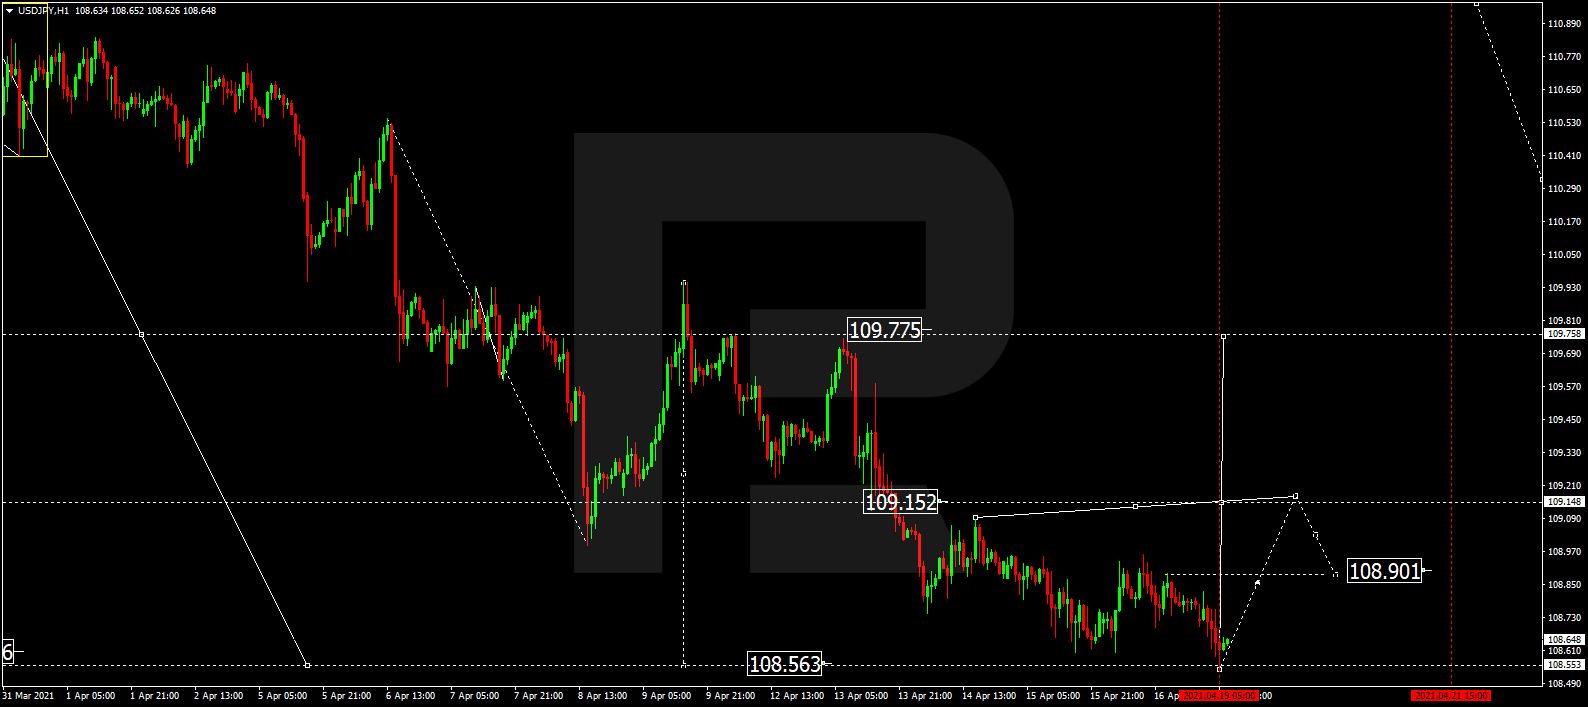
USDJPY, “US Dollar vs Japanese Yen”
After reaching its predicted downside target at 108.55, USDJPY is growing towards 109.15 and may later fall to reach 108.74, thus forming a new consolidation range between the two latter levels. After that, the instrument may break the range to the upside and form one more ascending structure with the target at 109.80.
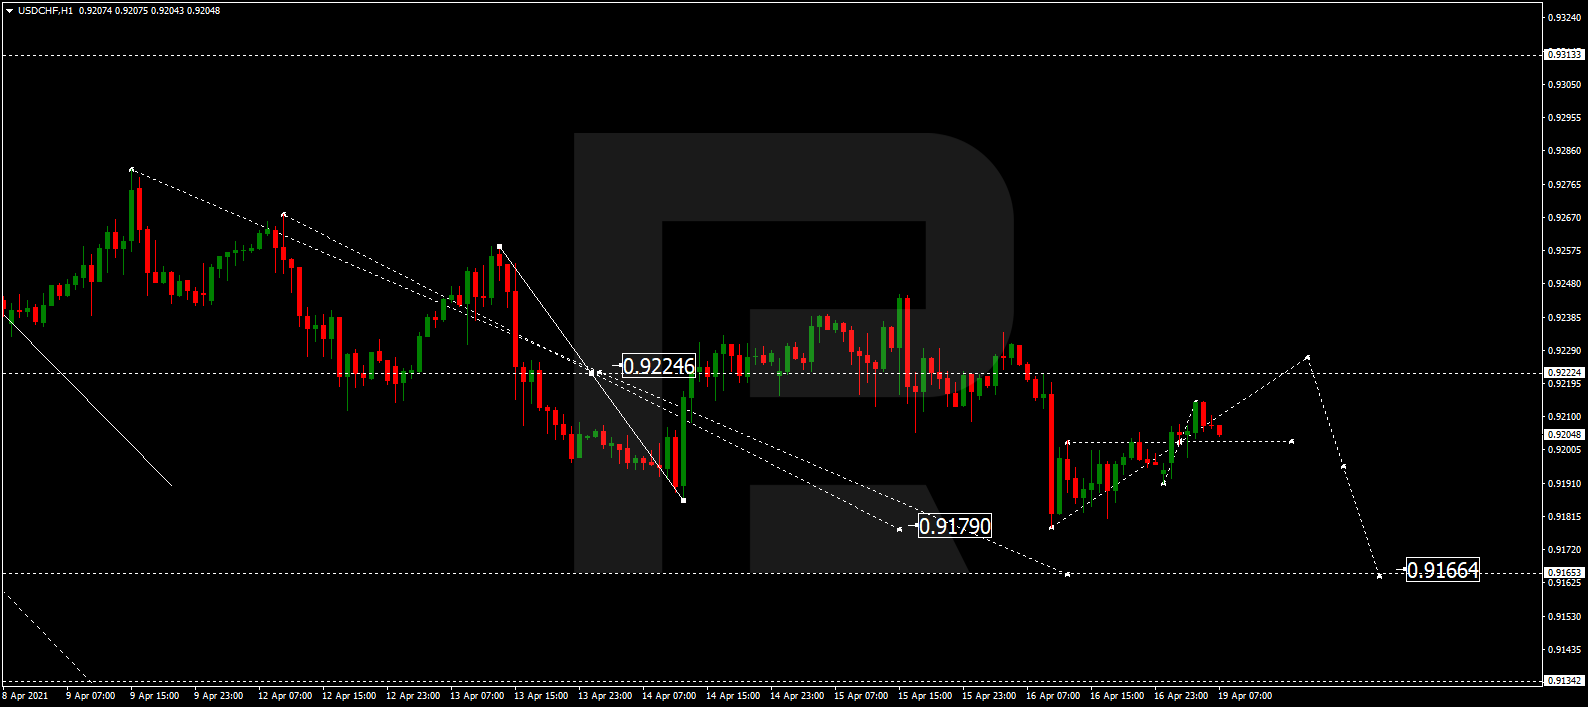
USDCHF, “US Dollar vs Swiss Franc”
USDCHF is moving upwards to reach 0.9223. Later, the market may start a new decline with the target at 0.9166 and then resume growing to return to 0.9223.
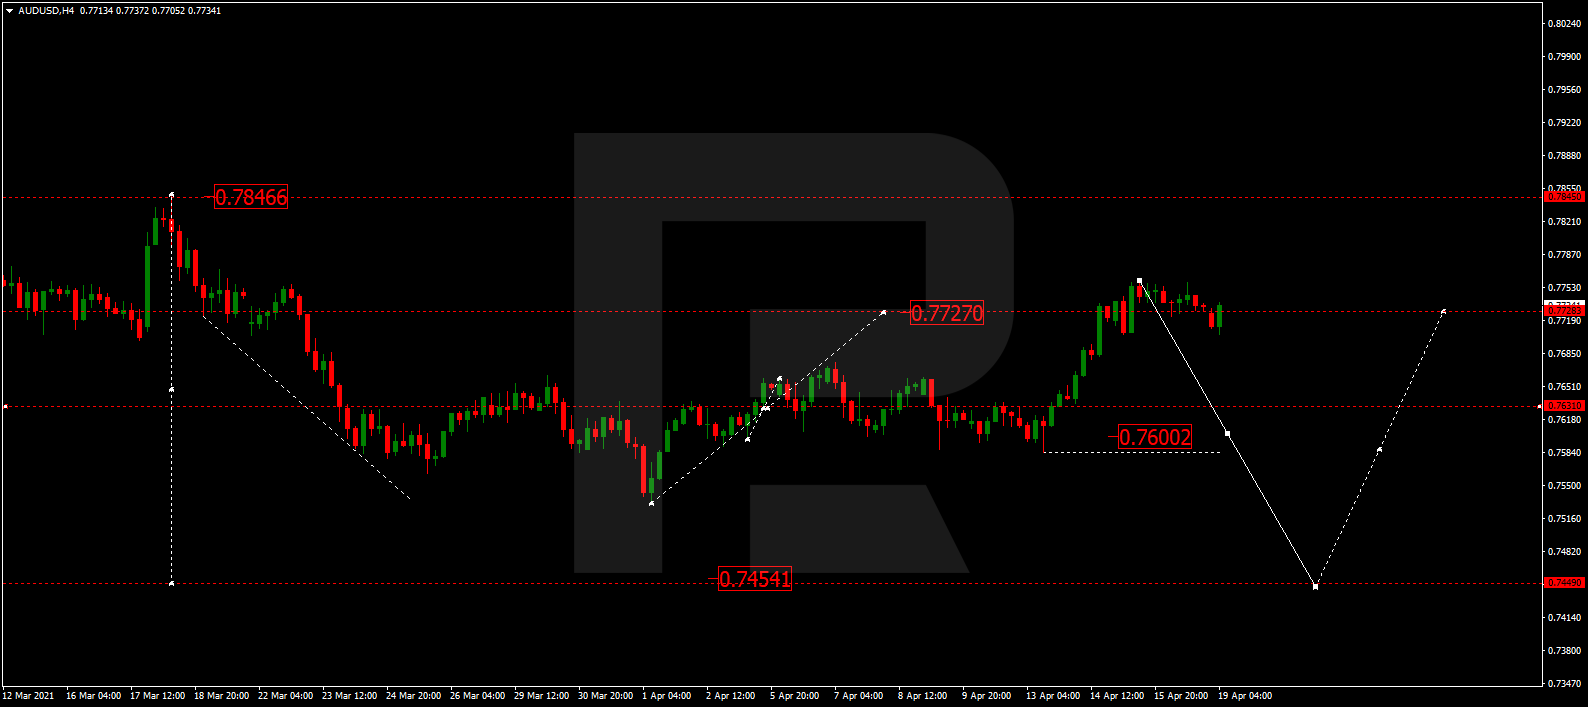
AUDUSD, “Australian Dollar vs US Dollar”
AUDUSD is still consolidating at the top not far from 0.7727. Possibly, the pair may break the range to the downside and form a new descending structure with the first target at 0.7600. The key downside target is at 0.7454. After that, the instrument may resume trading upwards to reach 0.7850.
BRENT
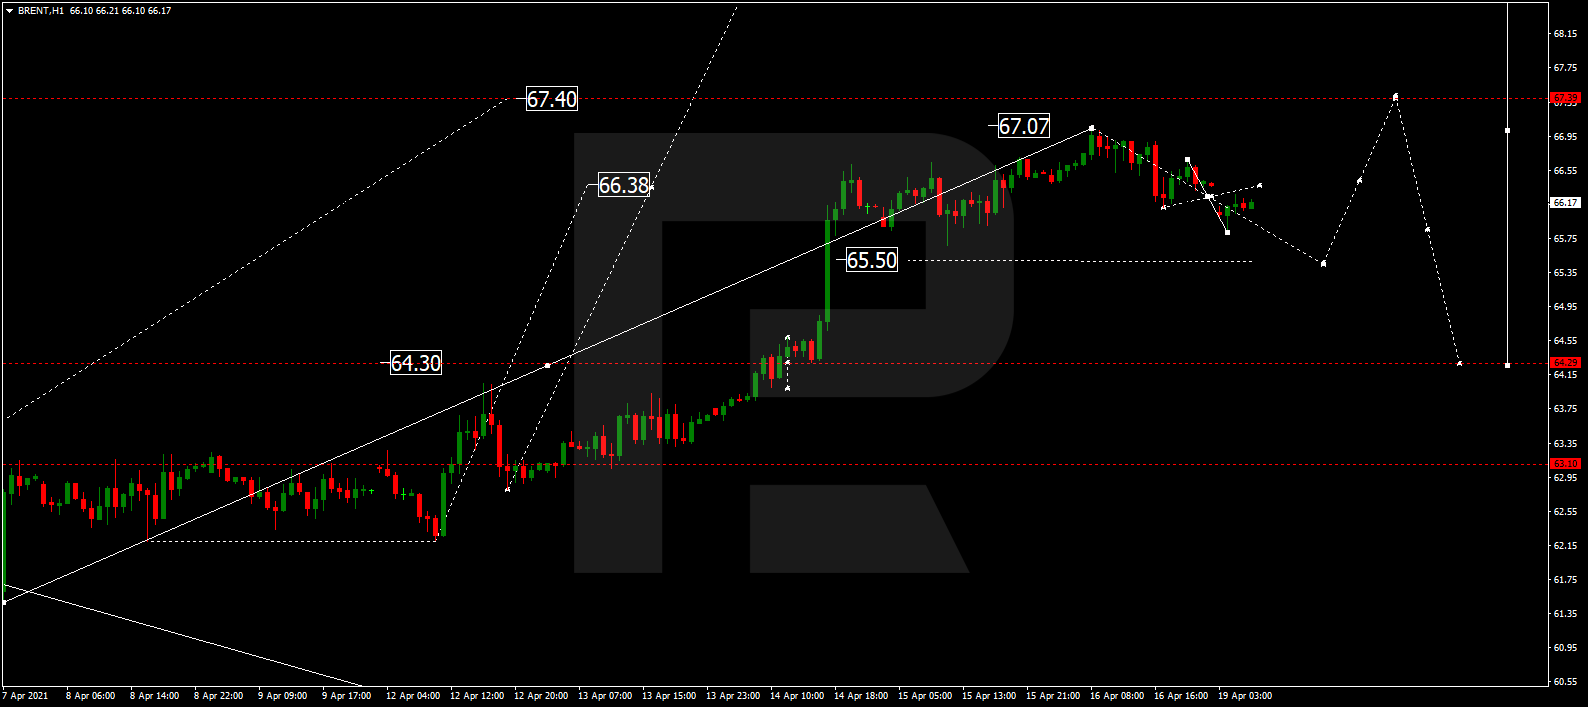
After finishing the ascending wave at 67.07, Brent is correcting. Today, the asset may complete the correction by testing 65.50 from above and then grow with the target at 67.40.
XAUUSD, “Gold vs US Dollar”
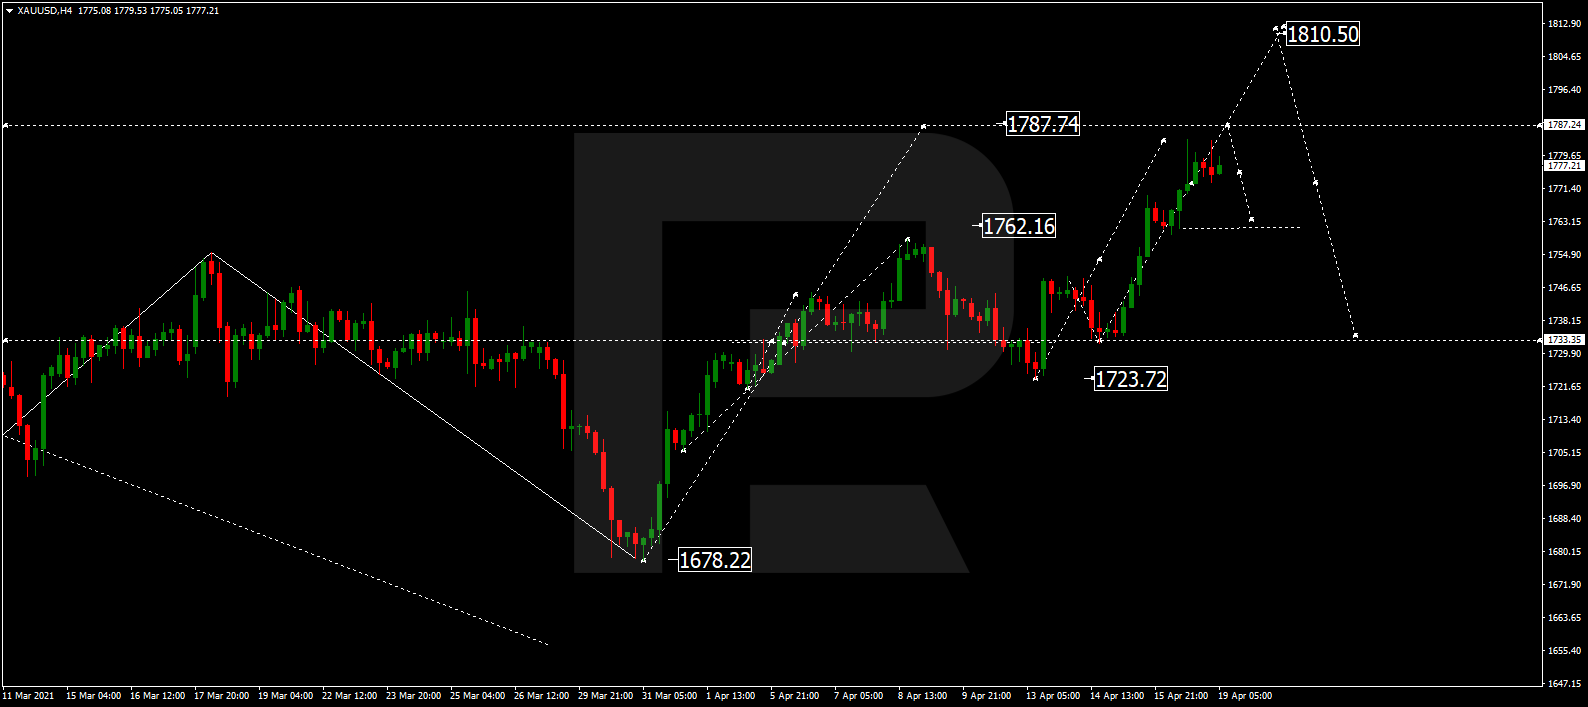
Gold continues growing towards 1787.74. After that, the instrument may correct to reach 1762.16 and then resume trading upwards with the short-term target at 1810.50.
S&P 500
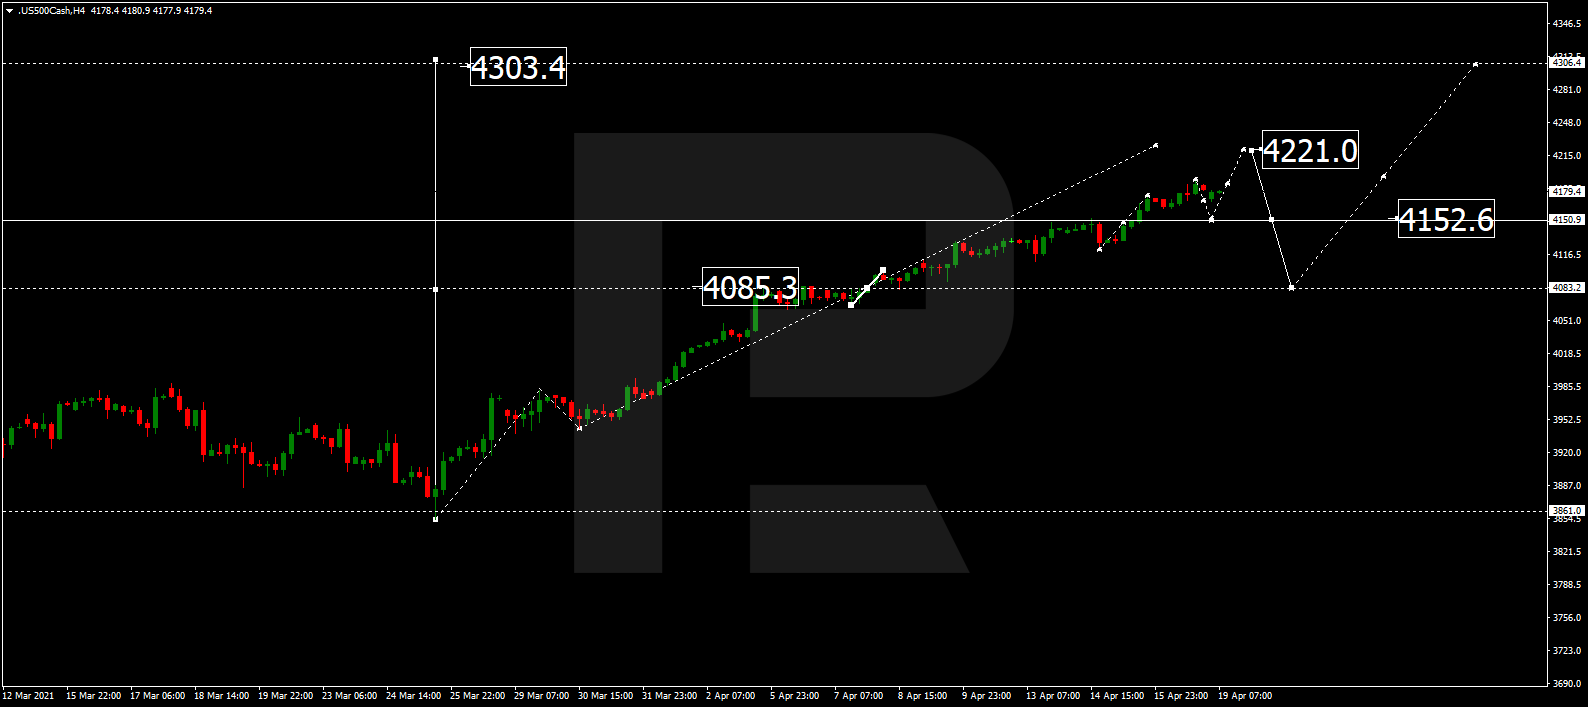
The S&P index is still moving upwards. Possibly, the asset may extend this structure up to 4221.0 and then start a new correction towards 4152.6. Later, the market may form one more ascending structure with the target at 4303.3.
Attention! Forecasts presented in this section only reflect the author’s private opinion and should not be considered as guidance for trading. RoboForex LP bears no responsibility for trading results based on trading recommendations described in these analytical reviews.
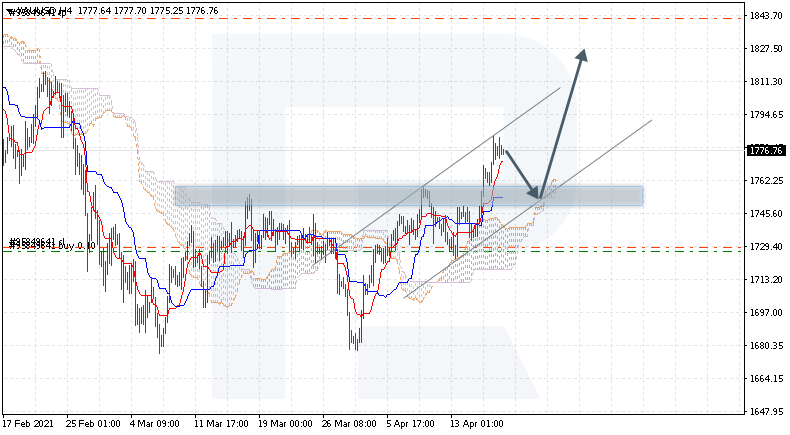
XAUUSD is trading at 1776.00; the instrument is moving above Ichimoku Cloud, thus indicating an ascending tendency. The markets could indicate that the price may test the cloud’s upside border at 1750.00 and then resume moving upwards to reach 1830.00. Another signal in favor of a further uptrend will be a rebound from the rising channel’s downside border. However, the bullish scenario may no longer be valid if the price breaks the cloud’s downside border and fixes below 1705.00. In this case, the pair may continue falling towards 1635.00.
NZDUSD, “New Zealand Dollar vs US Dollar”
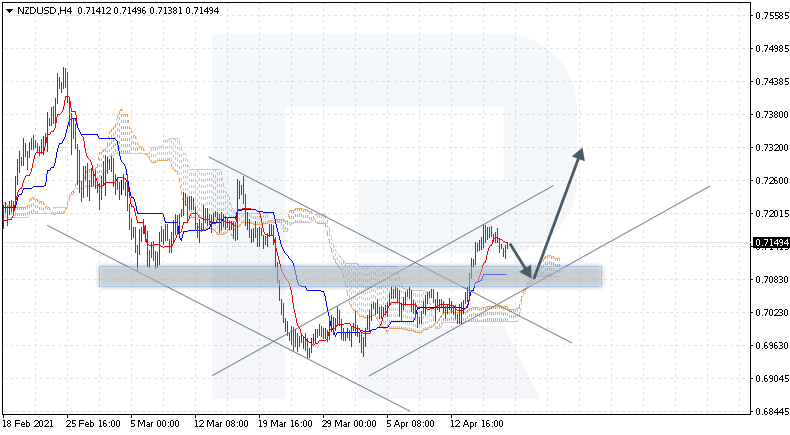
NZDUSD is trading at 0.7149; the instrument is moving above Ichimoku Cloud, thus indicating an ascending tendency. The markets could indicate that the price may test the cloud’s upside border at 0.7085 and then resume moving upwards to reach 0.7325. Another signal in favor of a further uptrend will be a rebound from the rising channel’s downside border. However, the bullish scenario may be canceled if the price breaks the cloud’s downside border and fixes below 0.6995. In this case, the pair may continue falling towards 0.6905.
AUDCHF, “Australian Dollar vs Swiss Franc”
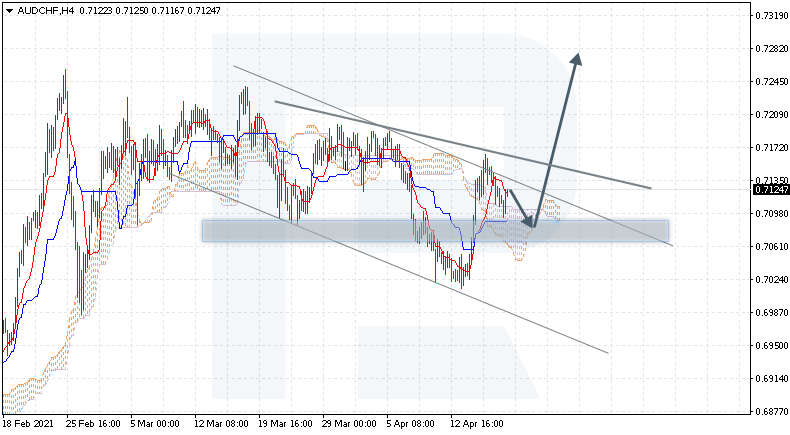
AUDCHF is trading at 0.7124; the instrument is moving above Ichimoku Cloud, thus indicating an ascending tendency. The markets could indicate that the price may test the cloud’s downside border at 0.7065 and then resume moving upwards to reach 0.7285. Another signal in favor of a further uptrend will be a rebound from the support level. However, the bullish scenario may no longer be valid if the price breaks the cloud’s downside border and fixes below 0.7005. In this case, the pair may continue falling towards 0.6905. To confirm further growth, the asset must break the descending channel’s upside border and fix above 0.7185, thus completing an Inverted Head & Shoulder reversal pattern; the pattern materialization target is at 0.7325.
Attention! Forecasts presented in this section only reflect the author’s private opinion and should not be considered as guidance for trading. RoboForex LP bears no responsibility for trading results based on trading recommendations described in these analytical reviews.
– This second part of our research article related to the new Bullish price phase in Precious Metals and Miners will continue to explore the potential range and targets for higher price trends.
In the first part of this article, I discussed how precious metals have started moving higher in somewhat of a stealth mode – not really drawing a lot of attention from traders. While other commodities and market sectors continue to rally, Gold and Silver have recently been setting up a new momentum base over the past few weeks. If our research is correct, we may soon see a stronger bullish price rally in precious metals which may drive miners 3x to 5x higher as Miners have greater Alpha than precious metals.
Are The Stars Aligning For A Big Market Shift Focusing On Gold & Silver?
Another key factor is that we’ve recently shifted away from an appreciation cycle phase and into a depreciation cycle phase. This new Depreciation cycle phase suggests the US Dollar may enter a decidedly downward overall trend while the US stock market may continue to move higher with increased volatility and extended price rotation ranges. Additionally, this new Depreciation cycle phase clearly suggests precious metals will begin an upward price trend that may last well into 2027~2028 or longer.
The following Monthly Gold chart highlights the broad Appreciation/Depreciation cycle phases (with the GREEN: Appreciation and RED: Depreciation sloping lines) and also shows two Fibonacci Price Extension ranges (or Measured Moves). Interestingly, the 100% measured move ranges of both Fibonacci anchor points highlight a $2700 target level. Beyond that level, we see $3250 and $3550 as substantial upside target levels. This suggests Gold may rally over 50% from current levels to reach the first target level near $2700 (or higher) over the next 5+ years.
In the shorter term, we need to watch metals, miners, and the US Dollar for signs that this pending longer-term trend is confirming. Currently, Gold and Silver are starting to break a downward/sideways price channel and appear to be starting a new upside price trend. We need to watch for technical confirmation of this breakout as it will likely start a new, broader, price trend based on our cycle research. Keeping that in mind, let’s take a look at some current Daily charts that show why any breakout price trend in metals may present an explosive opportunity for traders.
Junior Silver Miners Need To Breakout Above $16.50~$17.00 For Bigger Rally
You can see from this the Silver Junior Miners Daily chart (SILJ) price has recently broken above the downward sloping price channel shown as a CYAN line. This upside price breakout is important, yet we need to see SILJ move above $16.50~$17.00 to really start a broader bullish price trend. Once this level has been breached, which may be very soon, we believe an explosive upside price trend may quickly take SILJ well above $18.50 and beyond.
Silver and Silver miners share one key facet that makes them extremely opportunistic for traders. Typically, when these types of cycle phase trends take hold, Gold will rally substantially higher over time. Yet, Silver, which is often overlooked as a metals hedge instrument, begins to rally faster than Gold in a percentage term. For example, from the bottom in 2015 to the current highs, Gold rallied a little over 101% – whereas Silver rallied over 124%. This happened near the end of the previous Appreciation cycle phase. When and if our expectations become true, Gold will rally 50% to 75% (or more) from current levels and Silver may rally 85% to 175% or more.
Miners May See An Incredible Breakout Rally If Metals Begin A Big Bullish Cycle
The following Daily Coeur Mining Chart (CDE) highlights the similarities between how the price activity of SILJ and CDE. On the CDE chart, you can see a more defined Pennant/Flag formation that is nearing an Apex. You can also see the bullish breakout event starting to set up on the right side of this chart. If Silver breaks into a bullish trend, pulling SILJ higher as well, CDE will likely break above the $10.50 level and begin to move towards the previous high price level near $12.00 to $12.50 (or higher). This represents a solid 20% to 35% upside price advance for CDE – possibly much higher over time.
In closing, there are two key elements we want readers to focus on. First, the transition into a Depreciation cycle phase, which usually prompts a stronger precious metals price rally and ending in a parabolic price advance. Second, the current setup of Gold and Silver, which have already been moving higher since 2015. This combination suggests the excess phase rally in the US stock market over the past 5+ years has already prompted a move into hedging instruments (Gold & Silver). This is very similar to what happened in 2000 to 2005 – after the DOT COM bubble burst. The real rally in precious metals didn’t start until after 2005~2006 – when Gold rallied over 365% from the $400 price level. Silver rallied over 600% during that same span of time.
It is very likely that many precious metals mining stocks are set up in similar patterns recently. Mostly flagging sideways into Apex formations with some already starting to break out into an upward price trend. We are watching for Gold and Silver to confirm this new upside price trend by attempting to move substantially higher to break previous price peaks. If we can see Gold and Silver continue to move higher while breaking through historical resistance levels (past price peaks), then we would expect this to indicate a broader market trend is setting up and momentum for this move in building.
Remember, this is a 6 to 7+ year cycle related to the new Depreciation cycle phase. Eventually, as the markets transition into this new phase, Gold and Silver will begin a broad rally mode while the US stock market may enter a period of excessive volatility and rotation. The last Depreciation cycle phase took place from 2001 to 2010 (roughly). We are certain many of you remember how the stock market reacted during that market phase?
As a trader/investor, this means bigger trends, bigger price rotation and volatility, and the potential for an incredibly successful phase of market rotation is likely to take place over the next 7+ years – even longer. If you are having trouble understanding how to find opportunities in various sectors and major market trends, then sign up now for my FREE course that teaches you how to find, enter, and profit from only those sectors that have the most strength and momentum.
For those of you who believe in the power of trading sectors that show relative strength and momentum but don’t have the time to do the research every day, let my BAN Trader Pro newsletter service do all the work for you with daily market reports, research, and trade alerts. More frequent or experienced traders have been killing it trading options, ETFs, and stocks using my BAN Hotlist ranking the hottest ETFs, which is updated daily for my BAN Trader Pro subscribers.
This week – April 19 through April 24 – central banks from 9 countries or jurisdictions are scheduled to decide on monetary policy: Israel, China, Indonesia, Canada, Costa Rica, Uzbekistan, European Central Bank, Paraguay and Russia.
Following table includes the name of the country, the date of the next policy decision, the current policy rate, the local time a policy decision is announced, the result of the last policy decision, the change in the policy rate year to date, and the rate one year ago.
The table is updated when the latest decisions are announced and can always be accessed by clicking on This Week.
On Monday, April 19th, Brent is trading without any particular direction not far from $66.50. The oil market is consolidating after a lot of news that avalanched it earlier.
The latest forecast from JP Morgan suggests an average oil price at $70 by May, which is several months earlier than it was thought before. It’s a bit against the current market conditions: the anti-coronavirus vaccination campaign around the world is not as fast as it was expected to be, but Europe may speed up the economic recovery process next to the USA. At the same time, signals from China demonstrate a slowdown in the economy after a pretty effective first quarter.
The oil supply is rising: Iran is boosting both the output and export. Alongside this, the oil output in the Permian Basin is also rising and get back to its pre-crisis levels by October.
All of this somehow is limiting prospects of the oil price growth both right now and in the mid-term.
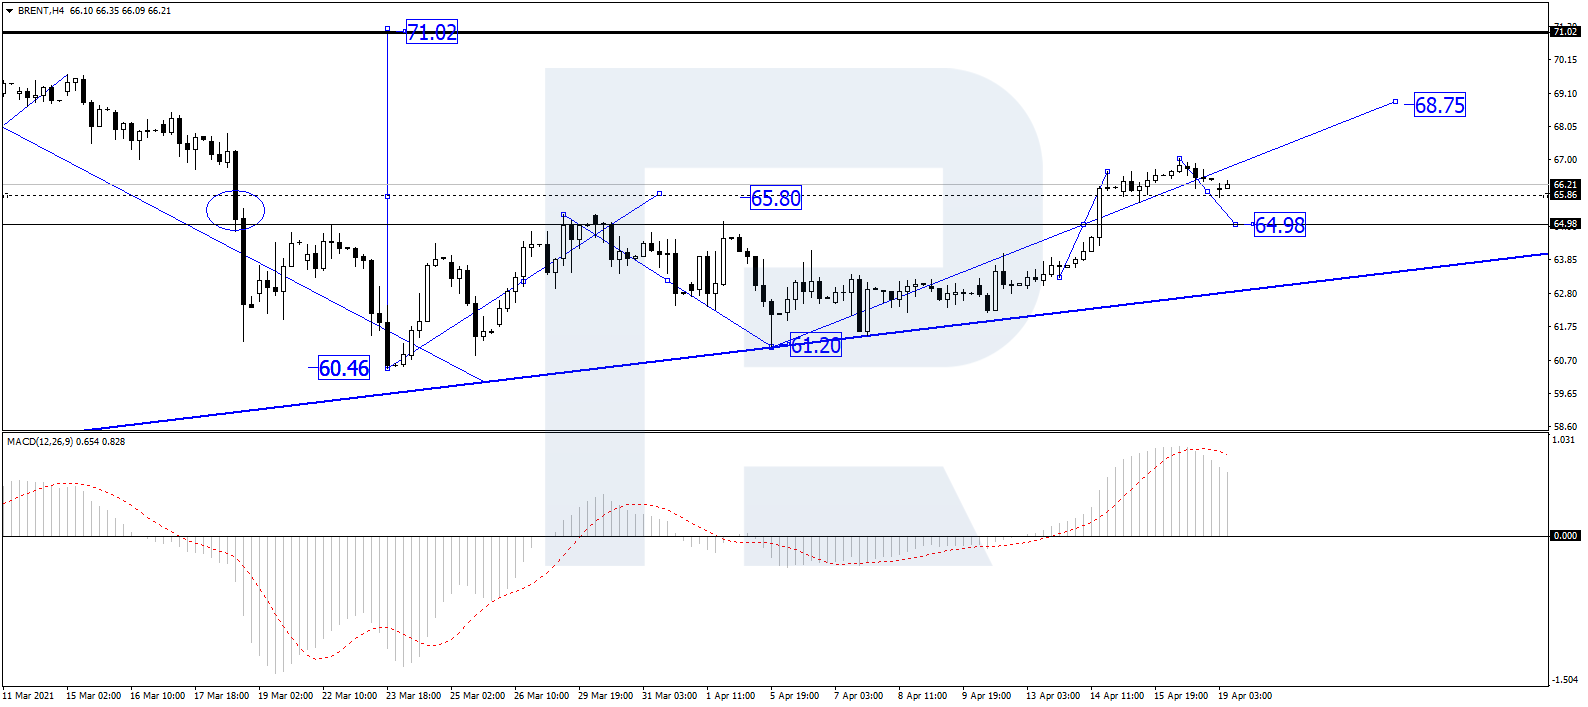
In the H4 chart, after finishing another ascending wave at 66.50, Brent is consolidating around this level. If later the price breaks this range to the upside, the market may form one more ascending structure towards 67.60 or even reach the short-term target at 68.75; if to the downside – start a new correction towards 65.00 and then resume moving within the uptrend to reach 90.00. From the technical point of view, this scenario is confirmed by MACD Oscillator: its signal line is moving outside the histogram area to grow towards 0. After that, the growth is expected to continue.
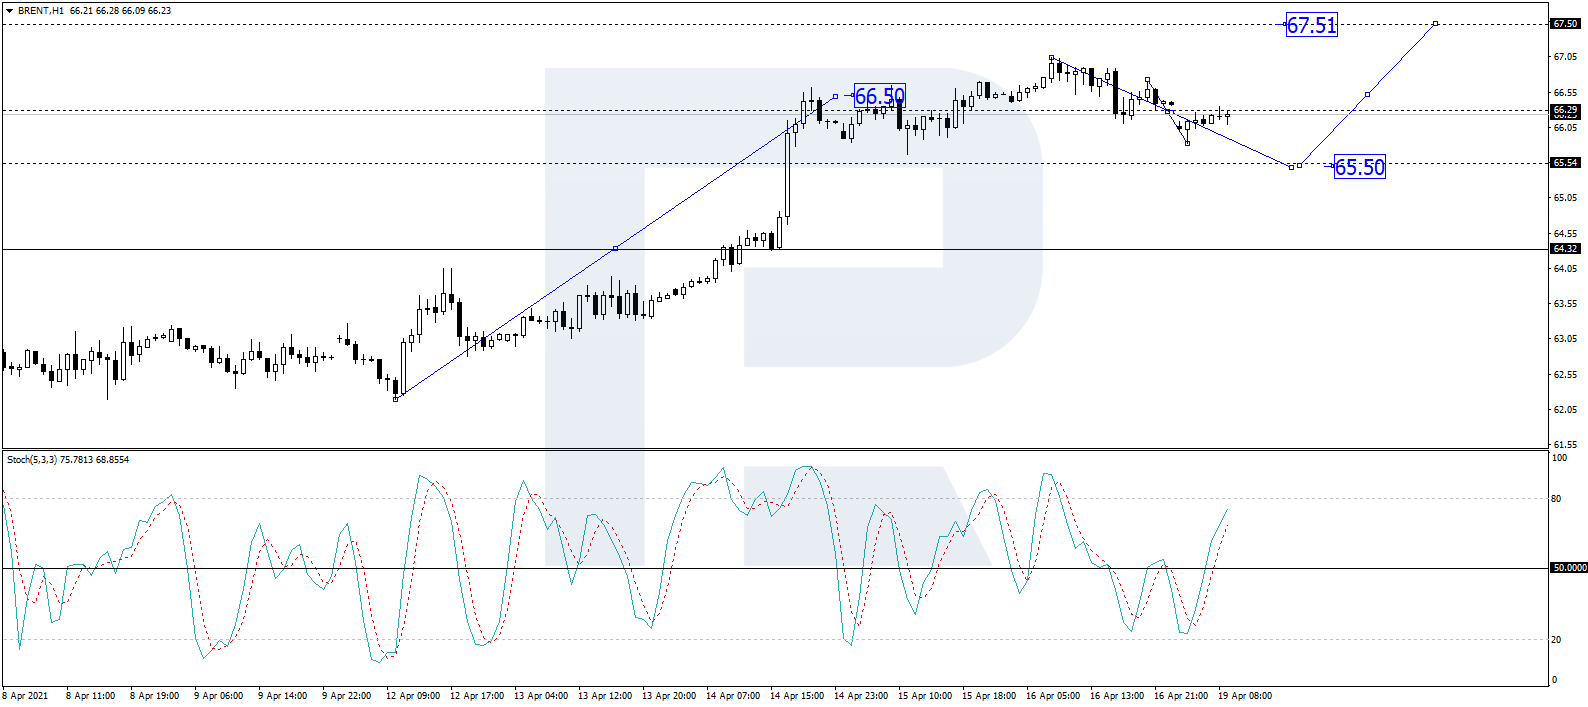
As we can see in the H1 chart, after forming another consolidation range, this time around 64.30, and breaking it to the upside, Brent has reached 66.50; right now, it is forming one more consolidation range around the latter level. Possibly, the asset may expand the range both upwards and downwards, first to 67.00 and then to 65.50, and then resume growing with the target at 67.50. From the technical point of view, this idea is confirmed by the Stochastic Oscillator: its signal line moving upwards and has already broken 50, which implies further growth towards 80.
Disclaimer
Any forecasts contained herein are based on the author’s particular opinion. This analysis may not be treated as trading advice. RoboForex bears no responsibility for trading results based on trading recommendations and reviews contained herein.
Asian shares were mostly higher on Monday while US equity futures are trading mixed after the S&P 500 and Dow Jones closed at all-time highs on Friday.
Last week’s strong economic data from the United States and China have fueled hopes of a solid global economic recovery. Bumper corporate earnings from US banks have also injected equity bulls with enough inspiration to elevate indices to record highs. These themes are likely to support the risk-on mood despite global Covid-19 cases hitting a weekly record last week. European stocks have opened marginally higher this morning amid the market positivity and this could trickle down into Wall Street later in the afternoon.
Despite all this positivity, it does feel like a sluggish start to what should be a busy week for markets. Today, the calendar is void of any major economic releases in the United States, United Kingdom and Europe. There is little movement across currency markets at the time of writing while Gold is hovering around $1777. But given how earnings season is set to build momentum through the week and major economies will release key data that could influence sentiment, things could liven up in the next few days.
Dollar still sulking
The dollar has stumbled into the new week under pressure as Treasury yields lingered near their lowest in five weeks. The greenback has weakened against most G10 currencies this morning with the Dollar Index (DXY) wobbling above the 91.50 support. Since the start of April, the DXY has lost roughly 1.80% and this may continue despite the string of encouraging data from the United States pointing to an accelerated economic recovery. As investors accept the Federal Reserves’ vow to keep an accommodative monetary policy stance until it sees stronger employment and inflation, dollar bears might remain in the driving seat. With the DXY trading below the 200-day SMA and respecting the bearish trend, further downside could be on the cards. A solid breakdown below 91.50 should open the doors towards 91.30 and 90.80.
Commodity spotlight – Gold
Gold drew ample strength from falling Treasury yields and a weaker dollar last week. The commodity is up over 4% this month and has the ability to push higher amid rising tensions between the United States and Russia. However, gold bears could still make an appearance as economic data from the two largest economies in the world remains highly encouraging and may boost global sentiment. If risk-on becomes the name of the game, it could hit appetite for safe-haven gold.
Looking at the technical picture, gold bulls are back in town and look to have an appetite for $1800.
Disclaimer: The content in this article comprises personal opinions and should not be construed as containing personal and/or other investment advice and/or an offer of and/or solicitation for any transactions in financial instruments and/or a guarantee and/or prediction of future performance. ForexTime (FXTM), its affiliates, agents, directors, officers or employees do not guarantee the accuracy, validity, timeliness or completeness, of any information or data made available and assume no liability as to any loss arising from any investment based on the same.
New Covid-19 cases hit a pandemic record, exceeding 5.2 million last week, even as the vaccine continues being administered around the world. Still, risk assets have been relatively immune to negative headlines surrounding the pandemic, with Asianstocks now in the green.
With the US earnings season underway amid a relative calm in US Treasury markets, benchmark US stock indexes such as the Dow, S&P 500, and the Nasdaq 100 look set to post new record highs this week, even though the futures contracts are dipping slightly at the time of writing.
As for the currency markets, amid a softening US dollar, it remains to be seen whether the likes of the euro and the Canadian dollar can take advantage of the potential catalysts in the coming days:
At its event labelled “Spring Loaded”, the iPhone maker is expected to announce new products, including a line of new iPad Pros. The iPad contributed over 8% to Apple’s total annual revenue in three out of the past four years. Still, last year’s figures were the highest for iPad sales since 2014, as consumers flocked to the tablet as work and schooling commitments became home bound amid the lockdowns worldwide.
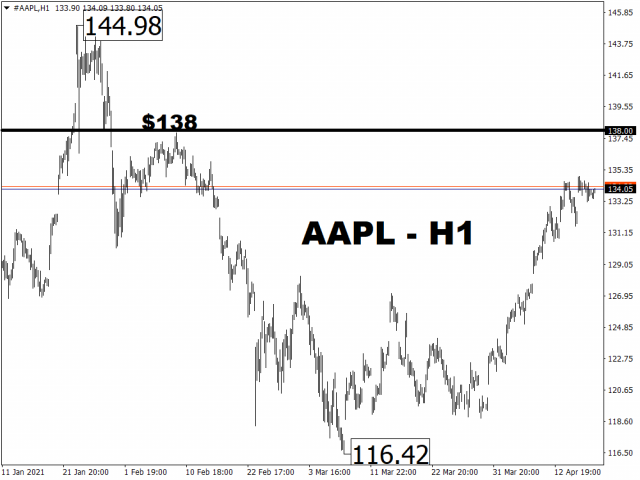
It remains to be seen whether the confirmed features of this new iPad Pro would also excite market participants, considering that Apple’s share prices have failed to match its January record high. The stock is still some 6.3% lower since recording its highest ever closing price on January 26th.
During the same period (since 26 January):
Facebook has surged 8.56% to post a new record high on April 7
Alphabet shares have climbed almost 20% to hit a new record high on April 16
The Nasdaq 100 has climbed 4.09% to post a new record high on April 16
Perhaps the iPad Pro could stir up enough enthusiasm this week for Apple’s stock to allow it to catch up with other tech stocks.
CAD to still outperform G10 peers?
The Canadian dollar is the second best-performing G10 currency against the US dollar so far this year, and has also strengthened against all G10 currencies except for the Norwegian Krone. However, the CAD has fallen against most of its G10 peers on a month-to-date basis.
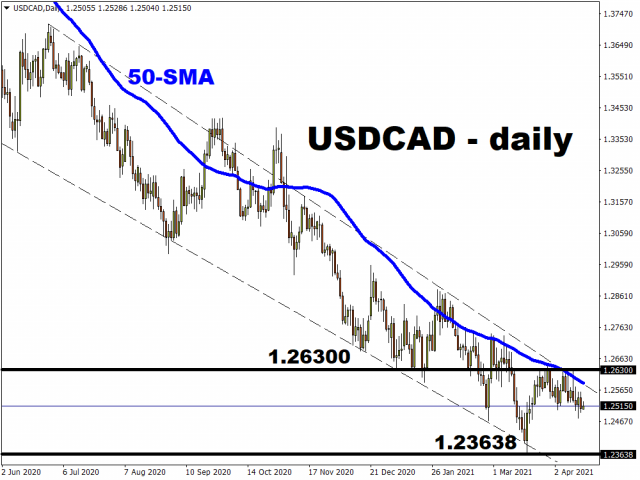
Still, Canadian dollar bulls can take heart from the fact that USDCAD’s 50-day simple moving average has resisted any major upward move for this currency pair to keep its downward trend intact.
From a fundamental perspective, the Canadian dollar’s strength has been fuelled by the robust recovery in Canada’s economy.
Today, Prime Minister Justin Trudeau is set to release the government’s first budget in two years. This increased spending of tens of billions could help recover the last 296,000 of the 3 million jobs it lost to the pandemic.
With the economy apparently on firmer footing, the Bank of Canada could announce the paring back of its bond purchases this week, and may even comment about a potential rate hike sooner than 2023.
Should that happen, that could drive Canada’s government bond yields even higher, which may then serve as a tailwind for the CAD.
Disclaimer: The content in this article comprises personal opinions and should not be construed as containing personal and/or other investment advice and/or an offer of and/or solicitation for any transactions in financial instruments and/or a guarantee and/or prediction of future performance. ForexTime (FXTM), its affiliates, agents, directors, officers or employees do not guarantee the accuracy, validity, timeliness or completeness, of any information or data made available and assume no liability as to any loss arising from any investment based on the same.
– A gold-backed digital asset has been added to one of the world’s largest financial advisory and fintech organisation’s cryptocurrency app.
deVere Group added Pax Gold (PAXG) to deVere Crypto to join other major digital currencies including Bitcoin, Ethereum, Dash, Cardano, Bitcoin Cash, XRP and Dogecoin.
Each PAXG token is backed by a piece of London Good Delivery gold bar, kept in Brink’s gold vaults, which is the approved storage company of the London Bullion Market Association.
The addition of Pax Gold on the deVere Crypto exchange comes a day after Bitcoin, the world’s largest cryptocurrency by market capitalisation, fell as much as 15% just days after hitting a new record high of $64,000.
Nigel Green, CEO and founder of deVere Group, says: “We have added Pax Gold, an established cryptocurrency that is entirely backed by gold, due to ongoing and increasing client demand for digital assets.
“Pax Gold offers investors the liquidity, flexibility and security of a blockchain-based cryptocurrency, together with the reputation and credibility of a valuable physical commodity.”
He continues: “The booming crypto market is known for being volatile. Many investors like the volatility as it can provide highly rewarding buying and selling opportunities.
“However, the market ups and downs aren’t for everyone. Pax Gold will appeal to investors who want to have exposure to digital assets – which are increasingly regarded as the future of money – without the higher levels of volatility.”
Launched in 2018, deVere Crypto is a pioneering app on which users can buy, sell, hold and exchange major cryptocurrencies. Digital assets, which are established and qualified by experts, are often added as the market develops. This year, Cardano, Dogecoin and now Pax Gold have been included.
Mr Green recently noted: “Crypto is a burgeoning asset class and it’s one that is set to play a larger and larger role within the global financial system.
“In today’s digitalised, globalised world, the demand for digital, global currencies in some form – is only set to grow.
“From now on, there will always be widely-used non-fiat money.”
The deVere CEO concludes: “We’re delighted to be able to now offer Pax Gold, which gives investors an easy and safe way to have exposure to real, regulated gold.
“This highlights our commitment to providing clients the opportunities and rewards of digital currencies.”
About:
deVere Group is one of the world’s largest independent advisors of specialist global financial solutions to international, local mass affluent, and high-net-worth clients. It has a network of more than 70 offices across the world, over 80,000 clients and $12bn under advisement.












 Article by