Tesla stocks fall after hours post-Q1 earnings

By Han Tan Market Analyst, ForexTime

Are Tesla shareholders becoming an insatiable bunch?

After US markets closed on Monday, the electric vehicle maker reported its highest-ever quarterly net profit (non-GAAP net income) of over $1 billion. The company reported its 7th consecutive quarterly net profit, which was helped in part by the $101 million the company made selling Bitcoin during the period.

Adjusted earnings per share of 93 cents whopped analysts’ estimates of 80 cents!

Meanwhile, the company’s revenue of $10.39 billion for the quarter marked a 74% increase compared to the same period last year, while only slightly missing analysts’ estimates for $10.41 billion. Tesla also delivered 184,800 cars around the world during the first 3 months of 2021, which is still about 4000 more vehicles delivered during the quarter prior (Q4 2020).

Yet, Tesla’s share price fell by as much as 3.1% in after-hours trading.

Seems like Tesla shareholders, as well as market participants at large, need more convincing before ploughing back into the stock. As of yesterday’s close, Tesla’s share price remains about 16.4% below its highest-ever closing price on 26 January 2021.

From a technical perspective, Tesla appears to be finding support from its 50-day simple moving average. The stock has been posting a series of higher highs and higher lows since March 5, the day which was the trough of its near-40% drop since breaching the psychologically-important $900 mark on 25 January.

However, with momentum still pointing north, Tesla may still hold enough lure to entice more investors and traders into restoring its share price closer to its not-too-distant former glory.

Tesla rides against headwinds

As for the outlook for its core business, Tesla didn’t reveal a specific target for 2021 deliveries but stuck to its script of 50% annual growth in deliveries “over a multi-year horizon”. Tesla is also increasing its production capabilities, with new factories in Texas and Berlin slated to come online this year, while Gigafactory Shanghai is expected to continue expanding.

Still, the EV-maker has to weather challenges, both near-term and long-term.

The computer chips shortage felt across multiple industries worldwide was described as a “huge problem” by Elon Musk himself, who also expects the problem to persist through Q3 2021. Over the longer-term, there are other players jumping onto the EV bandwagon, from Rivian Automotive (which has the backing of Amazon) and Lucid Motors to traditional players such as Volkswagen. More entrants into the EV game threatens to erode Tesla’s market share and its financial future.

Can Tesla retain its status as stock market darling?

Considering Tesla’s waning cult status, evidenced by its 4.61% year-to-date gain which lags behind the double-digit performance for the S&P 500 and the Dow, the EV maker may have its work cut out to stir the same kind of fervour that the stock enjoyed throughout 2020.

Looking ahead, Tesla may have to rely less on Bitcoin bets and regulatory credits to boost its top and bottom lines, and more on its core business in order to entice fundamentally-driven investors.

How could Tesla’s stock perform today?

Historically, Tesla’s share price registers a 7.5% single-day absolute move (in either direction) after its earnings release. Markets had priced in a 9.43% move, either upwards or downwards today.

Such positioning suggests there could be a major move for Tesla’s share price when the US cash session opens on Tuesday, with investors having already had plenty of time to digest the company’s latest quarterly results.


Disclaimer: The content in this article comprises personal opinions and should not be construed as containing personal and/or other investment advice and/or an offer of and/or solicitation for any transactions in financial instruments and/or a guarantee and/or prediction of future performance. ForexTime (FXTM), its affiliates, agents, directors, officers or employees do not guarantee the accuracy, validity, timeliness or completeness, of any information or data made available and assume no liability as to any loss arising from any investment based on the same.


Forex-Time-LogoArticle by ForexTime

ForexTime Ltd (FXTM) is an award winning international online forex broker regulated by CySEC 185/12 www.forextime.com

Could the approaching summer help boost the struggling tourism sector?

By Admiral Markets 

– We have entered the final stretch of April, with our eyes already set on the arrival of May and, with it, better weather in Europe. Looking forward over the coming weeks towards the summer months, many citizens are intently watching the evolution of the pandemic and the resultant measures imposed by European governments, waiting to find out if it will be possible to fly to their holiday destinations.

As we mentioned at the beginning of March, the arrival of good weather and vaccinations are breathing fresh life into the tourism sector, which has been hit hard by the pandemic. The viability of many companies has been put under scrutiny, leading airlines to trade at record lows due to the measures taken to curb their expansion at a global level.

These measures caused a drastic decrease in the number of flights and tourists last year, seeing only a brief respite during the summer months. This generated heavy losses in the airlines, causing giants such as Air France KLM to be forced to ask for public aid, leading to bailouts; or to carry out capital increases as in the case of IAG.

Although macroeconomic data are improving in the Eurozone as a whole and future prospects are no doubt better, the vaccination process in Europe has not started as expected. This has been largely due to the problems derived from the AstraZeneca and Janssen vaccines. With stoppages and delays in their administration respectively, a rebound in Covid cases has occurred and countries such as Germany are considering taking new measures until June.


IAG Analysis

IAG is one of the companies that has held up best in recent months thanks to the significant amount of liquidity it has had over the past year. This is partly due to its good position in the sector and the capital increase it carried out last September. Despite the problems with the vaccination process in Europe, in the United Kingdom, the process is much further advanced, which benefits the holding company formed by British Airways and the Spanish Iberia.

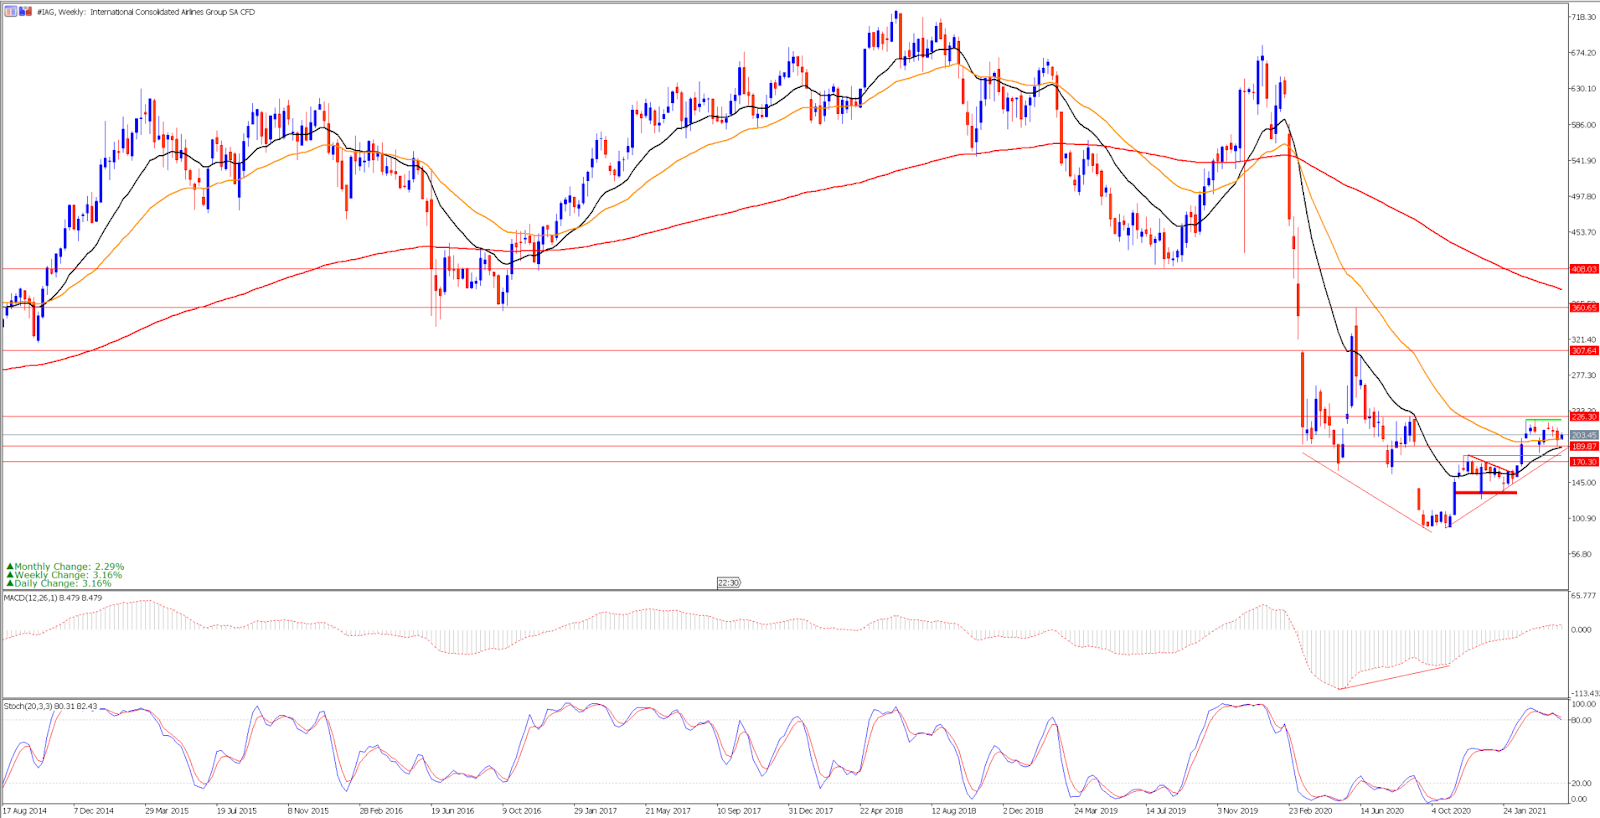
During the last year, it has been punished heavily, recording lows below 90 GBX. But after experiencing a recovery during the month of November the price has moved in a clear uptrend that has been interspersed with two sideways ranges thus fulfilling the bullish divergence that we could see in the weekly chart between the price and its MACD indicator.

Source: Admirals (Formerly Admiral Markets) MetaTrader 5 – IAG Weekly Chart. Date Range: 17 August 2014 – 26 April 2021. Date Captured: 26 April 2021. Past performance is not necessarily an indication of future performance.


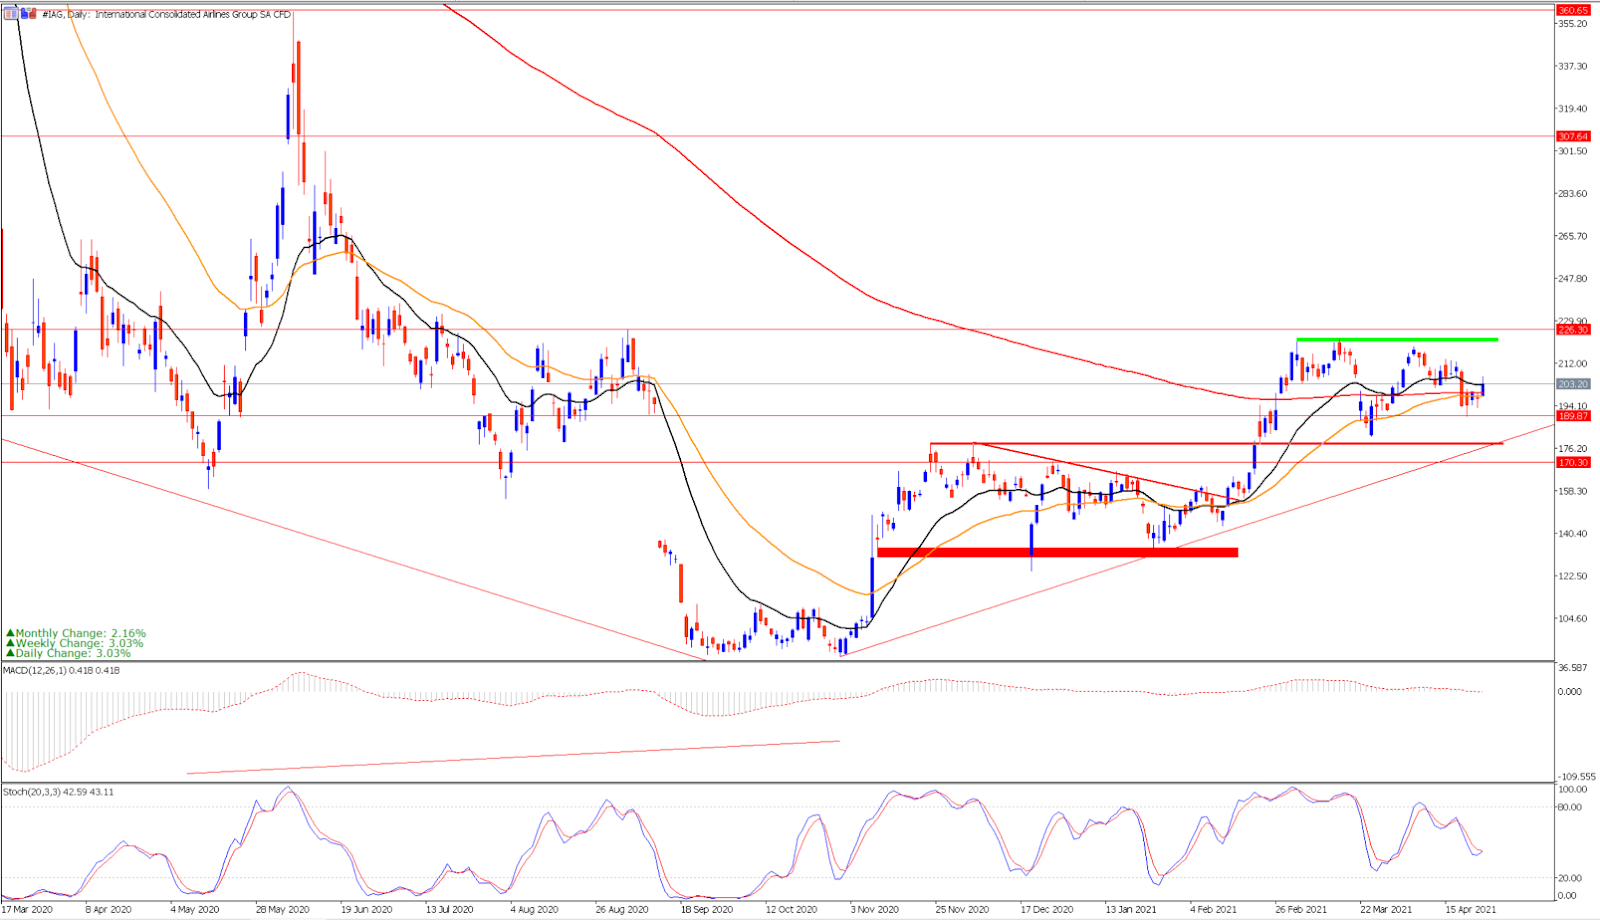
If we focus on the daily chart, we can see that the first of these sideways ranges was overcome in February, when the price was finally able to overcome the upper band of that channel after surpassing the 200 GBX per share and its 200-session average. After that move, the price started another sideways movement between the March highs and the upper band of the previous channel acting as the main support level.

The bullish breakout of this new channel would open the door to a strong upward momentum that could take the price to levels not seen since last summer, thus confirming the change of trend.

Source: Admirals MetaTrader 5 – IAG Daily Chart. Date Range: 17 March 2020 – 26 April 2021. Date Captured: 26 April 2021. Past performance is not necessarily an indication of future performance.

Price evolution of the last five years:

  • 2020: -61.40%
  • 2019: 1.20%
  • 2018: -5.07%
  • 2017: 47.65%
  • 2016: -27.78%


Air France-KLM Analysis

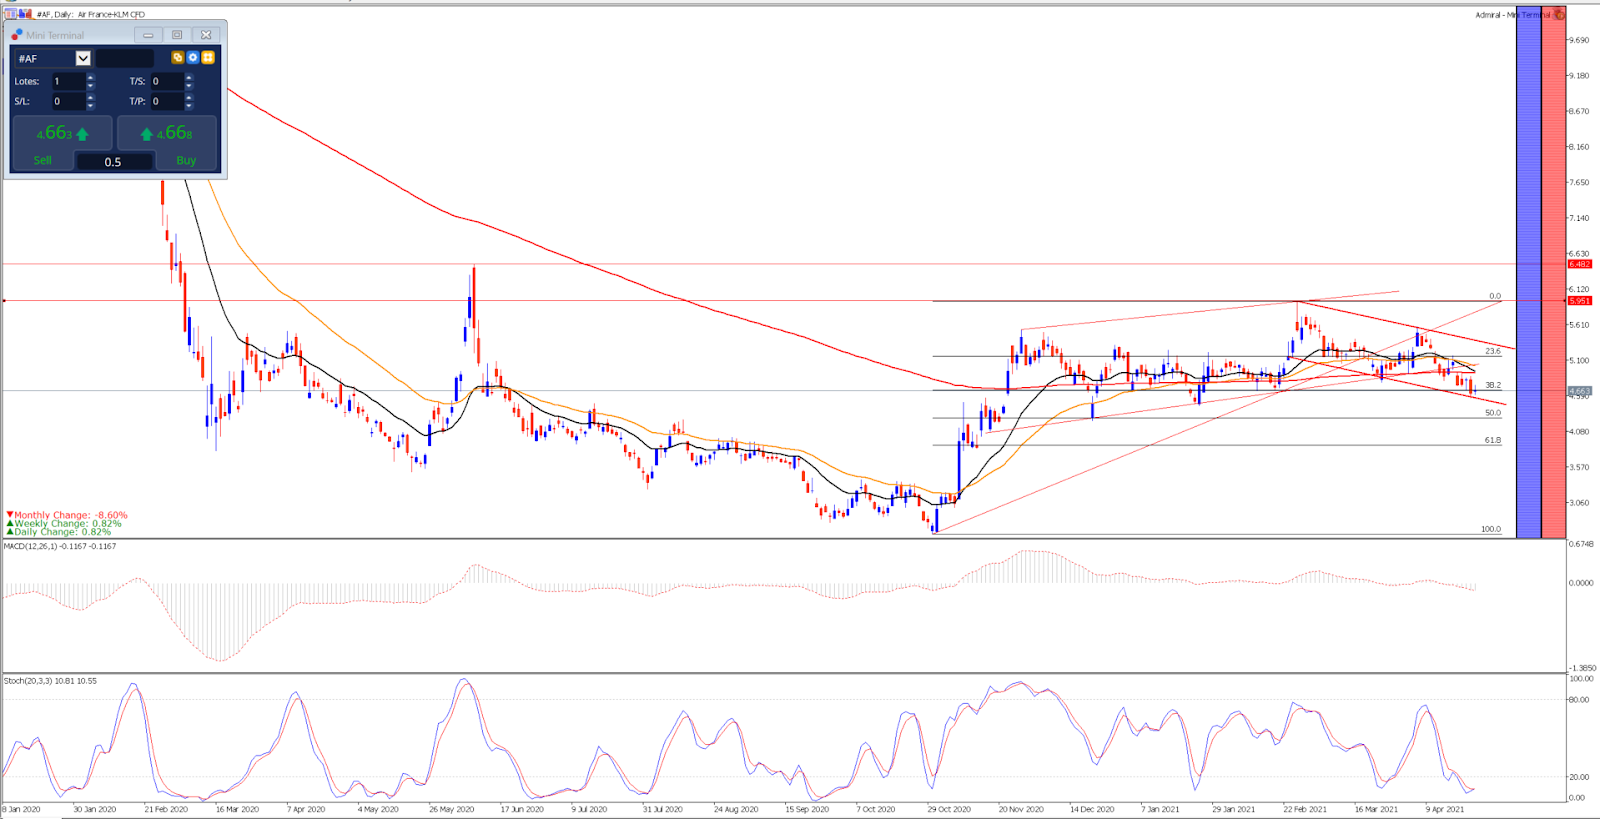
If we look at the daily chart of this company, we can see how, after falling to lows on 30 October, the price began an uptrend that led it to exceed its 200-session average, forming at that time a triangular consolidation formation that led it to mark highs at 5.90 euros per share.

Since then, the price has begun a correction in the form of a bearish channel that has taken it to the 38.2% fibonacci level after breaking below its 200-session average. It is important that we follow the behaviour of this stock and see if it is able to form a new upward momentum from its current levels, recovering its 200-session average that will lead it to break its current channel to the upside, since otherwise, the price could continue its declines to the 50% fibonacci level.

Source: Admirals MetaTrader 5 – Air France-KLM Daily Chart. Date Range: 8 January 2020 – 26 April 2021. Date Captured: 26 April 2021. Past performance is not necessarily an indication of future performance.

Price evolution of the last five years:

  • 2020: -48.41%
  • 2019: 4.68%
  • 2018: -30.19%
  • 2017: 162.47%
  • 2016: -26.30%


Lufthansa Analysis

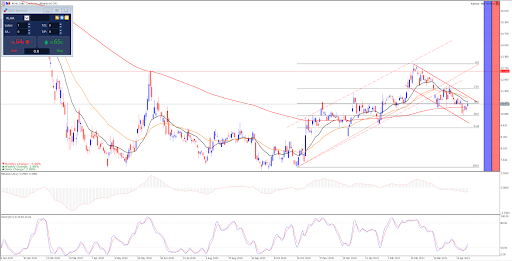
If we focus on Lufthansa, we can observe that last year this company suffered a sharp decline from €15 per share in February 2020 to reach the annual low of around €6.80 per share. During the last quarter, and after the announcements from Pfizer and Moderna regarding their vaccines, the price started an uptrend following a channel formation, which led it to set annual highs in March and almost reach €13 per share.

Since then, the technical situation is very similar to what we have seen in Air France-KLM. The price started a correction following a bearish channel that has taken it to the 50% fibonacci retracement level. As with the previous case, we will have to keep a close eye on its evolution in the coming weeks and see if the price is able to overcome its current channel to the upside, as this breakout would open the doors to a renewed upward momentum to its annual highs.

Source: Admirals MetaTrader 5 – Lufthansa Daily Chart. Date Range: 8 January 2020 – 26 April 2021. Date Captured: 26 April 2021. Past performance is not necessarily an indication of future performance.

Price evolution of the last five years:

  • 2020: -34.10%
  • 2019: -16.70%
  • 2018: -35.87%
  • 2017: 150.36%
  • 2016: -15.75%


Trade CFDs With Admirals

With a Trade.MT5 from Admirals, you can trade Contracts For Difference (CFDs) on IAG, Air France-KLM, Lufthansa and more than 3,300 other shares! CFDs allow traders to speculate on both rising and falling prices, whilst also benefiting from the use of leverage! Click the banner below to open an account today:

Trade Stock CFDs with Admirals

INFORMATION ABOUT ANALYTICAL MATERIALS:

The given data provides additional information regarding all analysis, estimates, prognosis, forecasts, market reviews, weekly outlooks or other similar assessments or information (hereinafter “Analysis”) published on the websites of Admiral Markets investment firms operating under the Admiral Markets trademark (hereinafter “Admiral Markets”) Before making any investment decisions please pay close attention to the following:

  1. This is a marketing communication. The content is published for informative purposes only and is in no way to be construed as investment advice or recommendation. It has not been prepared in accordance with legal requirements designed to promote the independence of investment research, and that it is not subject to any prohibition on dealing ahead of the dissemination of investment research.
  2. Any investment decision is made by each client alone whereas Admiral Markets shall not be responsible for any loss or damage arising from any such decision, whether or not based on the content.
  3. With view to protecting the interests of our clients and the objectivity of the Analysis, Admiral Markets has established relevant internal procedures for prevention and management of conflicts of interest.
  4. The Analysis is prepared by an independent analyst, Roberto Rojas (analyst), (hereinafter “Author”) based on their personal estimations.
  5. Whilst every reasonable effort is taken to ensure that all sources of the content are reliable and that all information is presented, as much as possible, in an understandable, timely, precise and complete manner, Admiral Markets does not guarantee the accuracy or completeness of any information contained within the Analysis.
  6. Any kind of past or modeled performance of financial instruments indicated within the content should not be construed as an express or implied promise, guarantee or implication by Admiral Markets for any future performance. The value of the financial instrument may both increase and decrease and the preservation of the asset value is not guaranteed.
  7. Leveraged products (including contracts for difference) are speculative in nature and may result in losses or profit. Before you start trading, please ensure that you fully understand the risks involved.

By Admiral Markets

Financial Sector Appears Ready To Run Higher

By TheTechnicalTraders 

As we transition into the early Summer months, we are watching how different market sectors are reacting to the continued shifting of capital over the past 60+ days.  One this is very clear, certain market sectors are strengthening while others have run into resistance and are consolidating.  We believe the next few weeks and months will continue this type of trend where capital continues to shift away from risks and into sectors that show tremendous strength and opportunity.

We wrote about how Precious Metals are likely starting a new bullish price trend on April 18, 2021. You can read that research article here: https://www.thetechnicaltraders.com/metals-miners-may-have-started-a-new-longer-term-bullish-trend-part-ii/.

We wrote about how the recent bullish price trend was based on a “wall of worry” and how the markets love to climb higher within this environment on April 14, 2021.  You can read that research article here: https://www.thetechnicaltraders.com/us-equities-climb-a-wall-of-worry-to-new-highs/.

We also published an article on April 11, 2021 suggesting the Cannabis Sector had reached a Pennant Apex and would likely begin a new bullish price trend after some “shakeout” price volatility near the Pennant Apex.  You can read that research article here: https://www.thetechnicaltraders.com/is-the-cannabis-alternative-sector-rally-ready-to-breakout-again/.

XLF May Rally Another 8% – 10% Or More

Today, we are revisiting a recent research article suggesting the Financial Sector may be poised for another rally trend targeting the $38.00 level first, then the $39.40 level based on our research.  The financial sector continues to trend higher after the COVID-19 market collapse.  Global central banks and government policies are very accommodating to stronger earnings and growth in the Financial sector.  Recently, the US Government passed a new COVID stimulus bill that allocates money for at-risk borrowers to help elevate foreclosure actions.

It is very likely that these continued actions to support a stronger US and global recovery will translate into higher price trending in the Financial sector as we move into the Summer months – where weather and Summer activities push people back outside and into more active lifestyles.

Using our Fibonacci Measured Move technique, we have identified a support level in XLF near $34.50.  Therefore, as long as price stays above this level, we believe a continued bullish price trend will push future prices towards the target levels near $38.00, then $39.40. We are watching for the next 0.61% Fibonacci level, near $36.93, to be breached as a sign the bullish price trend is accelerating.

Although the market may appear to be very extended and overbought, we still believe there is room to run for certain market sectors.  XLF, MJ, GDXJ, SILJ, and many others have recently moved into our watchlist for new bullish trends.  Are you ready for profit from these moves?

Identifying the strongest sectors within the current market environment, as well as knowing when price trends generate clear entry triggers, can mean the difference between long-term targeted success and simply guessing at trades.  If you want to take advantage of a strategy that helps you find and execute better market sector trades, then sign up now for my FREE course that teaches you how to find, enter, and profit from only those sectors that have the most strength and momentum.

For those of you who believe in the power of trading sectors that show relative strength and momentum but don’t have the time to do the research every day, let my BAN Trader Pro newsletter service do all the work for you with daily market reports, research, and trade alerts. More frequent or experienced traders have been killing it trading options, ETFs, and stocks using my BAN Hotlist ranking the hottest ETFs, which is updated daily for my BAN Trader Pro subscribers.

Have a great week!

Chris Vermeulen
Founder & Chief Market Strategist

TheTechnicalTraders.com

Market Leverage Reaches New All-Time Highs As The Excess Phase Rally Continues

By TheTechnicalTraders 

– A recent Forbes article highlights the incredible increase in market leverage since the start of the COVID-19 crisis.  There has never been a time in recent history where market leverage has reached these extreme levels.  Additionally, highly leveraged market peaks are typically associated with asset bubbles.

The easy money policies and global central bank actions have prompted one of the longest easy money market rallies in history.  Historically low interest rates, US Federal Reserve and global central bank asset-buying programs, and extended overnight credit support have prompted some traders and investors to move into a more highly leveraged position expecting the rally to stay endless.  Although, the reality of the global market trends may be starting to cause traders and investors to become a bit unsettled.  Precious Metals, Utilities, and Bonds have all started reacting to perceived fear related to this extended bullish rally trend recently.

https://www.forbes.com/sites/greatspeculations/2021/04/24/uh-oh-market-leverage-at-all-time-high/?sh=29eadac1e8a9

My research team and I believe the current market rally will likely continue as capital shifts away from extended market sectors.  We believe the transition away from the new US President and the new policies associated with this change of leadership has already started taking place – which is why Precious Metals, Utilities, and Bonds are starting to trend.  Yet, we believe the momentum behind this current rally is likely to extend through the end of April and into early May 2021.

Custom Volatility Index Shows Bullish Trending & Price Volatility Risks

Our Custom Volatility Index chart, below, shows the US markets have just recently rallied back to previous bullish market trending levels (above 13 on this chart).  Once this Custom Volatility Index reaches these levels, we normally expect two market traits to continue.  First, we expect bullish trending because the Volatility Index above 10~11 strongly suggests an extended bullish trend is in place.  Secondly, we expect moderate price rotation to take place after the Volatility Index reaches levels above 13~14.

It is very common for the Volatility Index to move above the 13~14 level in extended rally trends.  Yet, it is also common for the markets to rotate or retrace after reaching these levels.  Therefore, this Custom Volatility Index chart shows the US markets have moved into extreme bullish price trending and has already reached a peak level near 15 – which suggests we can expect some moderate price rotation within the next 3 to 5+ weeks.

Be sure to sign up for our free market trend analysis and signals now so you don’t miss our next special report!

Whenever the US major indexes trend higher in longer-term extended trends, the Custom Volatility Index typically stays above 10~11 and continually attempts to rally above 12~13.  The “Peak Volatility Channel” on this chart highlights areas of extreme peaks in the markets.  When the Custom Volatility Index reaches this level, price becomes more likely to rotate or retrace a bit before attempting to move higher.

Smart Cash Index Shows Global Markets Need To Break Above 210 TO Begin A New Rally Phase

Our following Custom Smart Cash Index shows the global markets have been struggling to move higher over the past few months.  Even though the US markets have attempted to rally to new highs, the Smart Cash Index chart shows this recent rally has not been seen in the global markets.

My team and I believe the next rally phase in the markets must initiate with the Smart Cash Index chart rallying above 210 and representing a moderately strong global market push higher throughout the May/June 2021 time span.  If the Smart Cash Index fails to move above the 210 price level, the we believe a moderate price correction may be setting up for May or June 2021 where the US markets may move moderately lower, attempting to retest recent support, then begin another rally attempt.

Currently, the global stock market and financial system leverage may be an unknown catalyst for some type of future market movements.  The Forbes article suggests these new all-time high leverage levels are likely the result of global central bank policies where traders and investors believe the central banks will continue to support the markets indefinitely.  As much as we would like to think this may be the case, the reality is that, at some point, normalization will take place in the global markets and that presents an ominous deleveraging event in the future.

We are watching how the market’s sectors are shifting trends and how some of the strongest sectors are shifting and weakening over the past 60+ days.  For example, the Russell 2000 had been one of the strongest market sectors up until about 2 months ago.  Now it appears to be trading in a sideways trend – attempting to move back into a bullish price trend.

Our research team believes traders and investors need to be prepared for quickly shifting sector trends over the next 6+ months as this highly leveraged global market event plays out.  Our research suggests a price rotation event is near and the global markets are still trending in a moderately strongly bullish trend. The strongest sectors are going to continue to be the best performers over time.  Being able to identify and trade these sectors is key to being able to efficiently target profits.  You can learn more about how I identify and trade these sectors by registering for my FREE course here.

For those who believe in the power of trading on relative strength, market cycles, and momentum but don’t have the time to do the research every day then my BAN Trader Pro newsletter service does all the work for you with daily market reports, research, and trade alerts. More frequent or experienced traders have been killing it trading options, ETFs, and stocks using my BAN Hotlist ranking the hottest ETFs, which is updated daily for my premium subscribers.

Enjoy the rest of your Sunday!

Chris Vermeulen
Founder & Chief Market Strategist

TheTechnicalTraders.com

Forex Technical Analysis & Forecast 26.04.2021

Article By RoboForex.com

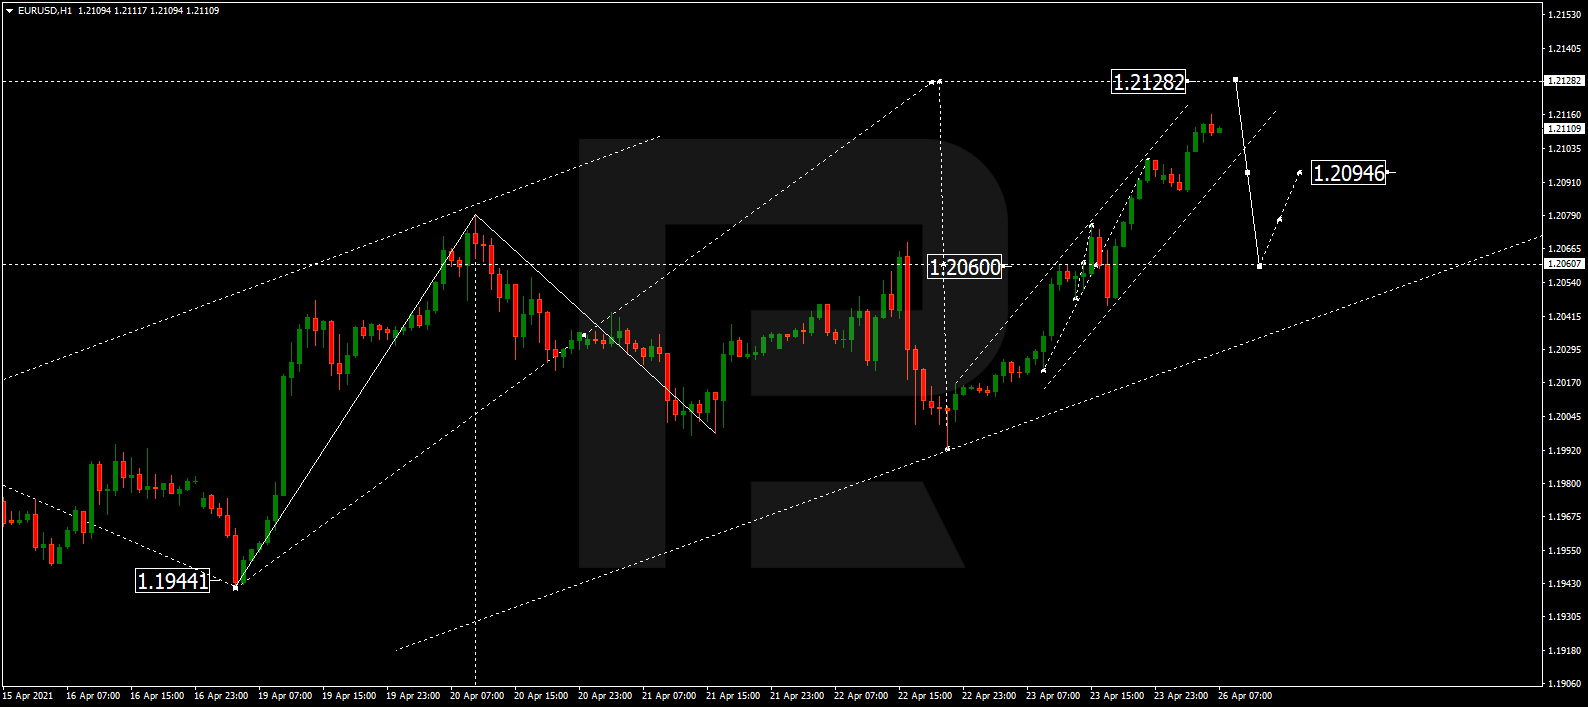
EURUSD, “Euro vs US Dollar”

After breaking 1.2060 to the upside, EURUSD is moving upwards and may expand the range up to 1.2128. Later, the market may start a new correction to return to 1.2060.

EURUSD
Risk Warning: the result of previous trading operations do not guarantee the same results in the future

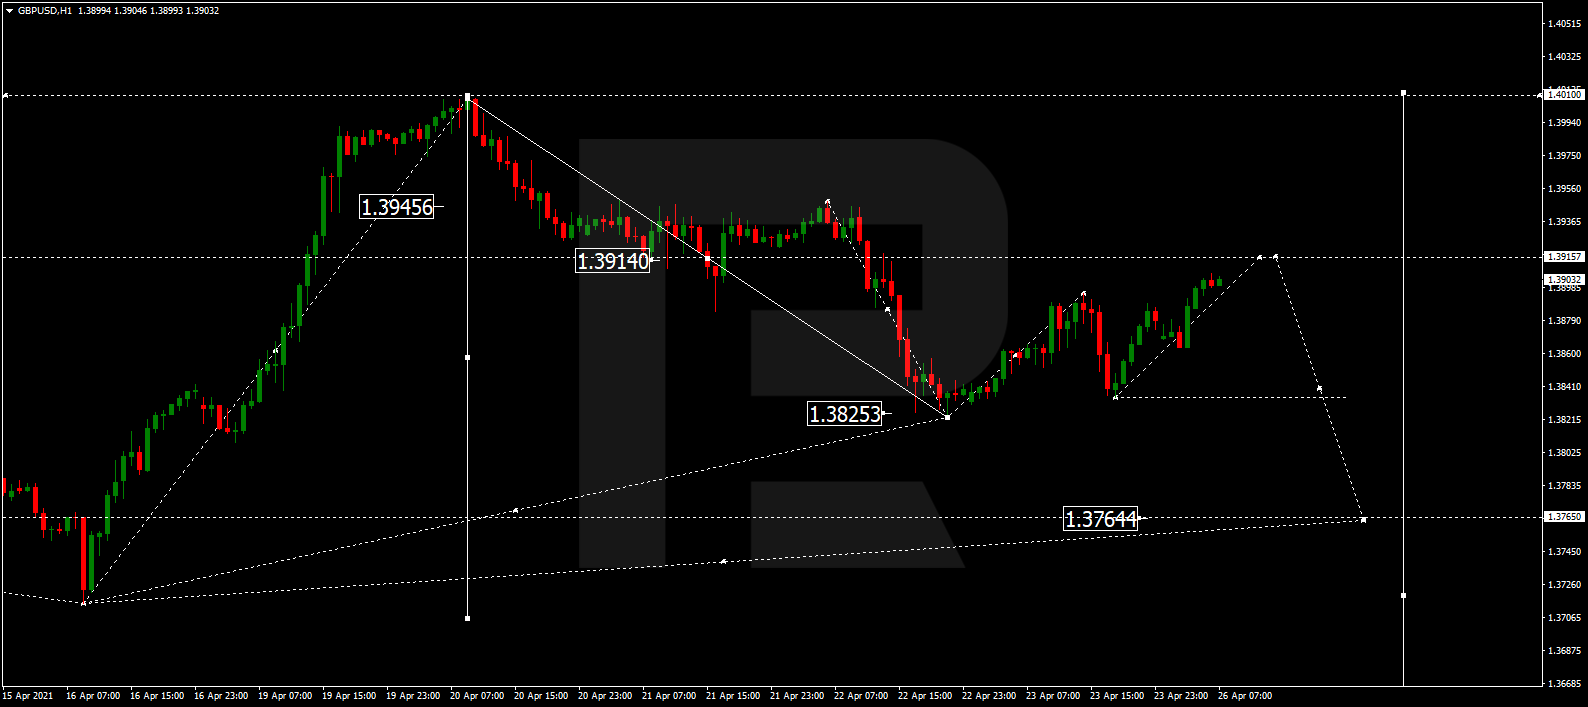
GBPUSD, “Great Britain Pound vs US Dollar”

GBPUSD is correcting towards 1.3915 and may later fall to reach 1.3841. If the price breaks this range to the downside, the market may resume falling towards 1.3764; if to the upside – continue the correction with the target at 1.4010.

GBPUSD
Risk Warning: the result of previous trading operations do not guarantee the same results in the future

USDRUB, “US Dollar vs Russian Ruble”

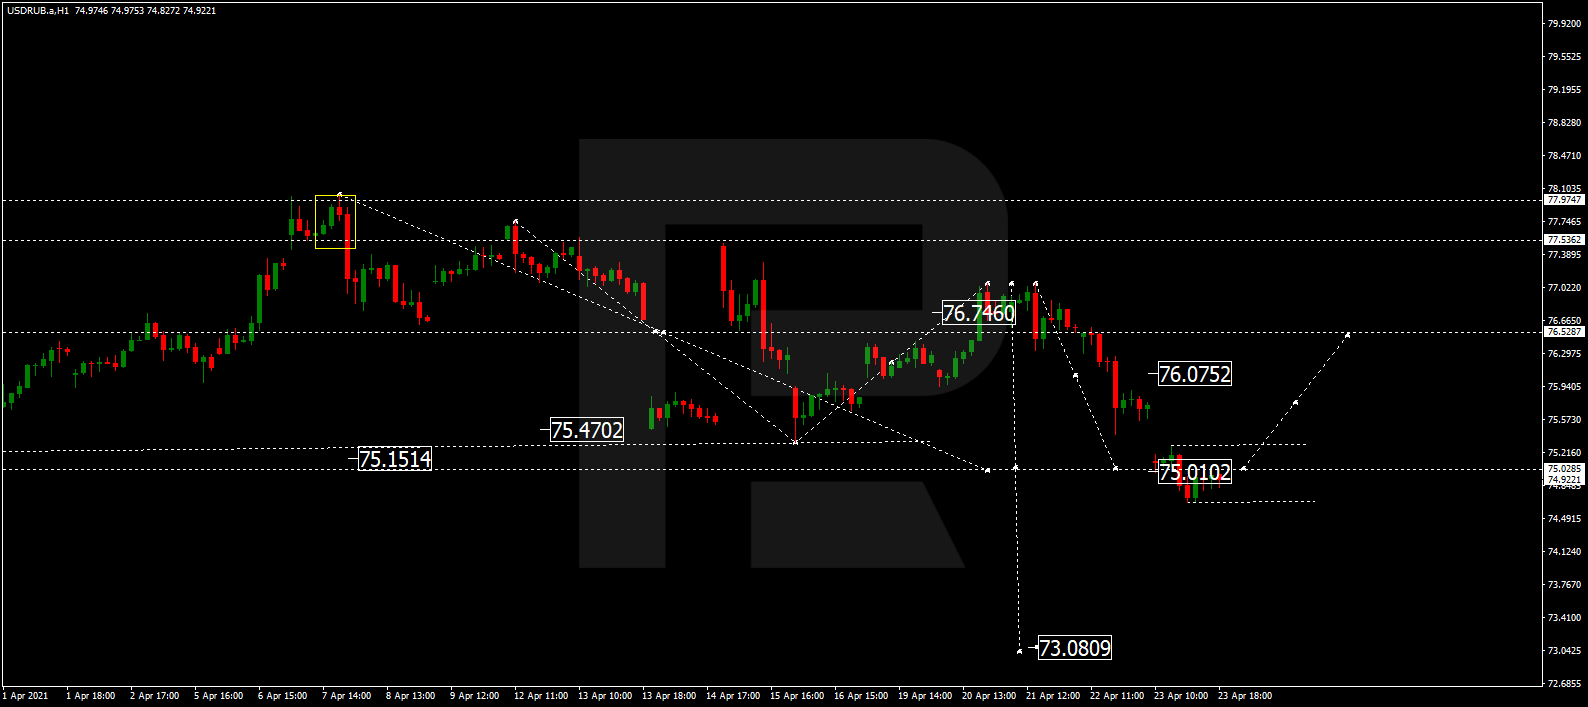
After completing the descending wave at 75.00, USDRUB is consolidating around this level. If the price breaks this range to the upside, the market may correct towards 76.50; if to the downside – form a new descending structure with the target at 73.08.

USDRUB
Risk Warning: the result of previous trading operations do not guarantee the same results in the future

USDJPY, “US Dollar vs Japanese Yen”

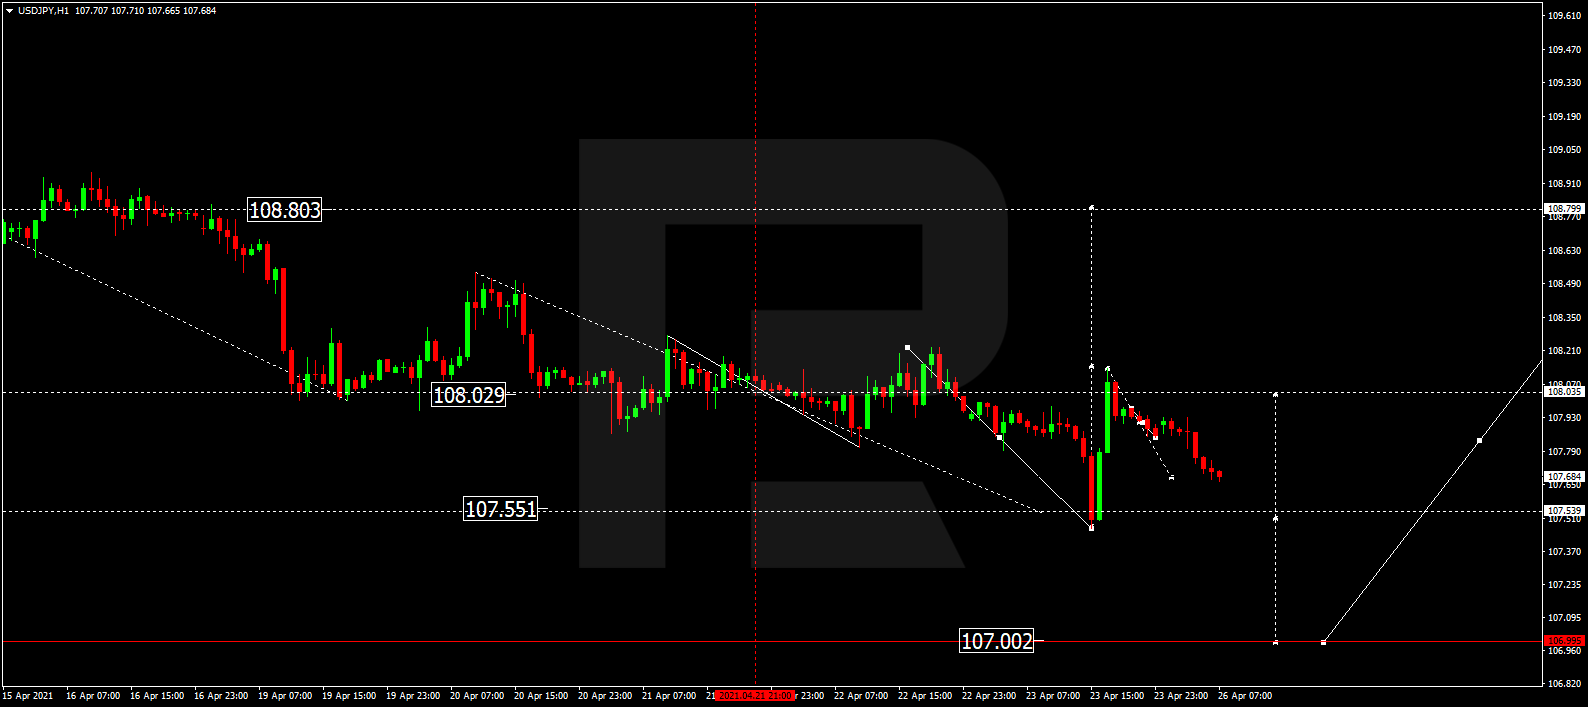
After finishing the descending wave at 107.55 along with the ascending impulse towards 108.08, USDJPY is correcting to reach 107.70. If the price breaks this range to the upside, the market may resume growing towards 108.80; if to the downside – start a new decline with the target at 107.00.

USDJPY
Risk Warning: the result of previous trading operations do not guarantee the same results in the future

USDCHF, “US Dollar vs Swiss Franc”

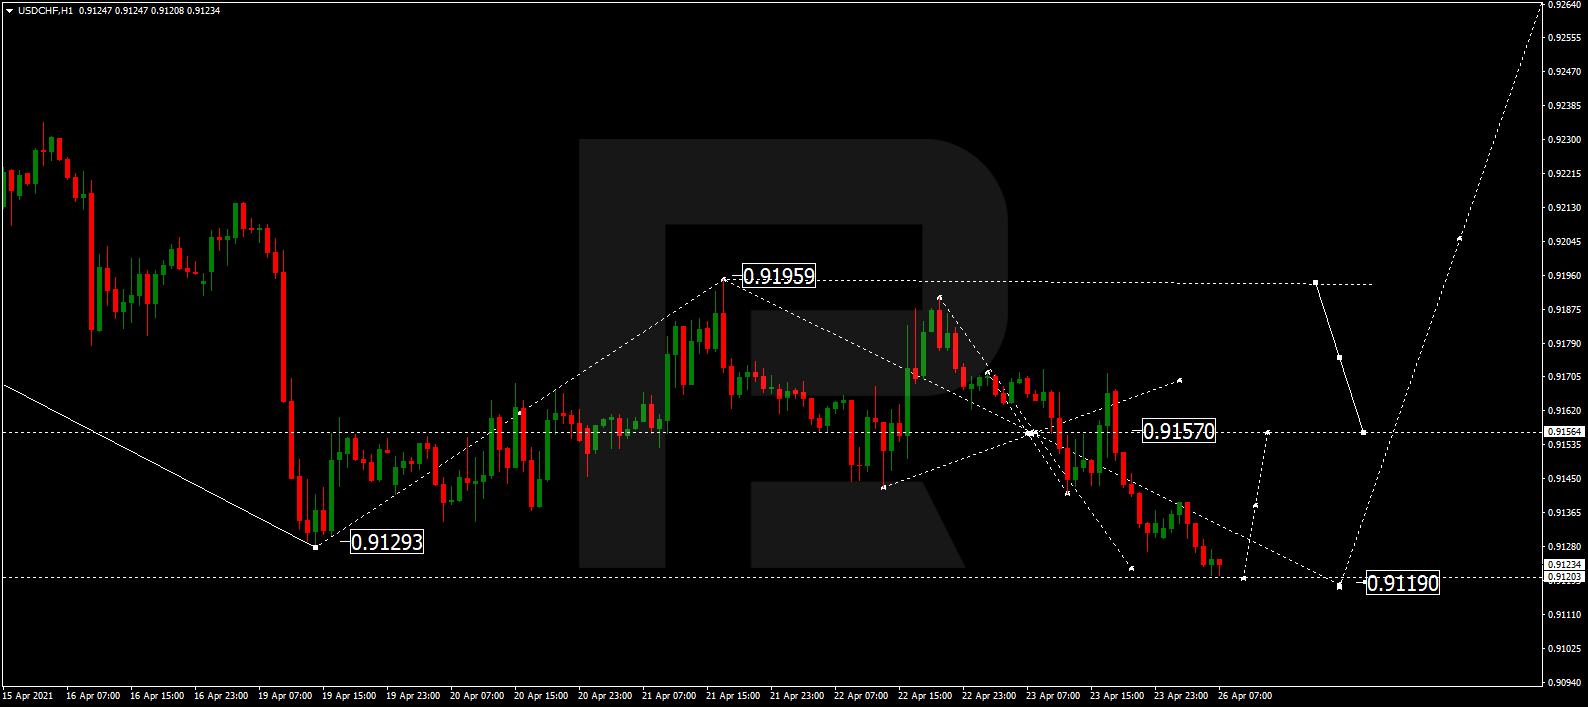
USDCHF is still consolidating around 0.9157; it has already expanded the range down to 0.9119. Possibly, today the pair may grow and break 0.9170 and then continue growing with the target at 0.9191.

USDCHF
Risk Warning: the result of previous trading operations do not guarantee the same results in the future

AUDUSD, “Australian Dollar vs US Dollar”

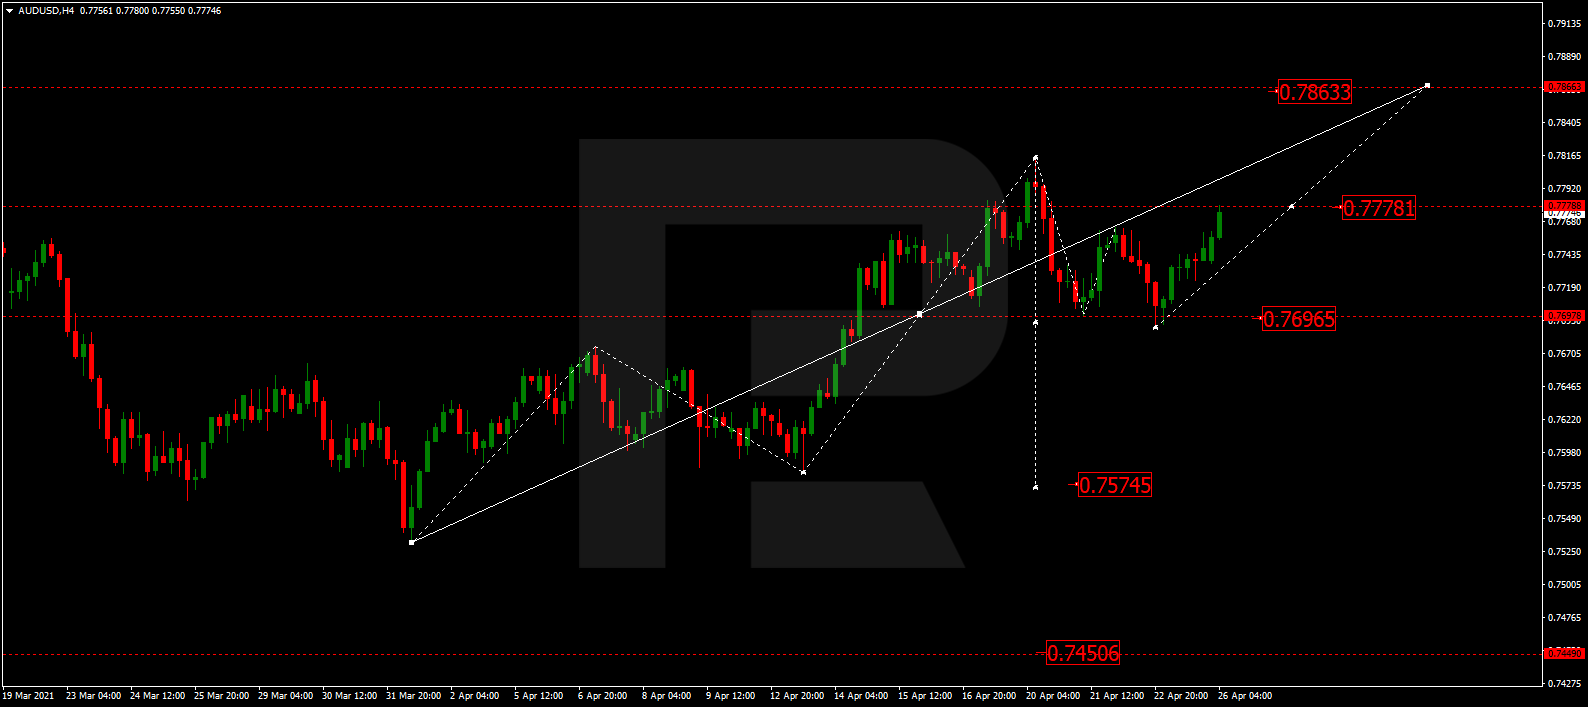
After rebounding from 0.7696, AUDUSD is growing towards 0.7777. Possibly, the pair may break the latter level to the upside and continue the correction to reach 0.7863. Later, the market may resume trading downwards with the target at 0.7696.

AUDUSD
Risk Warning: the result of previous trading operations do not guarantee the same results in the future

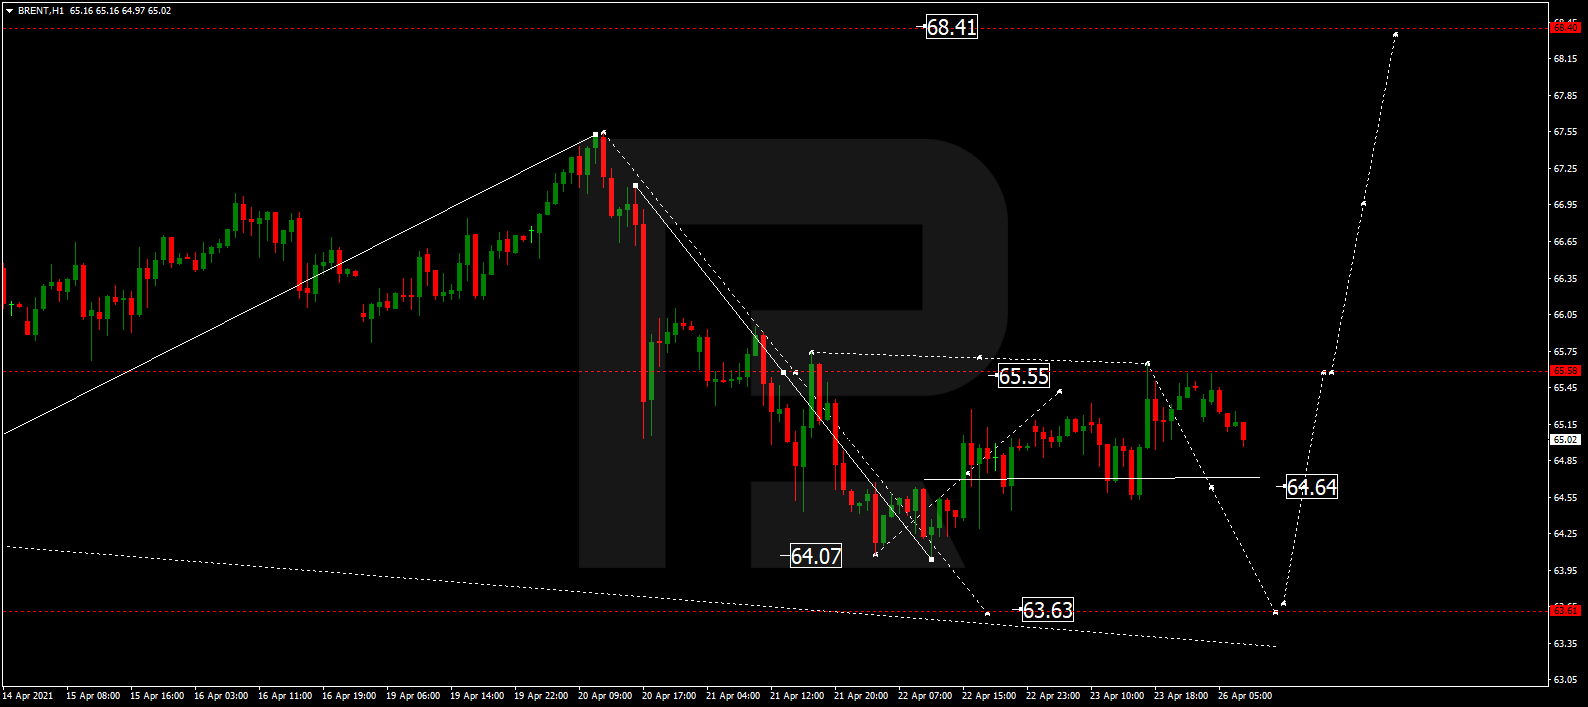
BRENT

Brent has finished the ascending structure at 65.55; right now, it is falling towards 64.64. Possibly, the asset may break this level to the downside and continue the correction to reach 63.63. After that, the instrument may start a new growth with the target at 68.40.

BRENT
Risk Warning: the result of previous trading operations do not guarantee the same results in the future

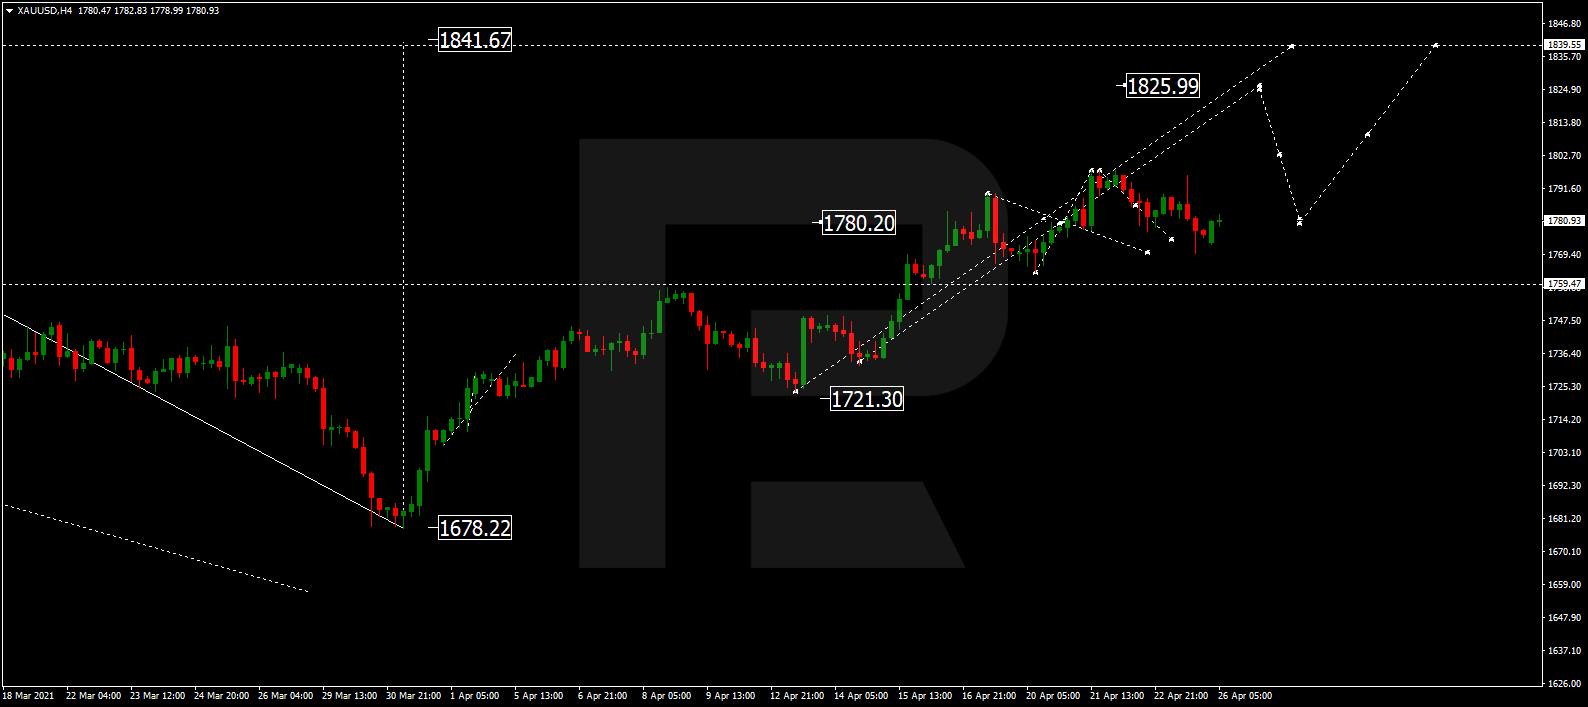
XAUUSD, “Gold vs US Dollar”

Gold is still consolidating around 1780.20. Possibly, the metal may break this range to the upside and resume trading within the uptrend towards 1825.99 or even reach the short-term 1840.00.

GOLD
Risk Warning: the result of previous trading operations do not guarantee the same results in the future

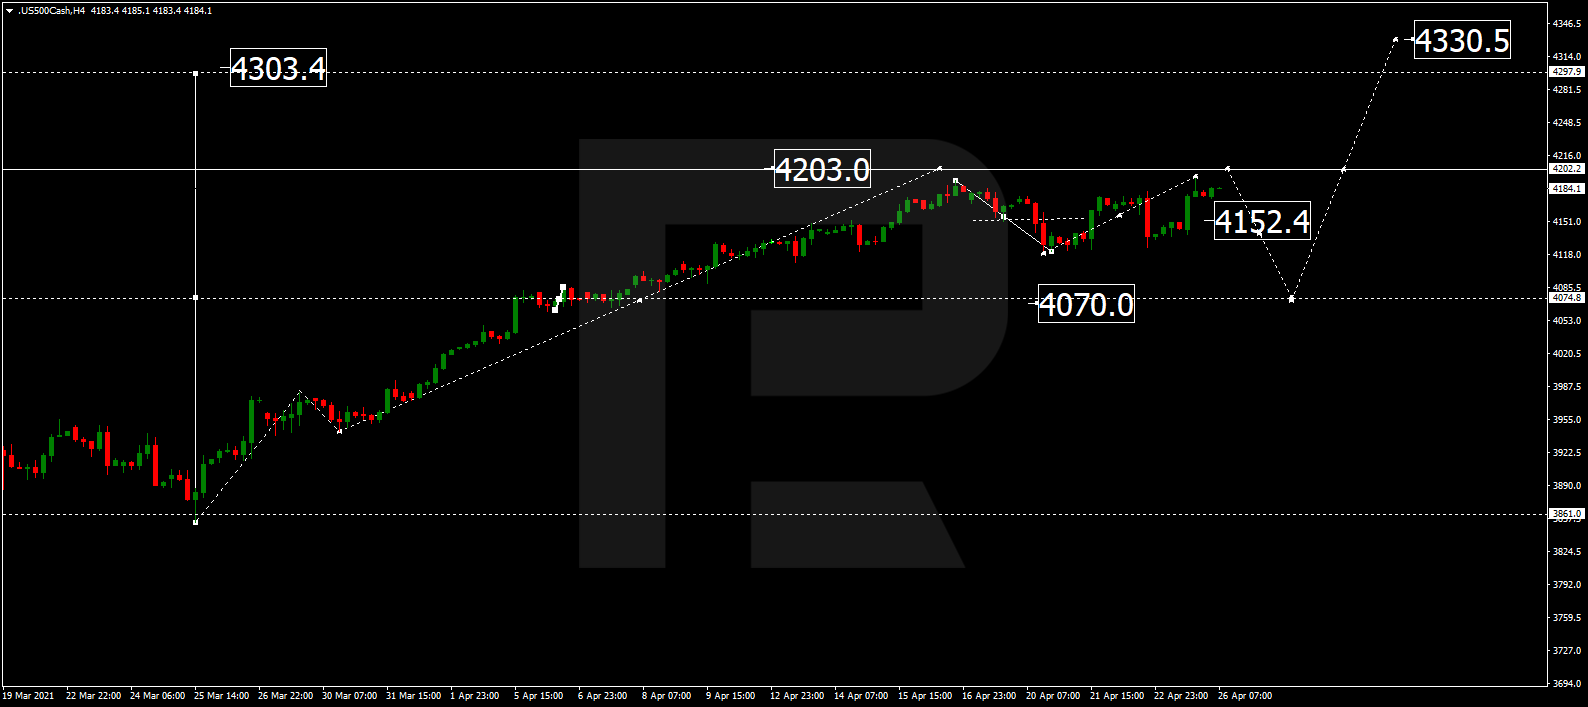
S&P 500

The S&P index is still consolidating around 4152.4. Today, the asset may expand the range up to 4203.0 and then start a new correction towards 4070.0. Later, the market may form one more ascending structure with the target at 4330.5.

S&P 500

Article By RoboForex.com

Attention!
Forecasts presented in this section only reflect the author’s private opinion and should not be considered as guidance for trading. RoboForex LP bears no responsibility for trading results based on trading recommendations described in these analytical reviews.

Ichimoku Cloud Analysis 26.04.2021 (AUDUSD, CADCHF, XAGUSD)

Article By RoboForex.com

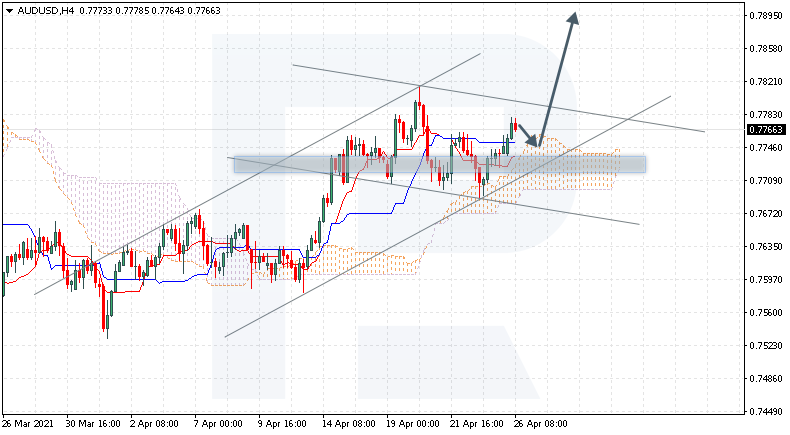
AUDUSD, “Australian Dollar vs US Dollar”

AUDUSD is trading at 0.7766; the instrument is moving above Ichimoku Cloud, thus indicating an ascending tendency. The markets could indicate that the price may test the cloud’s upside border at 0.7745 and then resume moving upwards to reach 0.7895. Another signal in favor of a further uptrend will be a rebound from the support level. However, the bullish scenario may no longer be valid if the price breaks the cloud’s downside border and fixes below 0.7665. In this case, the pair may continue falling towards 0.7575. To confirm further growth, the asset must break the descending channel’s upside border and fix above 0.7805.

AUDUSD
Risk Warning: the result of previous trading operations do not guarantee the same results in the future

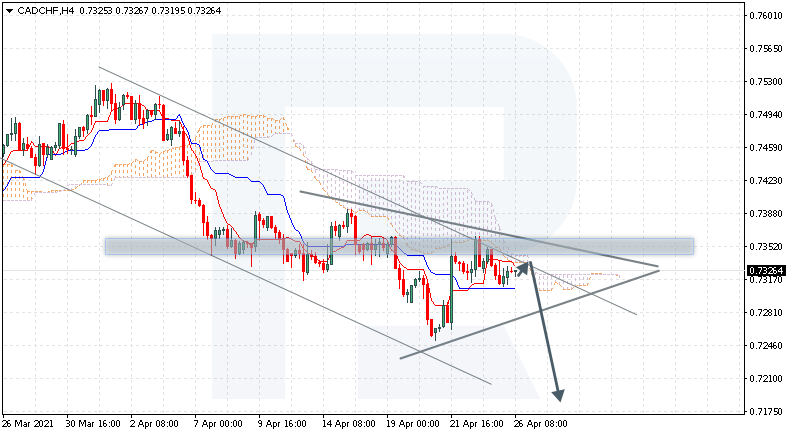
CADCHF, “Canadian Dollar vs Swiss Franc”

CADCHF is trading at 0.7326; the instrument is moving below Ichimoku Cloud, thus indicating a descending tendency. The markets could indicate that the price may test the cloud’s downside border at 0.7330 and then resume moving downwards to reach 0.7180. Another signal in favor of a further downtrend will be a rebound from the descending channel’s upside border. However, the bearish scenario may no longer be valid if the price breaks the cloud’s upside border and fixes above 0.7365. In this case, the pair may continue growing towards 0.7455. To confirm further decline, the asset must break the downside border of a Triangle pattern and fix below 0.7245.

CADCHF
Risk Warning: the result of previous trading operations do not guarantee the same results in the future

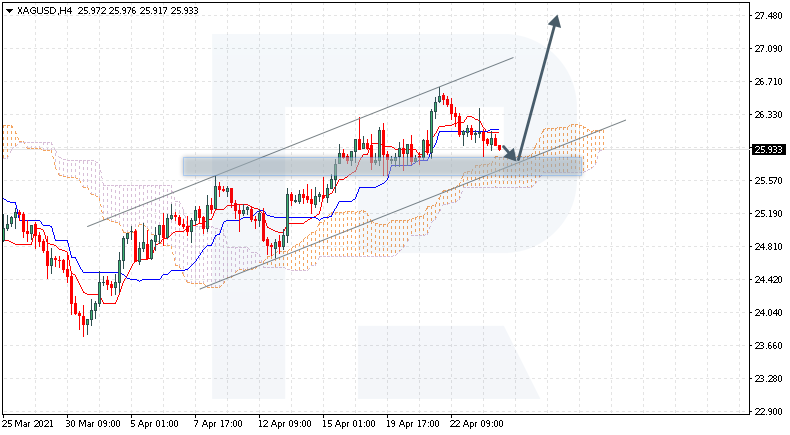
XAGUSD, “Silver vs US Dollar”

XAGUSD is trading at 25.93; the instrument is moving above Ichimoku Cloud, thus indicating an ascending tendency. The markets could indicate that the price may test the cloud’s upside border at 25.85 and then resume moving upwards to reach 27.50. Another signal in favor of a further uptrend will be a rebound from the rising channel’s downside border. However, the bullish scenario may no longer be valid if the price breaks the cloud’s downside border and fixes below 25.15. In this case, the pair may continue falling towards 24.25.

XAGUSD

Article By RoboForex.com

Attention!
Forecasts presented in this section only reflect the author’s private opinion and should not be considered as guidance for trading. RoboForex LP bears no responsibility for trading results based on trading recommendations described in these analytical reviews.

Major investors and hedge funds remain bullish on US indices

by JustForex

On Thursday, despite the fact that the stock market fell by an average of 1% concerning the news on Biden’s plans to raise the capital gains tax, the market rebounded very strongly on Friday, showing that investors continue to believe in rising indices. Also, the S&P 500 index was able to update its historical maximum.

Last week, oil prices fell sharply because of the news that the U.S. is drafting an anti-trust bill against OPEC. The U.S. government does not like OPEC’s restrictions on oil production. The price was decreased by 3% concerning the news on the huge imbalance of aggressive selling. And if the price goes below 60.50 (CL futures), the oil local downtrend is likely to continue. The OPEC+ meeting is expected to take place this week, and it will probably determine the oil’s fate, whether the uptrend in oil will continue or not.

Asia-Pacific stock markets closed Friday’s trading with upward movement, reacting optimistically to Chinese President Xi Jinping’s ecology-related statements. But Japan’s index declined because of the expectations of new “coronavirus” economic losses.

Main market quotes:

S&P 500 (F) 4,180.17 +45.19 (+1.09%)

Dow Jones 34,043.49 +227.59 (+0.67%)

DAX 15,279.62 -40.90 (-0.27%)

FTSE 100 6,938.56 +0.32 (+0.0046%)

USD Index 90.76 -0.1 (-0.11%)

Important events:
  • – US Core Durable Goods Orders at 15:30 (GMT+3).

by JustForex


This article reflects a personal opinion and should not be interpreted as an investment advice, and/or offer, and/or a persistent request for carrying out financial transactions, and/or a guarantee, and/or a forecast of future events.

The Analytical Overview of the Main Currency Pairs on 2021.04.26

by JustForex

The EUR/USD currency pair

Technical indicators of the currency pair:
  • Prev Open: 1.2014
  • Prev Close: 1.2097
  • % chg. over the last day: +0.69%

On Friday EUR/USD closed the day with +0.69%. One of the main reasons for that raise was positive data on German PMI. On the H1 and H4 timeframes the price is above the moving average, the MACD is in the positive zone, and local trend line also indicates an up-trend.

Trading recommendations
  • Support levels: 1.2075, 1.2049, 1.1994, 1.1957
  • Resistance levels: 1.2109, 1.2176, 1.2212, 1.2243

On the last trading day of last week the EUR/USD currency pair showed a good upward impulse movement, which indicates the strength of buyers. The priority remains upward, but the price is in front of the resistance level, so the recommendation is to look for entry buy points after pullback to the nearest support levels.

Alternate scenario: if the price breaks down through the 1.2049 level and holds below, with a high probability the price can go down to 1.1994, thereby forming a flat with the range of 1.1994-1.2075.

EUR/USD
There is no news feed for today.

The GBP/USD currency pair

Technical indicators of the currency pair:
  • Prev Open: 1.3834
  • Prev Close: 1.3874
  • % chg. over the last day: +0.29%

On Friday, the GBP/USD currency pair was trading in a relatively wide range 1.3835-1.3894. On the 4H chart, the price tested the moving average without a breakdown, which indicates the presence of buyers and protection of the support level. However on the H1, the moving average was broken on both sides, which is a sign of sideways movement. But today in the Asian session the local downtrend line was broken, which indicates local bullish pressure.

Trading recommendations
  • Support levels: 1.3835, 1.3794, 1.3756, 1.3690
  • Resistance levels: 1.3894, 1.3944, 1.3996, 1.4149

The priority remains upward. The price broke up the 1.3894 resistance and helds above the local downtrend line. On a pullback to the broken level, it is possible to look for buy trades.

Alternative scenario: if the price breaks down through the support level of 1.3835 and consolidates below it, with a high probability the price will go to 1.3756 for the test. Going below 1.3756 would cancel the bullish scenario.

GBP/USD
There is no news feed for today.

The USD/JPY currency pair

Technical indicators of the currency pair:
  • Prev Open: 107.92
  • Prev Close: 107.86
  • % chg. over the last day: -0.01%

Friday’s daily candlestick on the USD/JPY currency pair closed with a large tail down, and that indicated a sharp rejection of the price and the buyers initiative. Also don’t forget about the divergence in the MACD indicator. But on the H4 and H1, the price is still below the moving average. Also the lows and the highs are going down, and there is a downward channel.

Trading recommendations
  • Support levels: 107.47, 107.04, 105.92
  • Resistance levels: 108.19, 108.54, 109.36

The priority is still downward, but there are already the first signs of a reversal. But as long as there is no breakout of the nearest resistance level, it is better to continue open sell positions.

Alternative scenario: if the price breaks out and holds above 108.19, a local up-trend might be formed for at least a week.

USD/JPY
There is no news feed for today.

The USD/CAD currency pair

Technical indicators of the currency pair:
  • Prev Open: 1.2504
  • Prev Close: 1.2474
  • % chg. over the last day: -0.24%

Same as on Thursday, the USD/CAD currency pair continued to trade in a narrow range. On the H1 and H4, the price is still below the moving average, and inside the day sales impulse prevailed. The priority remains bearish, but there are small buyers pressure from the lower border of the flat, alse there is a hidden divergence on the MACD on H1.

Trading recommendations
  • Support levels: 1.2460, 1.2435, 1.2379
  • Resistance levels: 1.2509, 1.2519, 1.2574

The priority is still down, but the best way to sell is to wait for a pullback to the broken 1.2460 support level, which can now act as resistance or look to sell from the upper boundary of the range from the 1.2509 level.

Alternative scenario: if the price breaks out and holds above 1.2509, a local up-trend might be formed for at least a week.

USD/CAD
There is no news feed for today.

by JustForex


This article reflects a personal opinion and should not be interpreted as an investment advice, and/or offer, and/or a persistent request for carrying out financial transactions, and/or a guarantee, and/or a forecast of future events.

US equity futures edge higher in a busy week for Wall Street

By Hussein Sayed Chief Market Strategist (Gulf & MENA), ForexTime

Concerns about the Covid situation, a potential hike in US capital gains tax and overstretched valuations were some of the reasons for the bumpy performance last week on Wall Street. Still, the S&P 500 index managed to close near its record highs as corporate earnings and economic data reassured investors that equities remain the best option for growing wealth. Futures today are indicating a slightly positive start for the S&P 500 and Dow Jones Industrial Average, while the Nasdaq composite is lagging.

In terms of last week’s economic data, the flash reading of the IHS Market US composite PMI rose to a record 62.2 in April from 59.7 in March and new home sales surged 20.7% last month to the highest level since 2006. The US economy is clearly firing on all cylinders with a Federal Reserve unwilling to withdraw support any time soon. That’s what we are likely to hear from Fed Chair Jerome Powell on Wednesday following a two-day FOMC policy meeting,

The US central bank is comfortable with the idea of inflation rising above 2% for some time until a wide-ranging recovery is achieved. So do not expect the Fed to scale back its bond-purchasing program or signal policy tightening in the near term despite the robust economic recovery. This will continue to be a positive factor for equities even though valuations may seem stretched.

On the earnings front, 84% of S&P 500 companies who have reported results for Q1 2021 have managed to beat analyst’s estimates despite the bar rising over the past several weeks. Earnings for tech giants Alphabet, Microsoft, Apple, Facebook and Amazon are all due this week. If the earnings surprises continue at such a magnitude, I wouldn’t be surprised to see another record high on the S&P 500, especially if US Treasury yields remain within this month’s trading range.

In currency markets, the dollar continues to underperform its major peers in what has been a poor start to the second quarter, after an exceptional performance at the beginning of the year. The dollar index is now flirting with the uptrend trajectory from January and a break below may signal further weakness from a technical perspective. Traders seem to believe that Europe and Asia will play catch up with the US and close the gap in terms of economic performance later this year.

The euro, Swiss franc and New Zealand dollar have all climbed more than 3% month-to-date against the greenback, and this week’s US GDP report and Federal Reserve meeting should provide traders some guidance.

Disclaimer: The content in this article comprises personal opinions and should not be construed as containing personal and/or other investment advice and/or an offer of and/or solicitation for any transactions in financial instruments and/or a guarantee and/or prediction of future performance. ForexTime (FXTM), its affiliates, agents, directors, officers or employees do not guarantee the accuracy, validity, timeliness or completeness, of any information or data made available and assume no liability as to any loss arising from any investment based on the same.


Forex-Time-LogoArticle by ForexTime

ForexTime Ltd (FXTM) is an award winning international online forex broker regulated by CySEC 185/12 www.forextime.com
Key events this week: Big earnings for Big Tech?

By Han Tan, Market Analyst, ForexTime

There’s a lot happening this week, especially on the US earnings front:

Monday, April 26

  • Tesla earnings (after US markets close)

Tuesday, April 27

  • Bank of Japan rate decision
  • Alphabet earnings (after US markets close)
  • Microsoft earnings (after US markets close)

Wednesday, April 28

  • US President Biden addresses joint Congress
  • Fed rate decision
  • ECB President Christine Lagarde speech
  • OPEC+ meeting
  • Apple earnings (after US markets close)
  • Facebook earnings (after US markets close)

Thursday, April 29

  • Amazon earnings (after US markets close)
  • Twitter earnings (after US markets close)
  • US Q1 GDP, weekly jobless claims

Friday, April 30

  • China PMI
  • Eurozone GDP, CPI, unemployment
  • US personal income/spending, consumer sentiment

As I had mentioned last Thursday:

“Corporate guidance for earnings growth over the coming weeks is likely to have an influential role in determining whether US stocks can roar higher. Investors want to ascertain whether earnings prospects are bullish enough to warrant another leg higher for US indices, and whether the Q1 performance has justified recent gains.”

The same will be applicable for these Big Tech stocks that are scheduled to unveil their latest quarterly earnings this week.

Note that Tesla, Alphabet, Microsoft, Apple, Facebook, and Amazon have a combined market cap of about $9 trillion. That’s more than half of the total value of the Nasdaq 100 index, which has a market cap of nearly $16 trillion. Hence, how these stocks move could have an outsized impact on the tech-heavy index this week. At present, markets are pricing in an average single-day move of 4% in either direction for each of these six stocks once US markets resume trading after their respective earnings releases.

A notedly optimistic earnings outlook from these tech behemoths could spur the Nasdaq 100 onto a new record high, considering that the index itself is less than one percent away from beating its 16 April peak.

Meanwhile, the futures contract is now edging its way back towards the 14,000 mark.

Amidst all these headline-grabbing earnings releases, Joe Biden is also set to address Congress for the first time as the President of the United States. As he unveils more details about his ambitious spending plans, investors would also be anxiously awaiting details about how it would be funded.

There’s been media reports last week about a doubling of the capital gains tax, adding to the proposed corporate tax hike announced earlier this month.

And with Big Tech companies front and center of the taxman’s sights, more of such details released this week could drag US tech stocks lower.


FXTM Social Media index to cross 700 and hit new record high this week?

This index is evenly weighted between its 4 constituents, namely Facebook, Alphabet, Twitter, and Snapchat. Note that Snapchat already released its latest quarterly earnings after US markets closed on Thursday, 22 April. This social media company reported better-than-expected surges in its revenue and daily active users, which grew 66% and 22% year-on-year respectively.

Such a performance pushed Snap’s share price up by 7.45% on Friday alone, which ended a losing streak for the 5 consecutive sessions prior.

Friday’s surge in Snap’s stocks helped propel the FXTM Social Media index to its highest ever closing price before the weekend.

Positive guidance out of Facebook, Alphabet, and Twitter this week might see the FXTM Social Media index push above the psychologically-important 700 line before it reaches overbought territory.

However, should markets be grossly disappointed either by the latest quarterly results or what management has to say about the coming quarters, that could deflate this index until it tests its 50-day simple moving average as a support level once more. The 610-640 range may also prove to be a key area of interest to the downside.


Disclaimer: The content in this article comprises personal opinions and should not be construed as containing personal and/or other investment advice and/or an offer of and/or solicitation for any transactions in financial instruments and/or a guarantee and/or prediction of future performance. ForexTime (FXTM), its affiliates, agents, directors, officers or employees do not guarantee the accuracy, validity, timeliness or completeness, of any information or data made available and assume no liability as to any loss arising from any investment based on the same.


Forex-Time-LogoArticle by ForexTime

ForexTime Ltd (FXTM) is an award winning international online forex broker regulated by CySEC 185/12 www.forextime.com