Fibonacci Retracements Analysis 28.04.2021 (GBPUSD, EURJPY)

Article By RoboForex.com

GBPUSD, “Great Britain Pound vs US Dollar”

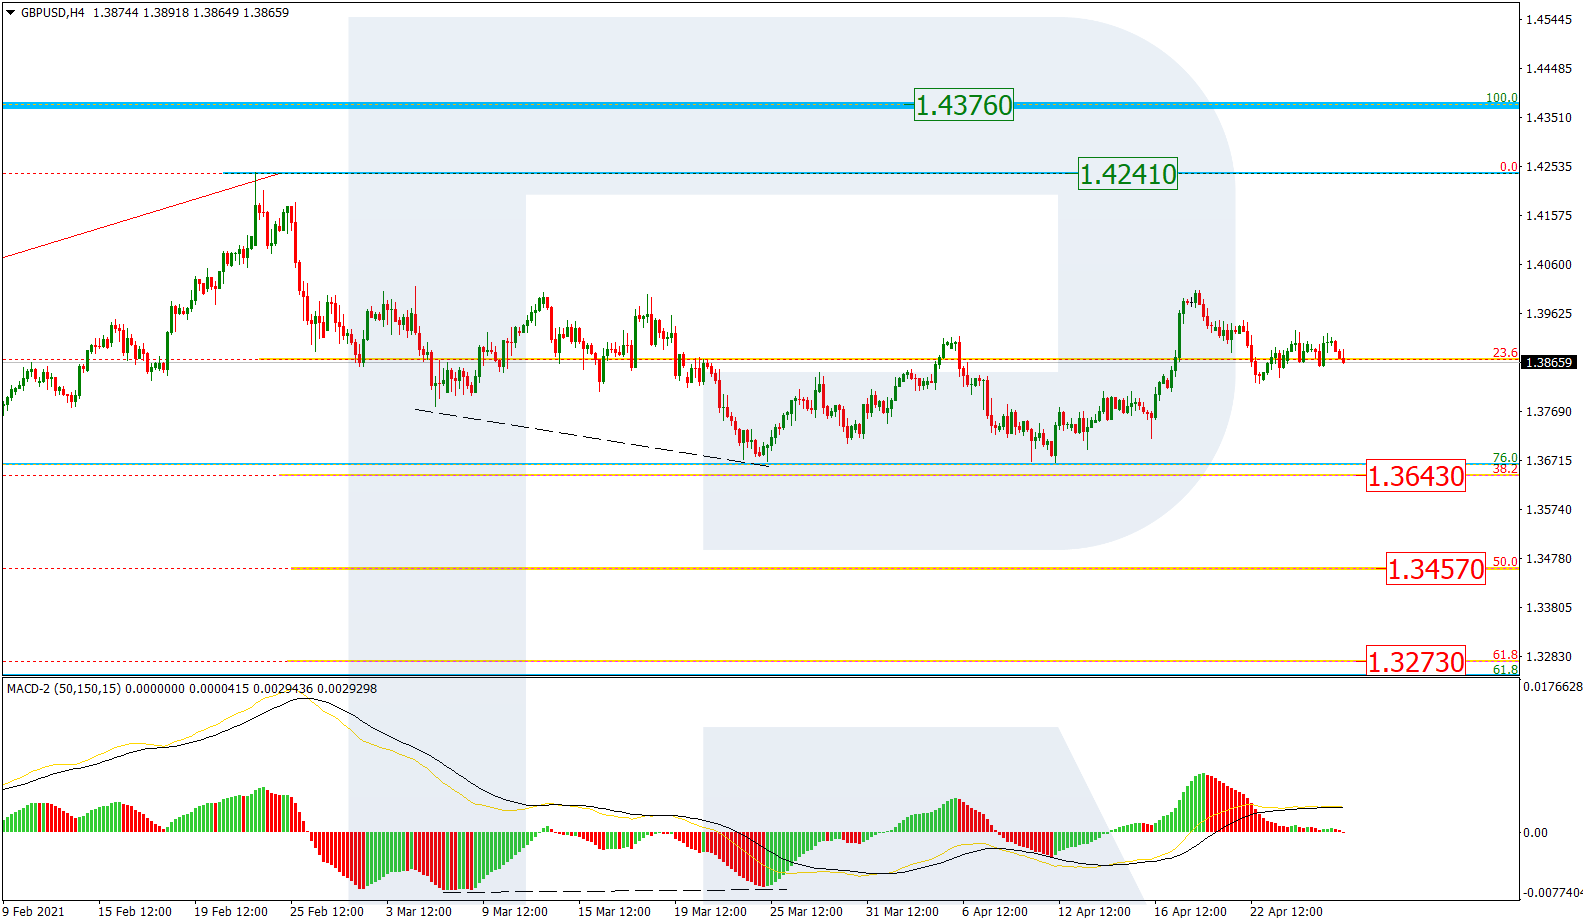
In the H4 chart, the technical situation hasn’t changed much as GBPUSD is still testing the mid-term 23.6% fibo. In addition to that, the pair has failed to reach both the local and key (1.4241) highs, which means that the asset is about to start another wave to the downside. the closest target may be 38.2% fibo at 1.3643, while the next ones – 50.0% and 61.8% fibo at 1.3457 and 1.3237 respectively.

GBPUSD_H4
Risk Warning: the result of previous trading operations do not guarantee the same results in the future

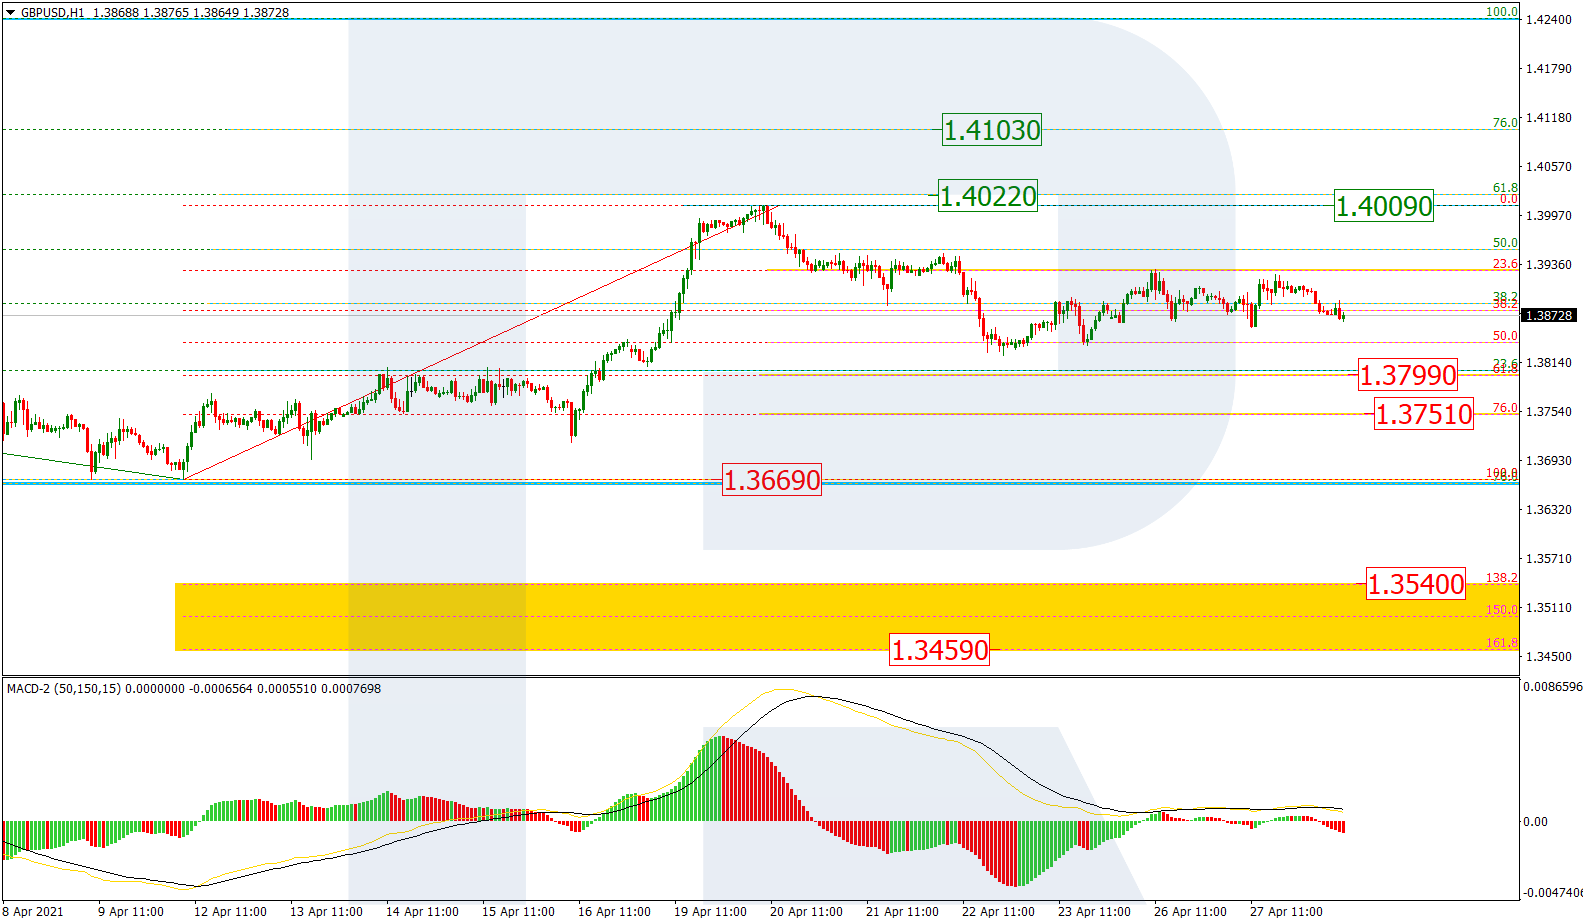
The H1 chart shows that after correcting to the upside and reaching 61.8% fibo at 1.4022, the asset couldn’t test or break it. Also, there was a local divergence on MACD, which made the pair start a new decline. By now, this descending wave has tested 50.0% fibo twice, while the next one may reach 61.8% and 76.0% fibo at 1.3799 and 1.3751 respectively. A breakout of the low at 1.3669 may lead to a further mid-term downtrend towards the post-correctional extension area between 138.2% and 161.8% fibo at 1.3540 and 1.3459 respectively.

GBPUSD_H1
Risk Warning: the result of previous trading operations do not guarantee the same results in the future

EURJPY, “Euro vs. Japanese Yen”

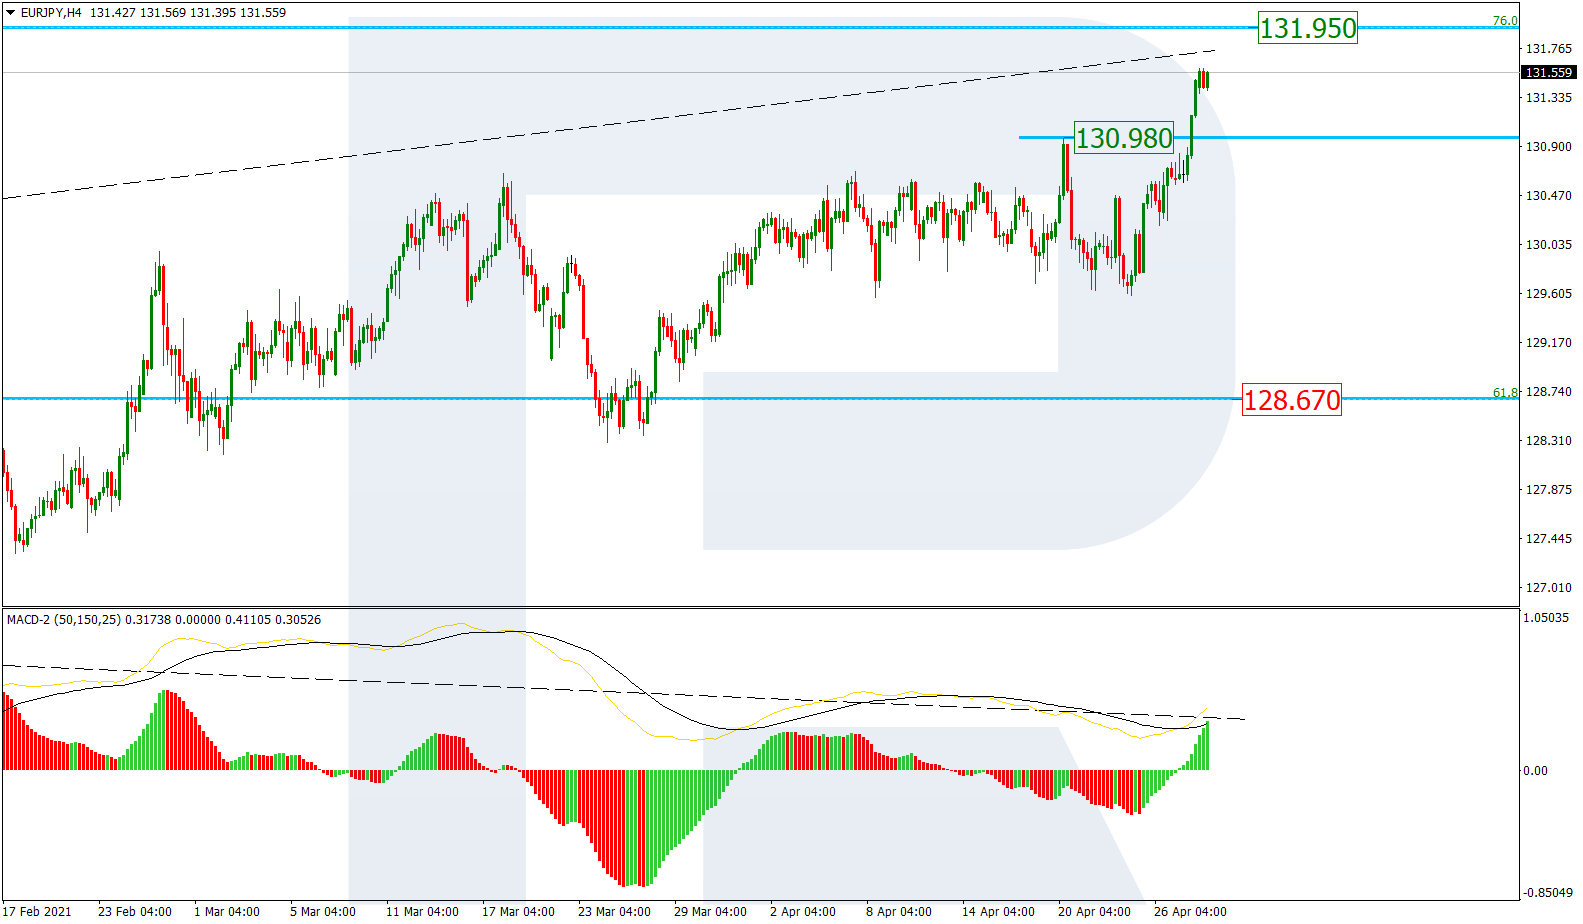
In the H4 chart, a previous divergence couldn’t force the asset to fall, so the pair, after breaking the high at 130.98, is heading to reach the long-term 76.0% fibo at 131.95. However, this is another divergence on MACD, so the instrument should be ready for a new correction towards the local support at 61.8% fibo (128.67).

EURJPY_H4
Risk Warning: the result of previous trading operations do not guarantee the same results in the future

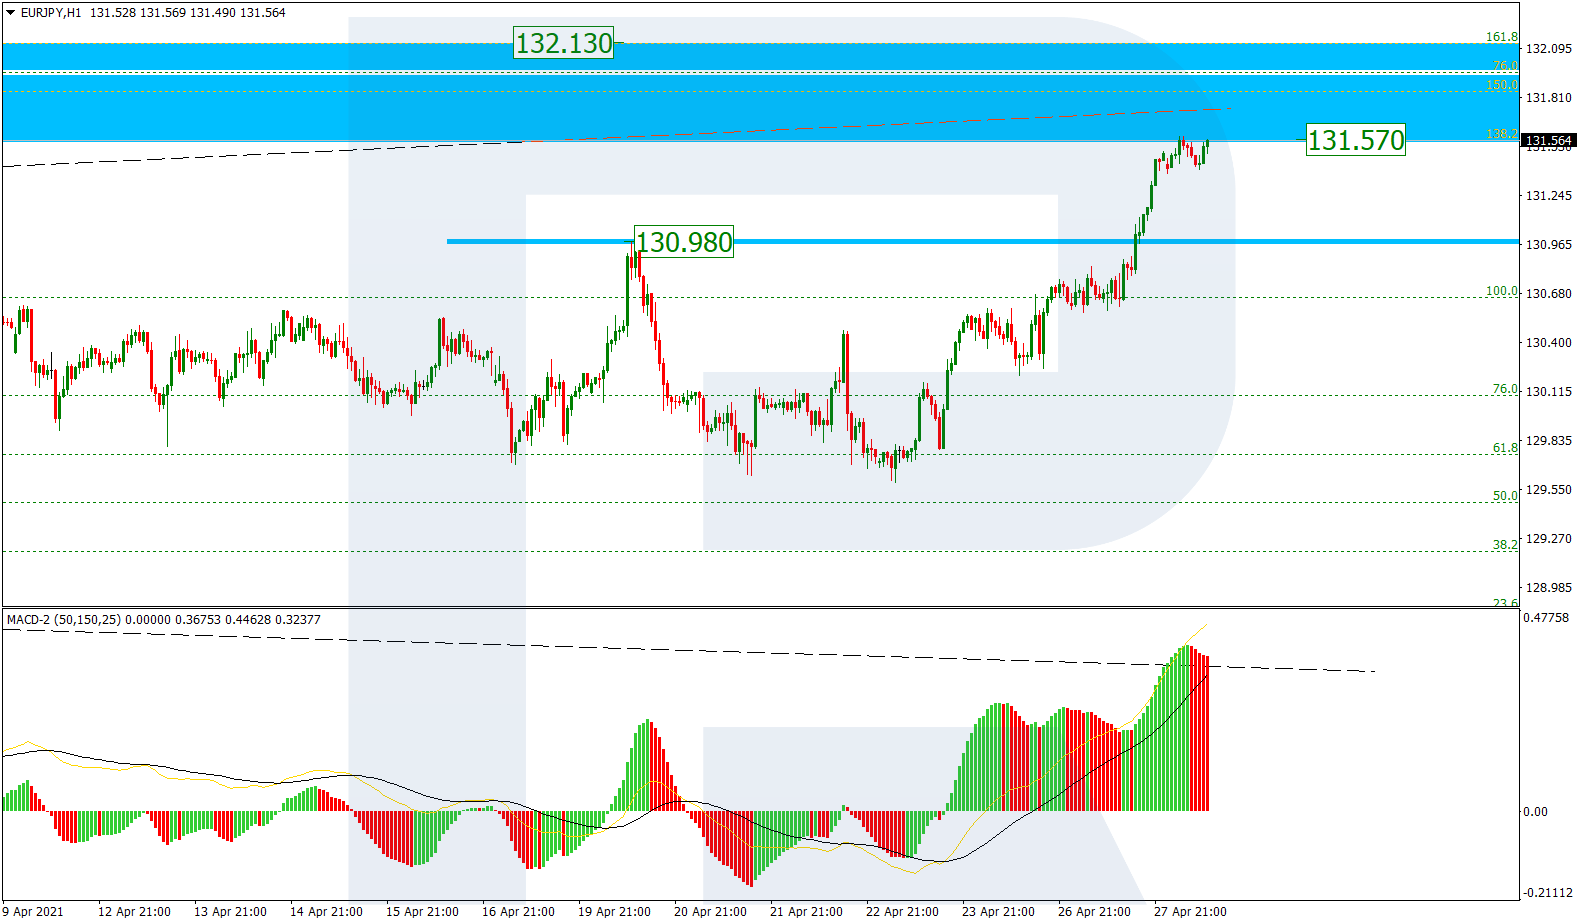
The H1 chart shows a further uptrend towards the post-correctional extension area between 138.2% and 161.8% fibo at 131.57 and 132.13 respectively.

EURJPY_H1

Article By RoboForex.com

Attention!
Forecasts presented in this section only reflect the author’s private opinion and should not be considered as guidance for trading. RoboForex LP bears no responsibility for trading results based on trading recommendations described in these analytical reviews.

The Analytical Overview of the Main Currency Pairs on 2021.04.28

by JustForex

The EUR/USD currency pair

Technical indicators of the currency pair:
  • Prev Open: 1.2084
  • Prev Close: 1.2091
  • % chg. over the last day: +0.05%

On Tuesday, the EUR/USD currency pair was trading in a relatively narrow range. Sellers are actively defending the level of 1.2088, but taking into account the fact that the price broke through the local downtrend line by the impulse candles, there is little chance that this level will be held.

Trading recommendations
  • Support levels: 1.2049, 1.1994, 1.1957
  • Resistance levels: 1.2109, 1.2176, 1.2212, 1.2243

The uptrend remains bullish. The price is above the moving average and the MACD in the positive area. The best strategy for EUR/USD would be looking for buy positions from the nearest support levels. It is best to work on intraday timeframes because volatility is low before the news.

Alternative scenario: if the price breaks down through the 1.2049 level and holds below, with a high probability, the price can go down to 1.1994, thereby forming a flat with the range of 1.1994-1.2075.

EUR/USD
News feed for 2021.04.28:
  • – ECB President Christine Lagarde Speaks at 17:00 (GMT+3);
  • – FOMC Rate Decision at 21:00 (GMT+3);
  • – FOMC Press Conference at 21:30 (GMT+3).

The GBP/USD currency pair

Technical indicators of the currency pair:
  • Prev Open: 1.3889
  • Prev Close: 1.3907
  • % chg. over the last day: +0.01%

Buyers are actively defending the 1.3864 support level. This level coincides with the dynamic moving average, which adds more strength to it. The trend remains bullish without any signs of a reversal.

Trading recommendations
  • Support levels: 1.3864, 1.3835, 1.3794, 1.3756, 1.3690
  • Resistance levels: 1.3944, 1.3996, 1.4149

The strategy for the GBP/USD currency pair remains unchanged. Traders should look for long positions from the support levels. The nearest target, where the price is likely to go, is the 1.3944 resistance level.

Alternative scenario: if the price breaks down the support level 1.3864 and holds below, the price will go to test the 1.3794 level. Moving below 1.3794 will temporarily cancel the bullish scenario on the current timeframe.

GBP/USD
News feed for 2021.04.28:
  • – ECB President Christine Lagarde Speaks at 17:00 (GMT+3);
  • – FOMC Rate Decision at 21:00 (GMT+3);
  • – FOMC Press Conference at 21:30 (GMT+3).

The USD/JPY currency pair

Technical indicators of the currency pair:
  • Prev Open: 108.06
  • Prev Close: 108.73
  • % chg. over the last day: +0.6%

After activating the alternative scenario, the USD/JPY pair moved into a local uptrend, which is growing into a full uptrend and may change the overall priority. The price broke through the moving average and held above it, while the MACD is in the positive zone without any signs of divergence.

Trading recommendations
  • Support levels: 108.54, 108.19,107.77, 107.47, 107.04, 105.92
  • Resistance levels: 109.04, 109.36

The price is forming a well-defined upward channel. The best strategy in these market conditions is to buy from an upward trend line within the channel, as well as from the support levels. The nearest target is the resistance level of 109.04, but if the growth dynamics remain bullish, it is likely to be broken through.

Alternative scenario: if the price drops below 108.19 again, with a high probability, the general downtrend will continue.

USD/JPY
News feed for 2021.04.28:
  • – ECB President Christine Lagarde Speaks at 17:00 (GMT+3);
  • – FOMC Rate Decision at 21:00 (GMT+3);
  • – FOMC Press Conference at 21:30 (GMT+3).

The USD/CAD currency pair

Technical indicators of the currency pair:
  • Prev Open: 1.2393
  • Prev Close: 1.2400
  • % chg. over the last day: +0.01%

On Tuesday, the USD/CAD currency pair was trading in a narrow flat. This often happens after an impulsive move. The trend remains bearish, but the MACD has begun to show the first signs of divergence.

Trading recommendations
  • Support levels: 1.2379, 1.2280
  • Resistance levels: 1.2431, 1.2488, 1.2519, 1.2574

The strategy for the USD/CAD pair is to wait for this narrow flat to be broken in one of the directions. But taking into account the general context, it is best to look for short positions, because the support level has not been reached yet.

Alternative scenario: if the price breaks out and holds above 1.2509, a local up-trend might be formed for at least a week.

USD/CAD
News feed for 2021.04.28:
  • – Retail Sales at 15:30 (GMT+3);
  • – ECB President Christine Lagarde Speaks at 17:00 (GMT+3);
  • – FOMC Rate Decision at 21:00 (GMT+3);
  • – FOMC Press Conference at 21:30 (GMT+3).

by JustForex


This article reflects a personal opinion and should not be interpreted as an investment advice, and/or offer, and/or a persistent request for carrying out financial transactions, and/or a guarantee, and/or a forecast of future events.

Markets are paralyzed ahead of a two-day meeting of the Federal Open Market Committee (FOMC)

by JustForex

Strong reports from major U.S. companies are pushing indices higher. But the market is showing low volatility as investors took a temporary pause after a proposal from Joe Biden to raise taxes on corporations and individuals last week.

The ECB released macroeconomic statistics on the change in assets on its balance sheet. The numbers have increased by more than 4 times, which is the highest growth rate in the last month. This scenario may have a negative impact on the euro, since the more money is printed, the cheaper the national currency is.

OPEC+ representatives started talking about a possible increase in oil supply, despite the growth of COVID-19 cases in India and Latin America. The oil price continued to rise on Tuesday, adding 0.82%. Crude Oil Inventories report is expected today, which may have a significant impact on the price change.

Asian stock markets are showing mixed dynamics. China’s index CSI 300 increased by 0.26% while Japan’s Nikkei decreased by 0.46%.

Boeing, Shopify, Facebook, Spotify, Qualcomm, eBay, Apple and Teva are reporting for Q1 2021 today.

Main market quotes:

S&P 500 (F) 4,186.72 -0.90 (-0.02%)

Dow Jones 33,984.93 +3.36 (+0.01%)

DAX 15,249.27 -47.07 (-0.31%)

FTSE 100 6,944.97 -18.15 (-0.26%)

USD Index 90.88 +0.07 (+0.08%)

Important events:
  • – Canada Retail Sales at 15:30 (GMT+3);
  • – ECB President Christine Lagarde Speech at 17:00 (GMT+3);
  • – Crude Oil Stocks at 17:30 (GMT+3);
  • – FOMC Interest Rate Decision at 21:00 (GMT+3);
  • – FOMC Press Conference at 21:30 (GMT+3).

by JustForex


This article reflects a personal opinion and should not be interpreted as an investment advice, and/or offer, and/or a persistent request for carrying out financial transactions, and/or a guarantee, and/or a forecast of future events.

Earnings Preview: Facebook In Focus

By Lukman Otunuga Research Analyst, ForexTime

Our earnings spotlight shines on Facebook which is scheduled to report first-quarter earnings after US markets close on Wednesday.

Despite regulatory pressure and lingering anti-trust threats, the social-media juggernaut is expected to report another stunning quarterly result this evening.

Such an outcome may boost confidence over the business outlook and possibly elevate Facebook shares which are up over 11% year-to-date. 

Given the optimism over a global economic recovery and countries across the world easing lockdown restrictions, the Q1 earnings will certainly be one of Facebook’s most significant in years.

Market expectations: EPS & Earnings

According to Bloomberg, adjusted earnings per share (EPS) stand around $2.61 per share on $23.72 billion in revenues for Q1 2021.

For a full year, EPS are projected at $12.80 while full-year revenues are seen hitting roughly $108.11 billion – marking a 25.8% increase from 2020.

Interestingly, monthly active users are forecast to hit 2.83 billion which is roughly 36% of the world population. Investor sentiment towards Facebook may brighten if the revenues and EPS meet or exceed forecasts.

What to expect?

The hot topic is privacy. Apple plans to change to its iOS 14 software which forces iPhone users to approve Facebook collecting their data.

If Facebook users on iPhone reject, this could hit revenues going forward. But the question is by how much? Investors are likely to turn to the earnings release which may shed more light on this along with management opinions on what Apple’s latest move means for the business outlook.

As the global economic outlook continues to brighten, Facebook remains one of the winners.

It must be kept in mind that small businesses will most likely benefit from the economy re-opening and normality returning. Given how Facebook gets a handsome chunk of its revenues from these small businesses, the business outlook remains encouraging and this may be reflected in the earnings report.

Can Facebook retest all-time highs?

Facebook shares are looking slightly bearish on the daily charts as there have been consistently lower lows and lower highs since hitting the all-time high of $315.73 on 8th April.

Although prices are respecting a bearish channel and trading marginally below the 20 SMA, support can be found at $296.00. Should $296.00 prove to be reliable support, a rebound back towards $310 and $315.73 could be on the cards. Alternatively, a breakdown towards $296 may open the doors towards $290.50.


Disclaimer: The content in this article comprises personal opinions and should not be construed as containing personal and/or other investment advice and/or an offer of and/or solicitation for any transactions in financial instruments and/or a guarantee and/or prediction of future performance. ForexTime (FXTM), its affiliates, agents, directors, officers or employees do not guarantee the accuracy, validity, timeliness or completeness, of any information or data made available and assume no liability as to any loss arising from any investment based on the same.


Forex-Time-LogoArticle by ForexTime

ForexTime Ltd (FXTM) is an award winning international online forex broker regulated by CySEC 185/12 www.forextime.com

Technical Outlook: Commodity Currencies In Focus

By Lukman Otunuga Research Analyst, ForexTime

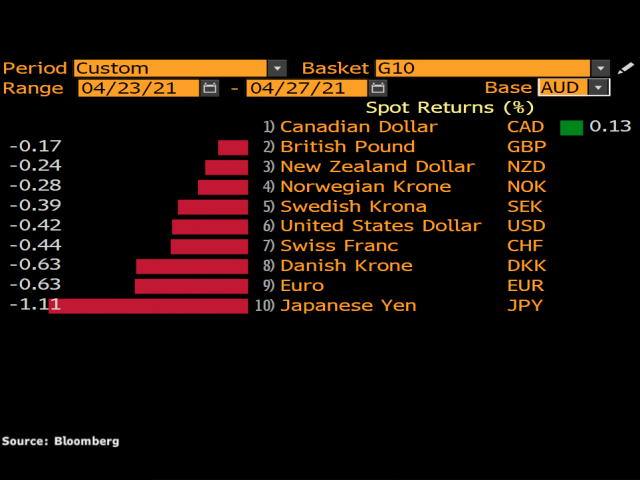
Our currency spotlight shines on the Canadian Dollar, New Zealand Dollar and Australian Dollar.

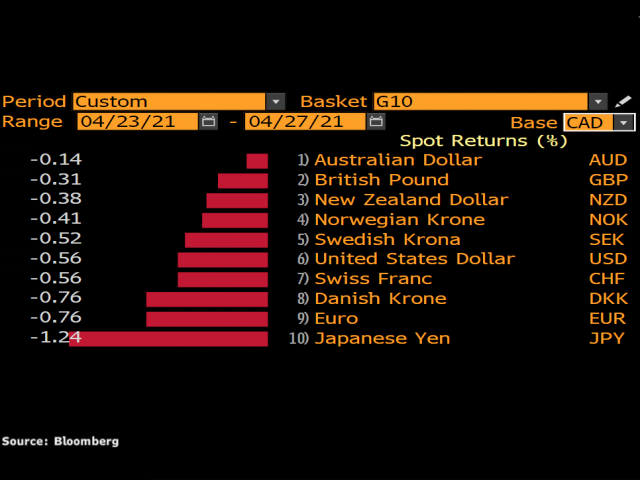
Since the start of the week, these commodity currencies have appreciated against the Greenback and major peers in the G10 group.

Today, the goal is to uncover potential technical setups for the week ahead and our tool of choice will be technical analysis.

USDCAD screams bearish

It has been a great week for the Canadian Dollar thus far.

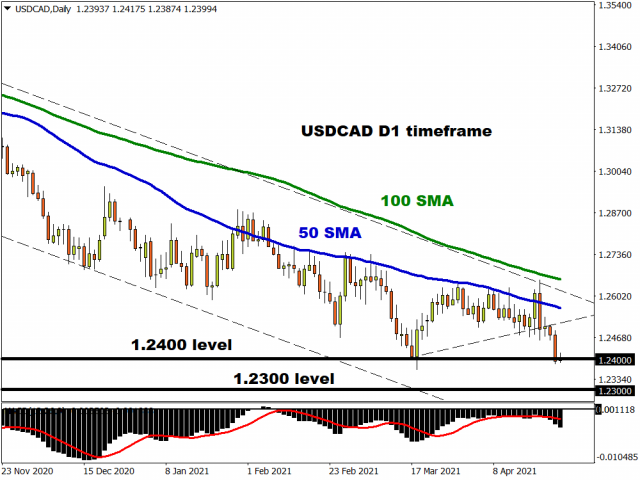
Looking at the USDCAD, prices are heavily bearish on the daily charts as there have been consistently lower lows and lower highs. Lagging indicators in the form of the Moving Averages and MACD favour further downside. Given how the USDCAD has secured a daily close marginally below the 1.2400 support, this may signal a decline to levels not seen since early 2018 around 1.2300.

AUD bulls still in the game

Just like the Canadian Dollar, the Australian Dollar has appreciated against most G10 currencies this week.

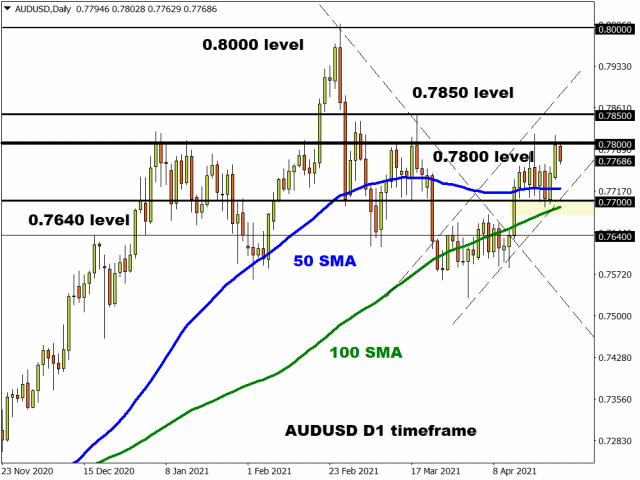
Talking technicals, the AUDUSD needs to secure a solid daily close above 0.7800 to challenge 0.7850 and potentially higher. Technicals remain in favour of bulls as prices are trading above the 50-day and 100-day Simple Moving Average. Should 0.7700 prove to be reliable support, this could inspire bulls to re-test the 0.7800 resistance in the short term.

Alternatively, sustained weakness below 0.7800 may result in a decline back towards 0.7700 and 0.7640, respectively.

NZDUSD back within a wide range

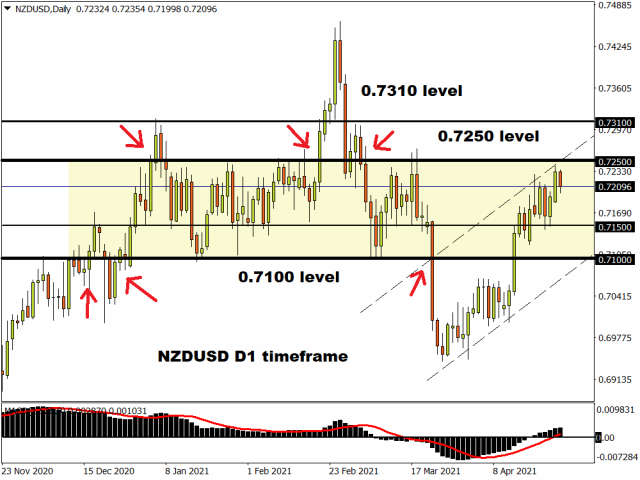
As the sub-title says, the NZDUSD currently resides within a 150 pip range on the daily charts with support around 0.7100 and resistance at 0.7250. But there have been periods where the currency pair has broken above or below this range as highlighted on the chart.

Given how bulls remain in the driving seat, the NZDUSD has the potential to push higher with 0.7250 acting as the first barrier. A strong daily close above this level may open the doors towards 0.7310.

If 0.7250 proves a tough resistance to crack, prices may decline back towards 0.7150 and 0.7100, respectively.

Disclaimer: The content in this article comprises personal opinions and should not be construed as containing personal and/or other investment advice and/or an offer of and/or solicitation for any transactions in financial instruments and/or a guarantee and/or prediction of future performance. ForexTime (FXTM), its affiliates, agents, directors, officers or employees do not guarantee the accuracy, validity, timeliness or completeness, of any information or data made available and assume no liability as to any loss arising from any investment based on the same.


Forex-Time-LogoArticle by ForexTime

ForexTime Ltd (FXTM) is an award winning international online forex broker regulated by CySEC 185/12 www.forextime.com

Microsoft drops on earnings. Bounce higher at key support?

By Admiral Markets

Microsoft shares dropped 3% lower after the market closed yesterday on the back of the company’s third-quarter earnings report. The company actually posted stronger figures than analysts were expecting.

  • Earnings came in at $1.95 per share against an expected $1.78 per share.
  • Revenue came in at $41.71 billion against an expected $41.03 billion.
  • Annualised revenue growth for the quarter was up 19%
  • Azure public cloud grew 50% against an expected 46% growth

While the results even surprised Microsoft in its earnings call, the share price dropped. This is most likely due to profit-taking but does now present some interesting technical analysis levels for traders.

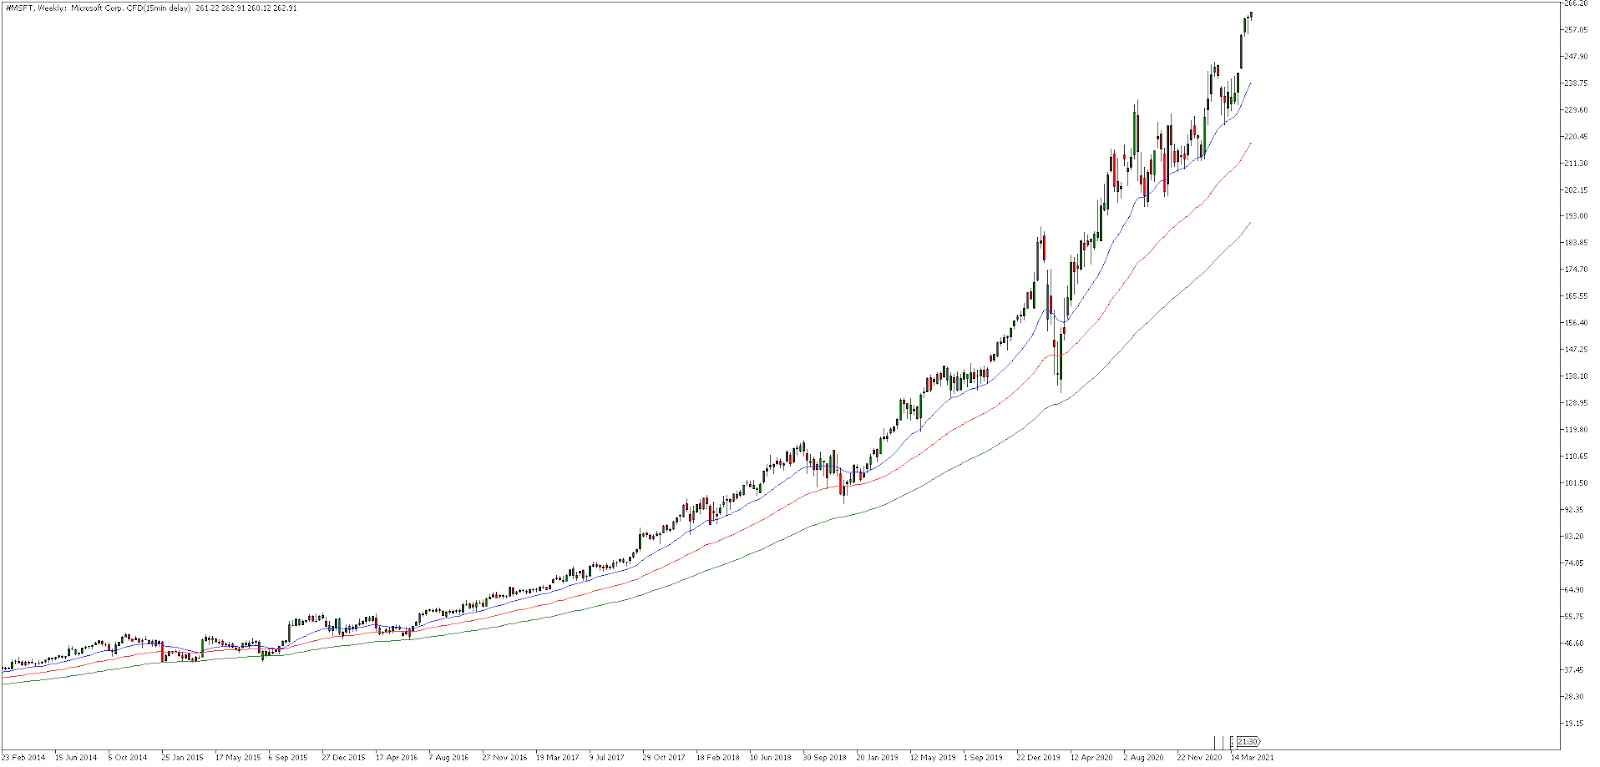
Source: Admirals MetaTrader 5, MSFT, Weekly – Data range: from Feb 23, 2014, to Apr 27, 2021, performed on Apr 27, 2021, at 8:30 pm GMT. Please note: Past performance is not a reliable indicator of future results. 


The long-term, weekly price chart of Microsoft’s shows a clear uptrend that many investors will not want to fight.

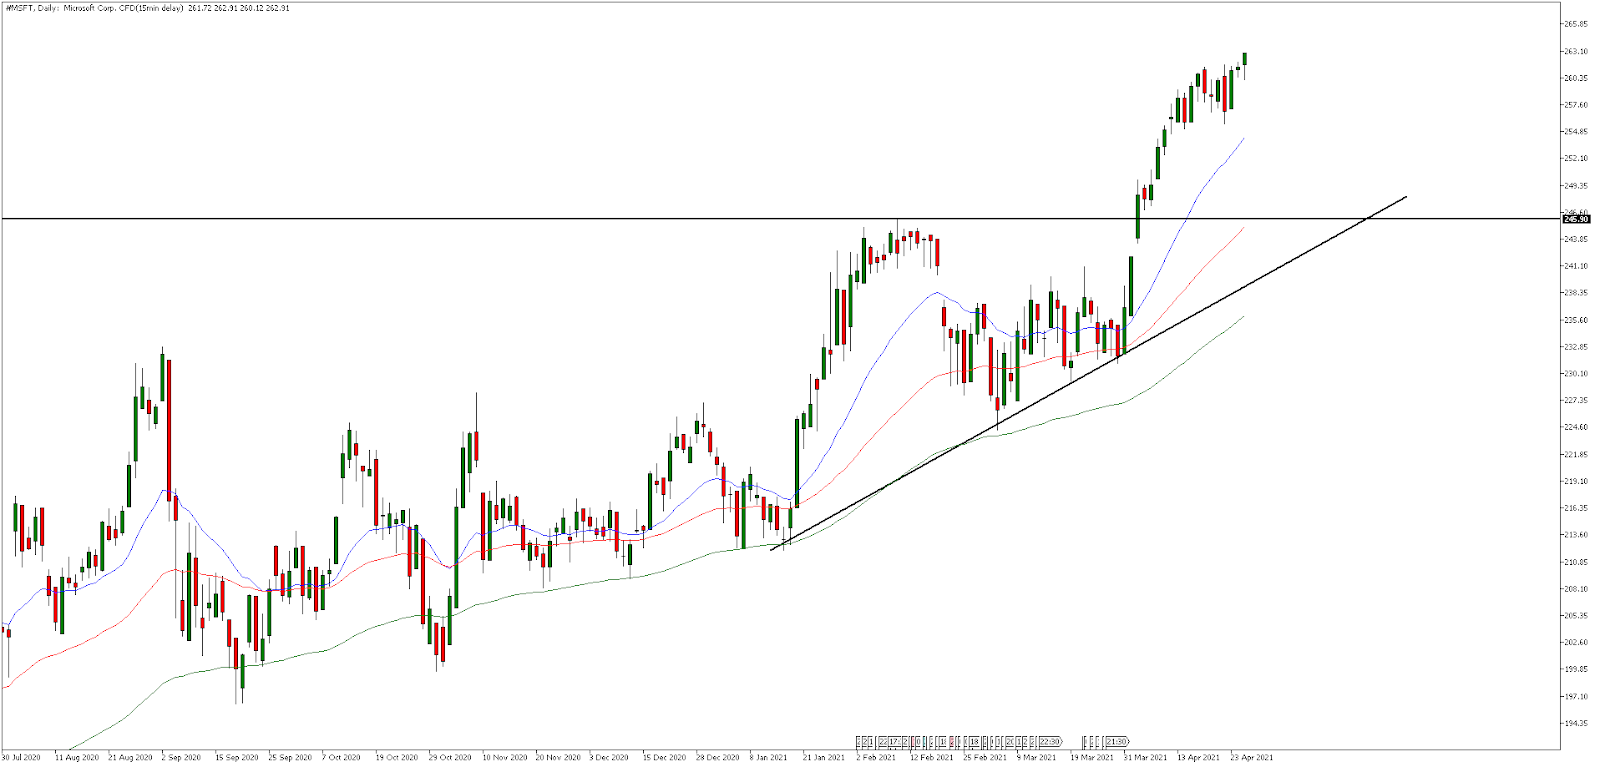
Source: Admirals MetaTrader 5, MSFT, Daily – Data range: from Jul 30, 2020, to Apr 27, 2021, performed on Apr 27, 2021, at 8:30 pm GMT. Please note: Past performance is not a reliable indicator of future results. 


The daily chart above shows some interesting technical analysis levels highlighted in black. The combination of the ascending trend line support and horizontal price level from the high of February all converge around the 50-period (red) exponential moving average.

If early investors do decide to profit take sending the share price lower, then these areas of support may be levels some traders may start looking for a turning point. Identifying the right price action trading patterns will be key in this area.

Did you know that you can use the Trading Central Technical Ideas Lookup indicator to find actionable trading ideas on thousands of other instruments across Forex, stocks, indices, commodities and more?

You can get this indicator completely FREE by upgrading your MetaTrader 5 trading platform provided by Admirals (formerly Admiral Markets) to the exclusive Supreme Edition! You’ll also receive a whole range of advanced trading tools such as correlation and sentiment indicators!

Start your free download by clicking on the banner below:

Download MetaTrader 5 Supreme Edition

INFORMATION ABOUT ANALYTICAL MATERIALS:

The given data provides additional information regarding all analysis, estimates, prognosis, forecasts, market reviews, weekly outlooks or other similar assessments or information (hereinafter “Analysis”) published on the websites of Admiral Markets investment firms operating under the Admiral Markets trademark (hereinafter “Admiral Markets”) Before making any investment decisions please pay close attention to the following:

  1. This is a marketing communication. The content is published for informative purposes only and is in no way to be construed as investment advice or recommendation. It has not been prepared in accordance with legal requirements designed to promote the independence of investment research, and that it is not subject to any prohibition on dealing ahead of the dissemination of investment research.
  2. Any investment decision is made by each client alone whereas Admiral Markets shall not be responsible for any loss or damage arising from any such decision, whether or not based on the content.
  3. With view to protecting the interests of our clients and the objectivity of the Analysis, Admiral Markets has established relevant internal procedures for prevention and management of conflicts of interest.
  4. The Analysis is prepared by an independent analyst, Jitan Solanki (analyst), (hereinafter “Author”) based on their personal estimations.
  5. Whilst every reasonable effort is taken to ensure that all sources of the content are reliable and that all information is presented, as much as possible, in an understandable, timely, precise and complete manner, Admiral Markets does not guarantee the accuracy or completeness of any information contained within the Analysis.
  6. Any kind of past or modeled performance of financial instruments indicated within the content should not be construed as an express or implied promise, guarantee or implication by Admiral Markets for any future performance. The value of the financial instrument may both increase and decrease and the preservation of the asset value is not guaranteed.
  7. Leveraged products (including contracts for difference) are speculative in nature and may result in losses or profit. Before you start trading, please ensure that you fully understand the risks involved.

By Admiral Markets

“Fastest Jump Since 2007”: How Leveraged Investors are Courting “Doom”

“Our view is that the use of margin to buy stocks is far higher than the NYSE figures indicate”

By Elliott Wave International

The stock market uptrend has extended for more than 11 years.

Even so, instead of displaying caution, investors have been borrowing to buy stocks like there’s no such thing as a bear market.

For example, consider this chart and commentary from the March Elliott Wave Financial Forecast, a monthly publication which provides analysis of major U.S. financial markets:

Alan M. Newman, editor of Crosscurrents (www.cross-currents.net), is a market veteran who has seen many bull and bear markets. He recently published this “startling” chart of what he calls Net Investment Liquidity, in which he subtracts total U.S. mutual fund cash from total New York Stock Exchange margin debt. [Newman said]: “We’ve seen a lot in 56 years of observation and this appears to be the riskiest environment in my lifetime.”

The April Elliott Wave Financial Forecast provided more coverage of margin debt by saying:

Margin debt as a percentage of U.S. disposable personal income hit 4.6% in February, well above the extremes of approximately 4% in 2000 and 2007. With “lopsided commitments” to leveraged long funds and all kinds of other arcane financial instruments, our view is that the use of margin to buy stocks is far higher than the NYSE figures indicate.

An April 9 Business Insider article offered this angle:

Margin debt saw an annual surge of 49% in February, which was the fastest jump since 2007. …

Leverage is a double-edged sword for investors, as many take on the debt to buy more stocks. That is a winning strategy in a bull market, but a market correction can spell doom for investors who have too much leverage and need to sell equities or deposit more cash to meet margin calls, which can further exacerbate a downturn in stocks.

Financial history shows that bull markets usually reverse big-time just when confidence is at its zenith — the precise moment to exact maximum damage on investors’ stock portfolios.

Indeed, the Elliott wave model suggests that the U.S. stock market is at an important juncture.

Frost & Prechter’s book, Elliott Wave Principle: Key to Market Behavior, discusses the value of the Elliott wave model:

The primary value of the Wave Principle is that it provides a context for market analysis. This context provides both a basis for disciplined thinking and a perspective on the market’s general position and outlook. At times, its accuracy in identifying, and even anticipating, changes in direction is almost unbelievable.

You can have free access to the online version of Elliott Wave Principle: Key to Market Behavior by becoming a member of Club EWI, the world’s largest Elliott wave educational community. Club EWI is free to join and allows you free access to a wealth of Elliott wave resources on investing and trading.

Just follow this link to get started: Elliott Wave Principle: Key to Market Behavior — free and unlimited access.

This article was syndicated by Elliott Wave International and was originally published under the headline “Fastest Jump Since 2007”: How Leveraged Investors are Courting “Doom”. EWI is the world’s largest market forecasting firm. Its staff of full-time analysts led by Chartered Market Technician Robert Prechter provides 24-hour-a-day market analysis to institutional and private investors around the world.

How Businesses Are Giving Back To Healthcare Workers

The coronavirus pandemic has shown us how dedicated, hardworking and truly essential healthcare workers are for our society. Many businesses and organizations have decided to reward this hard work by doing what they can to give back to healthcare workers.

Here are some of the best ways businesses are giving back to healthcare workers.

Care Packages

Businesses across the country have put together care packages to deliver to our healthcare workers. Some have been lunch, snacks, hot drinks and snacks during a shift, while others have provided groceries and other necessities.

Transport

Some cities are offering free and discounted public transport to healthcare workers. Mechanical businesses are offering free services to keep frontline workers’ vehicles working correctly. Some car manufacturers are also offering discounts on new cars.

Vacations

Many holiday companies offer free vacations for healthcare workers when the pandemic is over to reward them for their dedication and service. You should look into the offers available and see if you qualify.

Spa Days

Spas have offered free sessions to healthcare workers that need to unwind and de-stress after a hard week and can be claimed after the pandemic has subsided.

Specialized Finance

There are now loans and financing aimed directly towards healthcare workers. You should check out this information from the Home Loan Expert on refinance for healthcare workers to discover the benefits.

Online Classes

Many exercise studios are offering free classes to healthcare workers to help them stay fit and healthy. You should consider researching what is available in your local area.

Mental Health Support

Therapists nationally are offering their services to healthcare workers due to the unprecedented strain on their mental wellbeing. You should reach out to a mental health worker if you are struggling during this challenging time.

Raising Funds

Many initiatives have begun to raise money for the additional expenses that healthcare workers are facing. Whether providing much-needed essentials or personal protective equipment, there are many ways you should consider giving back. Some businesses offer cash to healthcare workers. If you are struggling financially, you should look into this.

Childcare

Many daycares are taking the children of healthcare workers for free or at reduced rates. This allows the healthcare professionals to do their work without the financial concerns of getting a sitter for their children.

Discounts For Brands

Brands big and small are giving back to healthcare workers with discounts on their products and services. You should see this list for more details on how you can benefit.

Increasing Awareness

Raising awareness is essential to tackling the pandemic and taking the pressure off of healthcare workers. Businesses are informing people of how they should behave during the pandemic.

Conclusion

There are many ways businesses are giving back to frontline healthcare workers at this challenging time. If you are a healthcare worker, you should ensure that you take up some of the offers and initiatives above to help you stay healthy mentally and physically. During these trying times, we all must come together to support those who need it.

By Taylor Wilman


Why corporate America appears to be drifting away from the Republican Party

By M. K. Chin, Indiana University 

– There’s a growing rift between corporate America and the GOP – two groups that have long been bedfellows.

The latest incident involves a restrictive voting law passed in Georgia – with dozens of other states working on their own measures meant to limit voting. Over 300 companies, CEOs and other executives signed a statement printed in The New York Times to “defend the right to vote and oppose any discriminatory legislation,” while Major League Baseball moved its All-Star Game from Atlanta to Denver.

Republicans reacted furiously and warned of retribution, including eliminating tax breaks for companies taking a stand on the issue. Texas’ governor backed out of throwing the ceremonial first pitch at the Texas Rangers’ home opener. And Senate Minority Leader Mitch McConnell bluntly warned companies to “stay out of politics” – though he later softened his tone.

Meanwhile, Democrats are trying to capitalize on the fracture.

As a management professor, I study how corporate executives’ values and political views affect the decisions they make on behalf of their companies. While I believe CEOs are partly responsible for the growing business-GOP divide, it’s not the only factor driving it.

A tight relationship loosens up

The close relationship between corporate America and the Republican Party dates back to the 1970s. Companies provided financial support to conservative war chests and in return received business-friendly policies like reduced corporate taxes and regulations.

The alliance has arguably been quite a success for Big Business. Corporate taxes as a share of U.S. gross domestic product are only about 1%, the lowest since the 1930s and down from 4.1% in 1967.

But this union has become increasingly strained in recent years over a range of social issues, particularly regarding LGBTQ rights.

For example, in 2015 many companies including Apple and Walmart denounced so-called religious freedom laws like one passed in Indiana that would allow businesses to discriminate against LGBTQ customers. The following year there was a similar corporate backlash over North Carolina’s ban on transgender individuals using public bathrooms. Boycotts by several companies, including PayPal and the NCAA, led to a partial repeal in 2017.

Companies were also vocal during former President Donald Trump’s presidency over such matters as his travel ban from Muslim-majority countries and his comments following the white supremacist rally in Charlottesville, Virginia. For some, it seemed like the role he and other Republicans played in laying the ground for the Jan. 6, 2021, insurrection at the Capitol may have been the last straw, as dozens of companies including AT&T and Marriott said they would cut off donations to the 147 Republicans who voted against certifying President Joe Biden’s election.

The push for more restrictive voter laws continues the battle over the election. Republicans in states across the country cite alleged fraud in the 2020 election – despite no evidence that any occurred – as the impetus behind their push.

Why have companies become more outspoken in recent years and willing to upset an alliance that has helped them reduce their tax bills and regulatory hurdles?

My research suggests there are three driving forces for this trend.

CEOs doing ‘what we think is right’

The CEO is the corporation’s top decider, which means his or her political leanings can filter into business decisions.

And in recent years, CEOs of some of the largest U.S. companies have cited their own personal values as their reason for speaking out on social issues. As Bank of America CEO Brian Moynihan told The Wall Street Journal in 2016, “Our jobs as CEOs now include driving what we think is right.”

In my own research, I’ve found a CEO’s political affiliation can affect how a company spends money. CEOs who mostly donate to Democrats tend to spend more on their employees, community activities and environmental issues, regardless of their company’s profitability. That is, they seem to believe it’s simply the right thing to do.

Republican CEOs, on the other hand, tend to tie spending on outside issues to financial performance, reflecting the notion that companies are responsible to shareholders first and foremost.

More recent research also demonstrates that liberal executives tend to pay more attention to gender diversity inside their companies and are less likely to reduce their workforce when economic conditions deteriorate, consistent with the values that liberals prioritize.

But relatively few CEOs are staunchly liberal, so the impact of the CEO on this trend may be limited. A recent study found that only about 18% of the more than 3,500 people who served as CEOs of companies in the Standard & Poor’s 1500 from 2000 to 2017 donated primarily to Democratic candidates, while 58% gave mostly to Republicans.

Growing worker activism

Employees also play an important role driving corporate activism.

Recent management research shows that companies with more liberal employees spend more resources on improving gender and race diversity and sustainability issues. Similarly, a 2019 study found that companies are more likely to concede to activists’ demands over issues like reducing carbon emissions and increasing front-line workers’ pay when they have a more liberal workforce.

Companies may be responding to research showing the benefits of listening to their employees and showing their voices matter. For example, workers tend to show more trust and commitment toward a company when they feel it shares their values, which leads to higher productivity. A 2017 survey found that 89% of employees said they’d accept a reduced salary to work at a company whose values match their own.

Other research shows engagement in social activities like protecting the environment leads to less employee turnover.

In my own research, which tracked companies’ engagement on same-sex marriage issues in the 2000s and 2010s, I found that the likelihood of CEOs speaking out on same-sex marriage significantly increased when there were more employees who donated to Democrats – which was true even when the CEO leaned conservative.

Tracking popular opinion

Public opinion is another factor likely driving the growing rift with the GOP.

Corporate executives tend to follow public sentiment, as they want to minimize the risk of losing customers for their products and services.

The debate over same-sex marriage is a good case in point. Public support for allowing gay people to marry surpassed 50% for the first time in 2011 – it’s now at 67%. Until then, very few CEOs had made a public statement on the issue, according to my same-sex marriage research. Once popular opinion hit the halfway point, however, a lot more companies – including ones led by conservative CEOs – begin speaking out in favor. Interestingly, even liberal CEOs said very little until 2011, including those who already provided employees with domestic partner benefits.

And more recently, it has become even more critical for companies to consider public sentiment when deciding whether to take a stand on a hot-button issue. That’s because their younger customers, especially millennials, increasingly say CEOs have a responsibility to speak out and they would be more likely to buy products if they do.

On the voting laws, a recent poll found that most people favor legislation that makes it easier to vote, not harder.

Who’s leaving whom

But corporate America isn’t necessarily moving away from the Republican Party and toward the Democrats.

Instead, businesses are trying to make clear that their concerns are not partisan in nature. The 100-plus companies that signed a statement supporting voter rights and against bills that would restrict access emphasized this point.

I believe a closer look at the three main factors – especially the role of workers and the public – behind the growth in corporate activism suggests something else. Companies aren’t drifting away from the Grand Old Party. Rather, the GOP seems to be doing the drifting, not only from corporate America, but the American public as well.The Conversation

About the Author:

M. K. Chin, Assistant Professor of Management, Indiana University

This article is republished from The Conversation under a Creative Commons license. Read the original article.

FOMC Policy Meeting: Has The Economy Improved Enough?

By Orbex

Fed Chairman Jerome Powell is in a somewhat difficult position. This is likely to be expressed in the statement from the FOMC policy meeting and the subsequent press conference.

There is a reason that he’s been making public statements much more often over the last few weeks. The Fed has to manage a somewhat complicated policy route over the next few months.

To get it out of the way, the majority of analysts don’t expect there to be any policy change by the Fed at the meeting.

Expectations are for interest rates to remain where they are, and for asset purchases to be kept at the current level.

So, we can expect the market reaction to be muted – as long as Powell can manage expectations.

Where we are going over where we are

Last month’s jobs report was great, and the latest economic data shows that consumers are coming back to the market.

With the economy growing, it becomes increasingly obvious that the Fed will step back from stimulus at some point. However, that expectation can hurt economic growth as the market adjusts to expectations of higher rates.

With the Fed seeking to support the economy as much as they can, they want to avoid any appearance that they are getting ready to change policy. On the other hand, they can’t not acknowledge the better economic data, because that also could depress markets.

So, the expectation is for the FOMC to provide a more upbeat outlook in the statement, but at the same time emphasize that more needs to be done to support the market.

Powell is again expected to emphasize this point in the presser.

The yields are the key

Following the approval of the last stimulus bill, bond yields started to move higher as traditional economics forecast increased inflation.

Analysts reassessed when the Fed was likely to raise rates. But higher bond yields imply increased cost of credit and could weigh on the economy. Powell came out repeatedly over the next couple of weeks to affirm that the Fed was far from raising rates, and yields finally settled down.

As long as Powell managed to keep that line of “things are improving, but not enough to consider tapering”, we ought to see little reaction in the market.

But reporters are expected to badger him about where asset purchases are going. Powell is likely to try to avoid even using the word “taper” (it might set off some of the algos).

Where things are going

The consensus of expectations is that the Fed won’t start tapering off its asset purchases until March of next year (with a potential first rate hike in March of 2023).

Any policy change in the meantime is expected to be “technical”. So, the thinking is that the Fed will try to stay on the sidelines of the economy for the next several months. But, ironically, will require more public appearances and commentary to reassure investors that’s the case.

The three criteria that need to be met before the Fed is expected to consider tapering are:
– Job market has reached “full employment”
– Inflation is at 2%
– Inflation is likely to exceed 2% for an extended period of time.
By Orbex