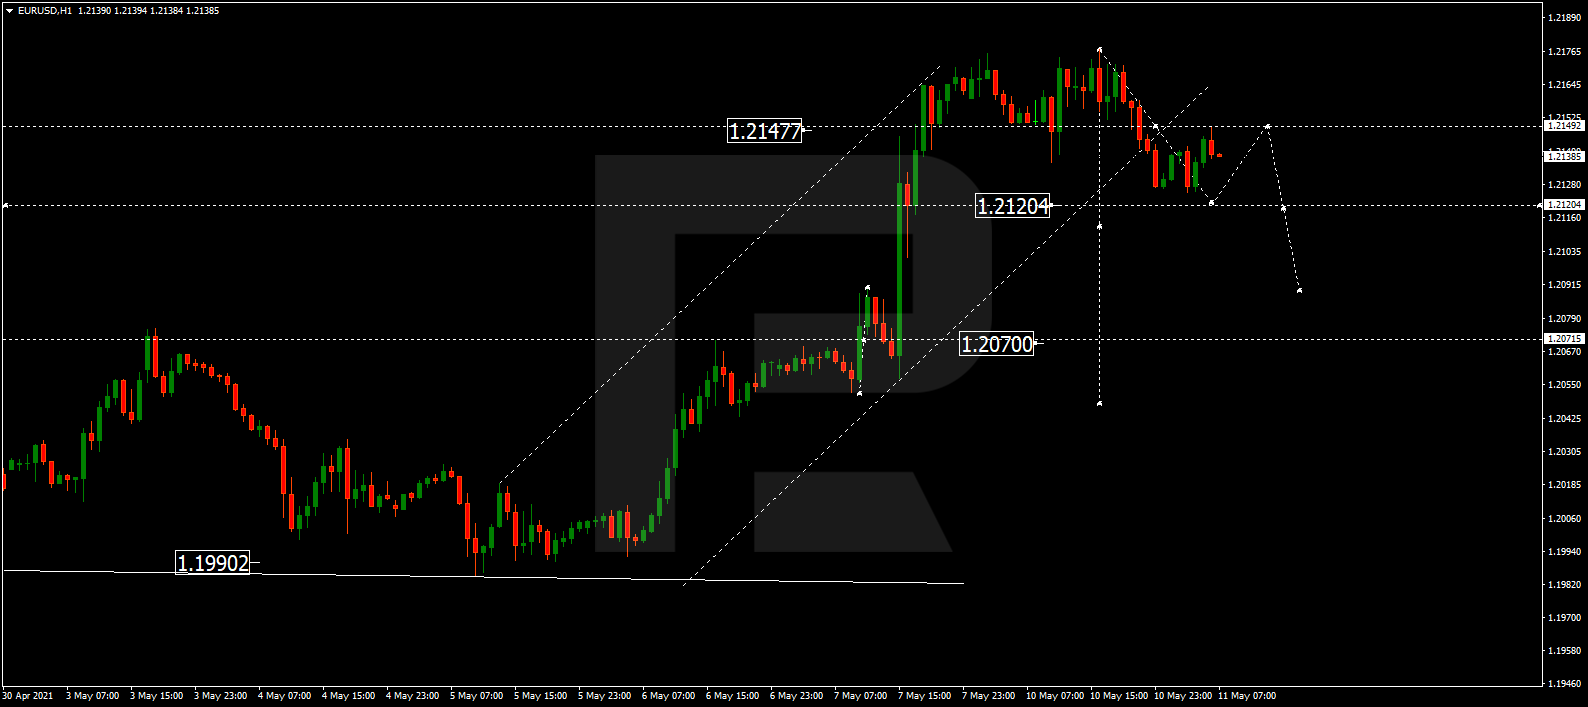
EURUSD is falling towards 1.2120 and may later start a new correction to reach 1.2147, thus forming a new consolidation range around the latter level. Possibly, the pair may break the range to the downside and resume trading downwards with the target at 1.1860.
GBPUSD, “Great Britain Pound vs US Dollar”
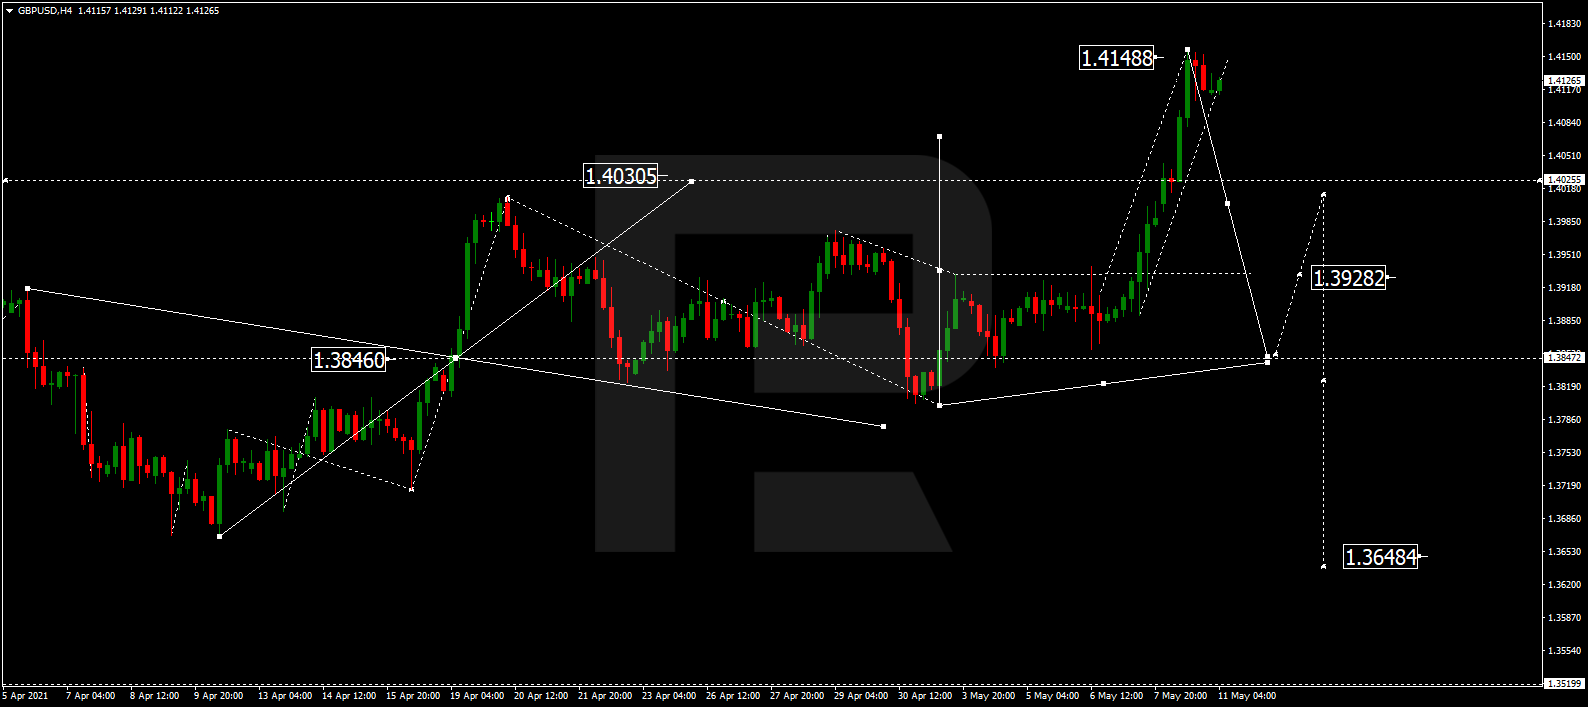
After extending the ascending wave up to 1.4148, GBPUSD is consolidating below this level. Possibly, today the pair may fall to reach 1.3847 and resume growing with the target at 1.4000.
USDRUB, “US Dollar vs Russian Ruble”
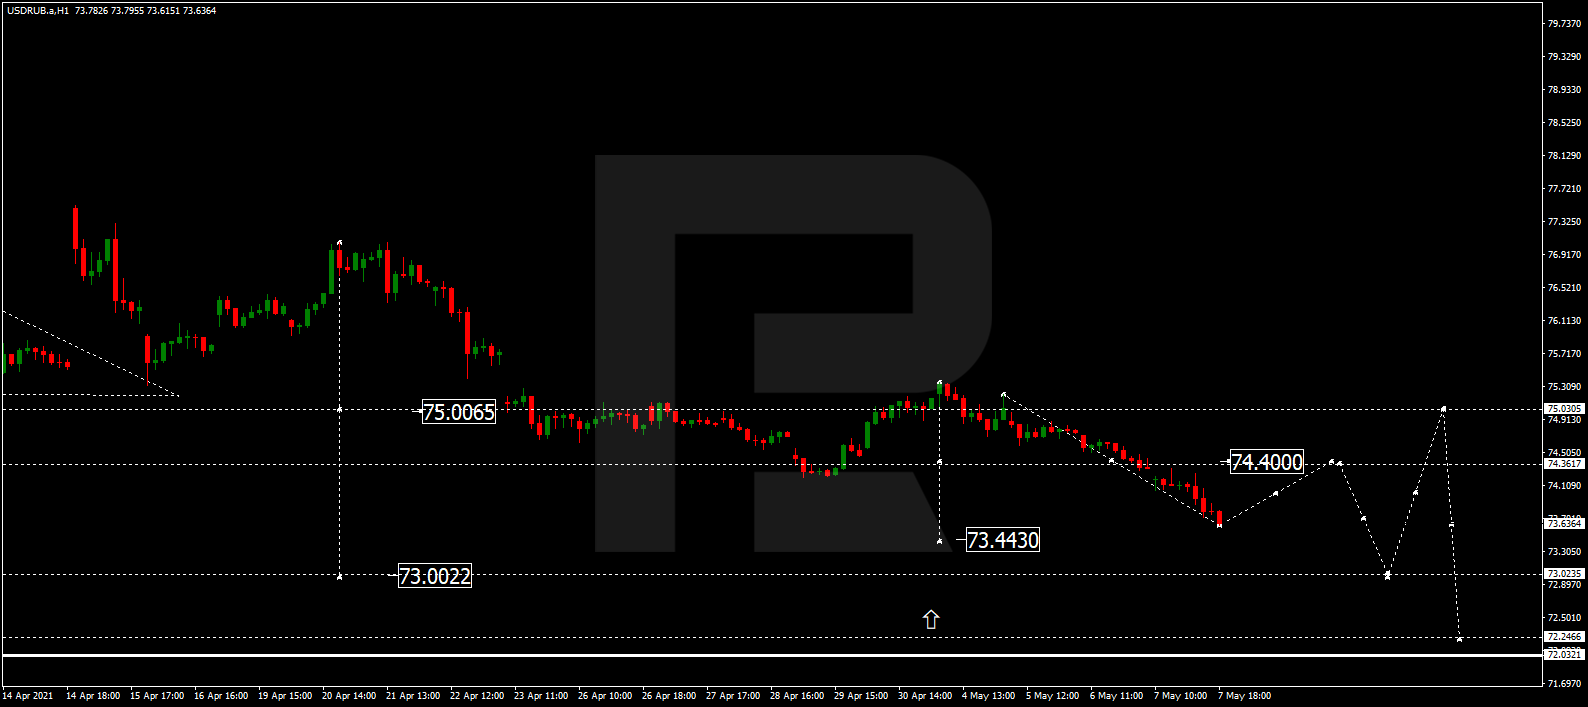
USDRUB has completed the descending wave at 73.44 and may later correct towards 74.40. After that, the instrument may resume trading downwards with the target at 73.00.
USDJPY, “US Dollar vs Japanese Yen”
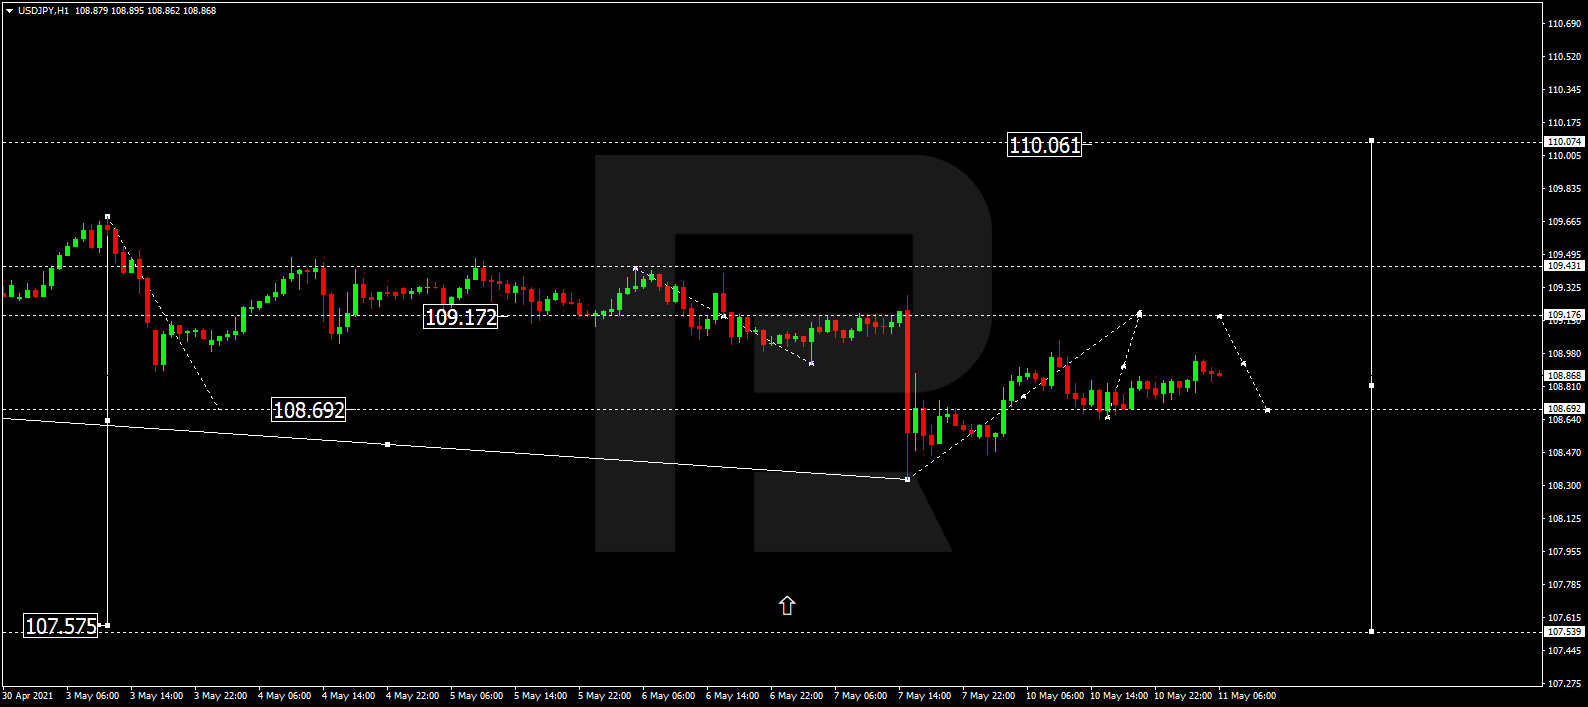
USDJPY is correcting towards 109.17 and may later start a new decline to break 108.66. After that, the instrument may continue trading downwards with the target at 107.60.
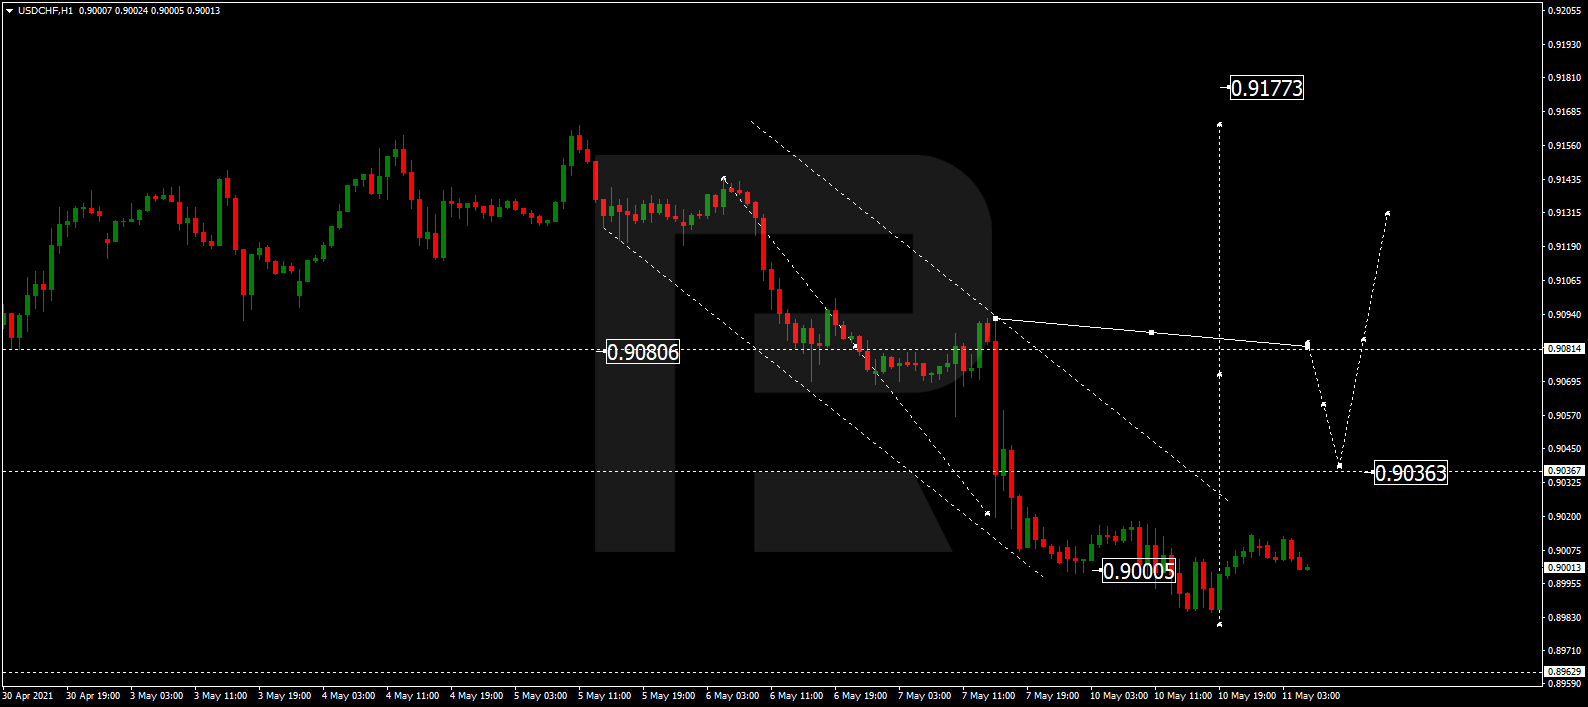
USDCHF, “US Dollar vs Swiss Franc”
USDCHF is forming a new consolidation range around 0.9000. Today, the pair may break the range to the upside and start a new correction to reach 0.9090. Later, the market may resume falling with the target at 0.9036.
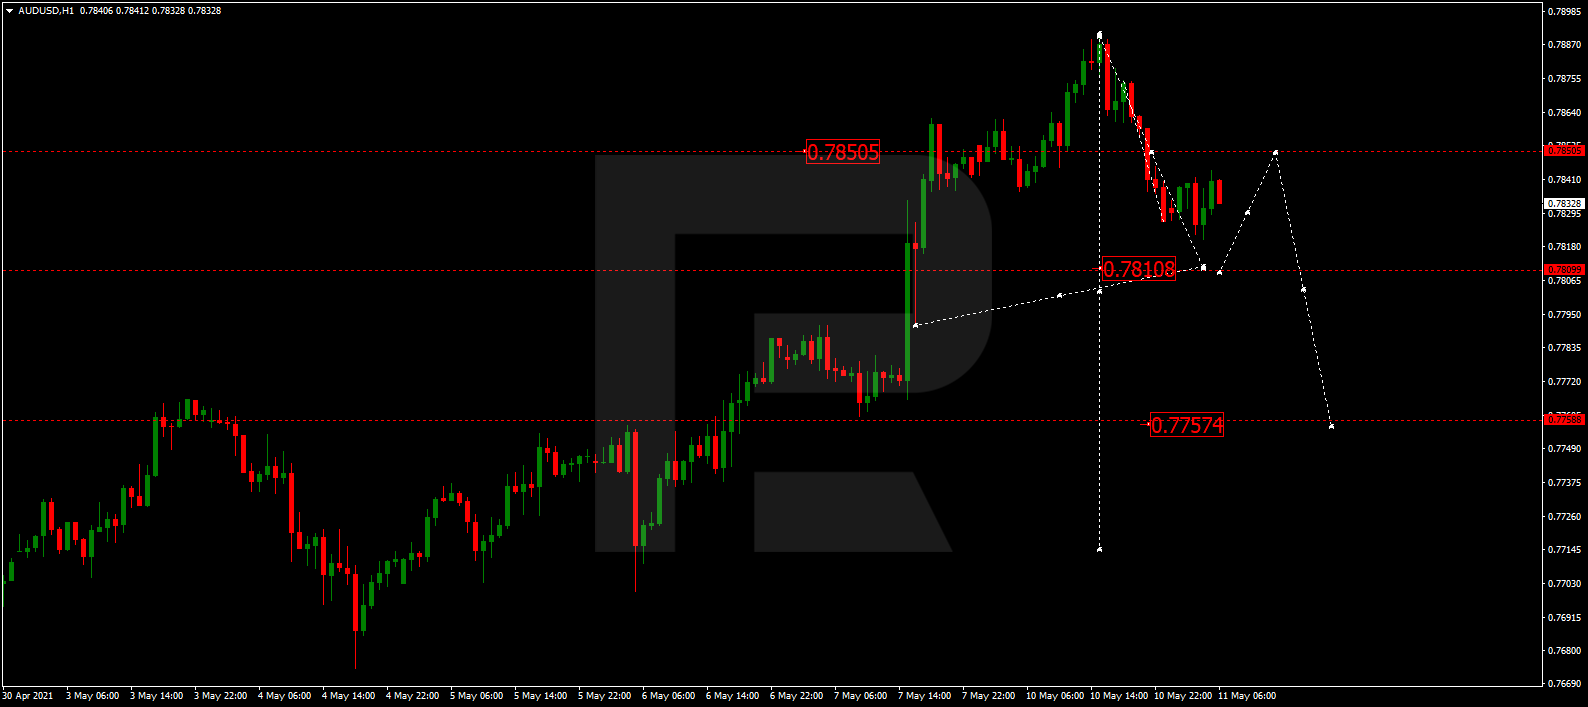
AUDUSD, “Australian Dollar vs US Dollar”
AUDUSD is falling towards 0.7810 and may later form one more ascending structure to reach 0.7850. After that, the instrument may fall to break 0.7800 and then continue falling with the short-term target at 0.7757.
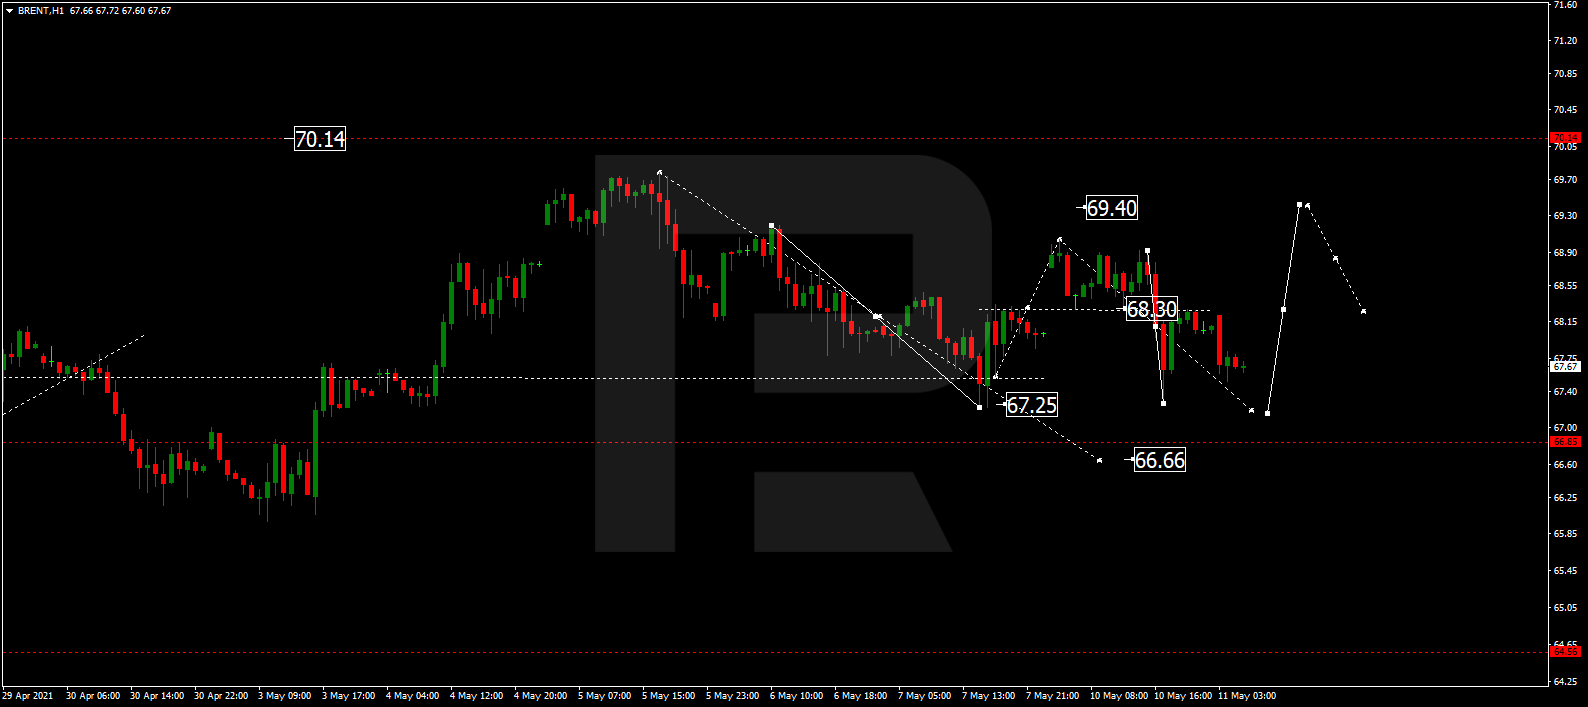
BRENT
Brent is correcting towards 66.66. Later, the market may start another growth with the target at 69.40 or even reach 70.00.
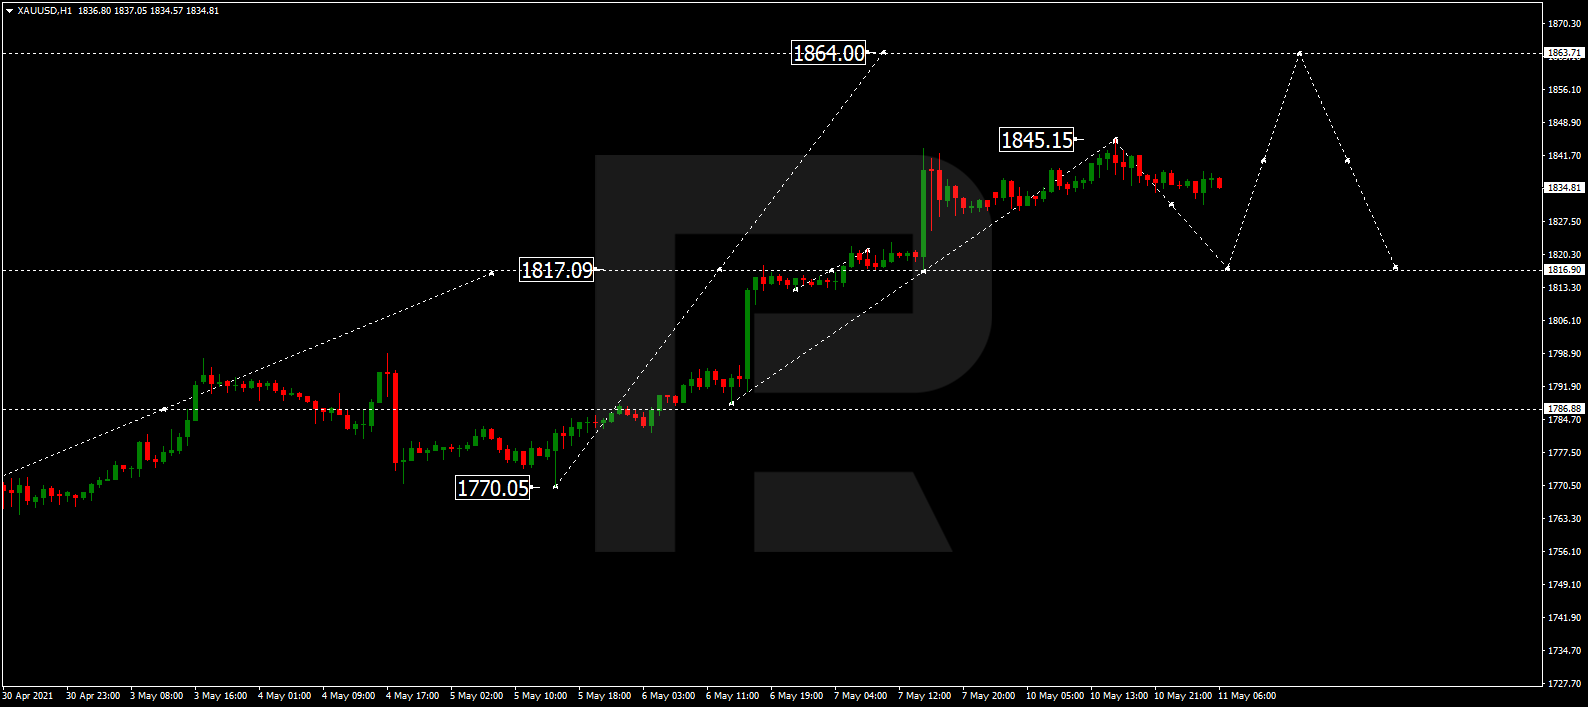
XAUUSD, “Gold vs US Dollar”
After finishing the ascending structure at 1845.15, Gold is expected to correct towards 1817.00. After that, the instrument may resume trading upwards with the target at 1863.70.
S&P 500
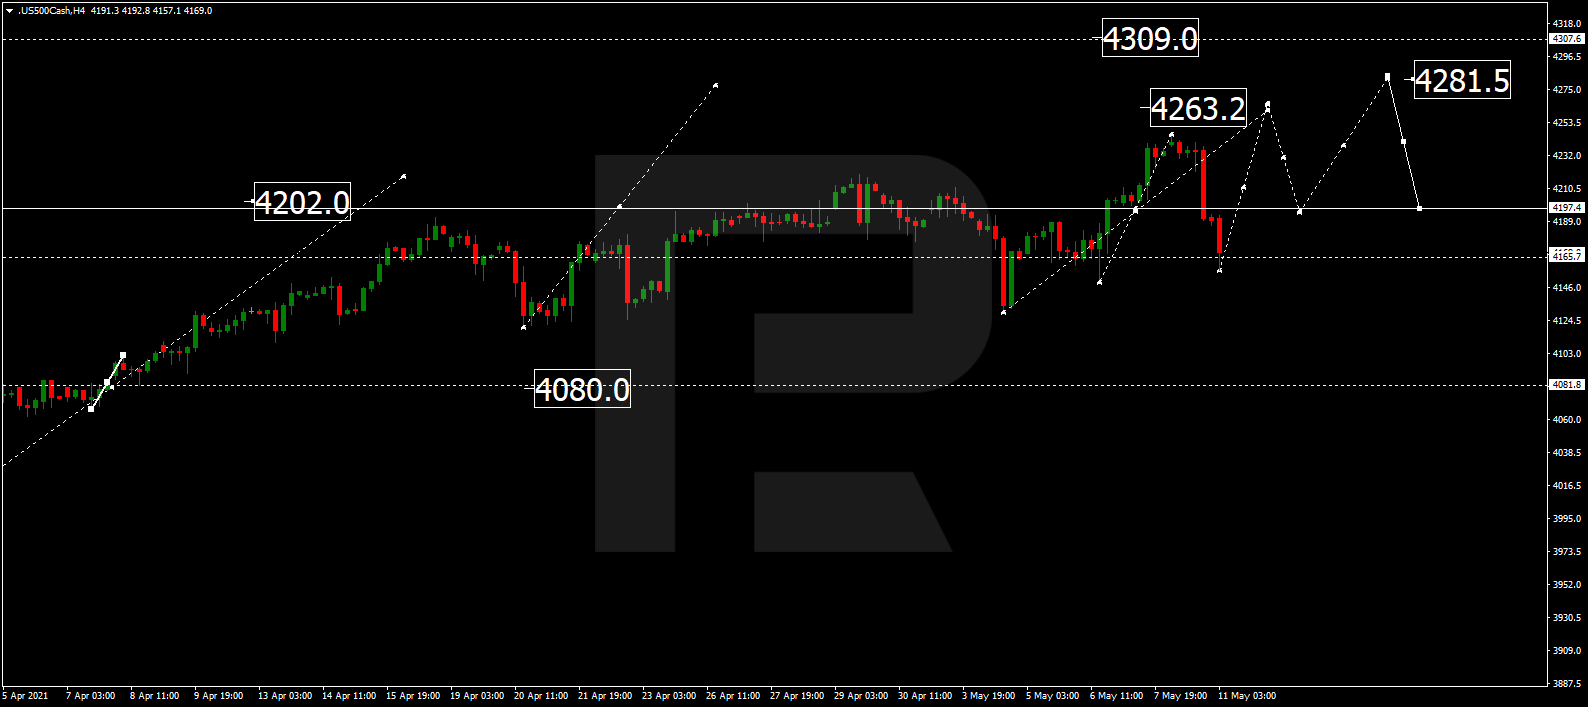
The S&P index has completed the correction at 4165.0. Possibly, today the asset may resume growing towards 4263.2 and then start another correction to reach 4200.0. After that, the instrument may form one more ascending structure with the target at 4281.5.
Attention! Forecasts presented in this section only reflect the author’s private opinion and should not be considered as guidance for trading. RoboForex LP bears no responsibility for trading results based on trading recommendations described in these analytical reviews.
The EUR/USD currency pair was flat on Monday. Most of the time the price moved sideways and only at the end of the American session it went down, breaking through the support level of 1.2150.
Trading recommendations
Support levels: 1.2108, 1.2074, 1.2027, 1.2002, 1.1957, 1.1835
Resistance levels: 1.2150, 1.2176, 1.2212, 1.2243
At the moment, there is a pullback down within the main uptrend. Therefore, traders should focus on buy deals from the support levels near the trend line or near the moving average.
Alternative scenario: if the price breaks down through the 1.2074 support level and holds below, the general uptrend is likely to be broken.
News feed for 2021.05.11:
– European ZEW Economic Sentiment (m/m) at 12:00 (GMT+3).
The GBP/USD currency pair
Technical indicators of the currency pair:
Prev Open: 1.3999
Prev Close: 1.4116
% chg. over the last day: +0.83%
The British pound looks very strong. On Monday, the GBP/USD currency pair added another 0.83% and reached the daily resistance level, where an active struggle between the buyers and sellers began.
Trading recommendations
Support levels: 1.3996, 1.3913,1.3835, 1.3801, 1.3756, 1.3690
Resistance levels: 1.4126, 1.4207
At the moment, the sellers managed to bring the price back below the level of 1.4126. Considering the price deviation from the moving average, traders should expect a corrective down wave to the support levels.
Alternative scenario: if the price breaks down through the 1.3913 support level and holds below, the bullish scenario is likely to be canceled.
News feed for 2021.05.11:
– UK BOE Governor Andrew Bailey Speaks at 17:30 (GMT+3).
The USD/JPY currency pair
Technical indicators of the currency pair:
Prev Open: 108.54
Prev Close: 108.83
% chg. over the last day: +0.26%
On Monday, the USD/JPY currency pair traded in a narrow range. At the end of the Asian session, the buyers tried to push the price higher, but the sellers protected their levels.
Trading recommendations
Support levels: 108.44, 108.19,107.77, 107.47, 107.04
The price is still trading below the moving average. The MACD is in the negative area and is not active for now. Under such market conditions, it is possible to work in both directions, “long” from the support or “short” from the resistance levels. But if the dollar index continues to fall, the USD/JPY will form a mid-term downtrend.
Alternative scenario: if the price drops below 108.44, the general downtrend is likely to resume.
There is no news feed for today.
The USD/CAD currency pair
Technical indicators of the currency pair:
Prev Open: 1.2117
Prev Close: 1.2104
% chg. over the last day: -0.11%
The downward movement on the USD/CAD started to slow down. The price has approached the support level (the 4 years price minimum) and might bounce off soon.
The trend remains bearish for USD/CAD. But the MACD indicator is already signaling about 2 divergences (mid-term and local). It is too early to look for long positions, as buyers have not yet shown initiative. Also, it is too late to open short deals, as the support level is ahead. Traders should wait or trade intraday timeframes.
Alternative scenario: if the price breaks through the 1.2321 resistance level and holds above, a local corrective uptrend is likely to form.
This article reflects a personal opinion and should not be interpreted as an investment advice, and/or offer, and/or a persistent request for carrying out financial transactions, and/or a guarantee, and/or a forecast of future events.
Considering the rising inflation expectations, investors turned away from technology stocks in favor of more cyclical companies. By the close of the trading session, the Dow Jones Index decreased by -34.94 points (-0.1%), the S&P 500 decreased by -44.17 points (-1.04%), and the Nasdaq Composite lost 350.38 points (-2.55%).
European indices showed mixed dynamics on Monday. However, there were no panic sell-offs as in the US. For instance, the German DAX Index even rose slightly at the end of the day.
Falling stock indices may increase the demand for gold, as the gold price is closely linked to inflation expectations and also depends on the US Treasuries yields.
WTI crude oil futures prices fell during Monday’s US session. On Monday, Colonial Pipeline said that it intends to resume operations on a full-scale basis by the end of the week, but some producers have already cut production. With India’s weekly average COVID-19 reaching a new high, all this could put pressure on demand for “black gold”.
Japan’s Nikkei Index fell by -2.8%, while the broadest Asia-Pacific Stock Index MSCI fell by -1.7%, it’s the biggest drop since late March.
Main market quotes:
S&P 500 (F) 4,188.43 -44.17 (-1.04%)
Dow Jones 34,742.82 -34.94 (-0.1%)
DAX 15,400.41 +0.76 (+0.01%)
FTSE 100 7,123.68 -6.03 (-0.09%)
USD Index 90.27 -0.04 (-0.04%)
Important events:
– China Consumer Price Index (m/m) at 04:30 (GMT+3);
– China Producer Price Index (m/m) at 04:30 (GMT+3);
– Europe ZEW Economic Sentiment (m/m) at 12:00 (GMT+3);
– Australia Annual Budget Release (y/y) at 12:30 (GMT+3);
– UK BOE Governor Andrew Bailey Speaks at 17:30 (GMT+3).
This article reflects a personal opinion and should not be interpreted as an investment advice, and/or offer, and/or a persistent request for carrying out financial transactions, and/or a guarantee, and/or a forecast of future events.
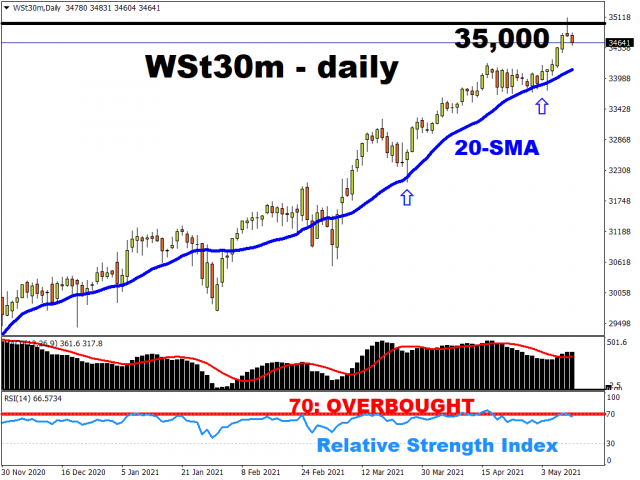
For stock bulls, the good news was that 35,000 Dow did happen on Monday.
However, it only lasted a few hours, before the index ended 0.1% lower. From a technical perspective, it was ripe for a pullback, given that its 14-day relative strength index had breached the 70 mark which signals overbought levels.
Monday’s drop was far more noticeable in US tech stocks, with benchmark indexes dragged lower by tech megacaps:
Note that these six stocks listed above account for nearly a quarter (23.3%) of the S&P 500’s total market cap, while accounting for more than half (56%) of the Nasdaq 100. In other words, the performances of these individual stocks, due to their sheer size, has a major impact on how the broader index performs.
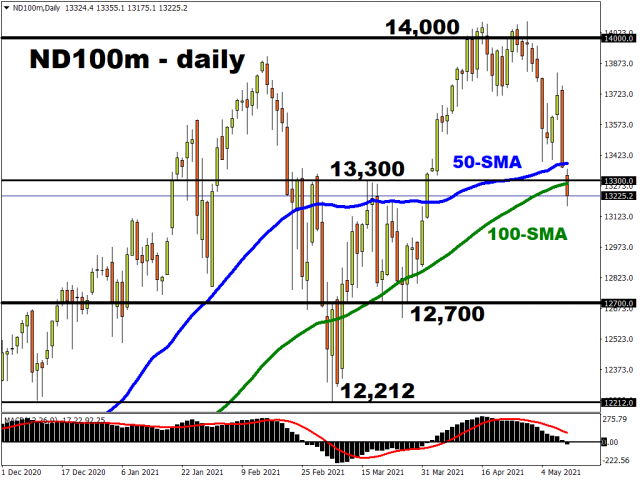
Given the higher concentration of tech stocks on the Nasdaq 100, it was yesterday’s biggest loser of the three main benchmark US indexes. The Nasdaq 100 fell by 2.63% to post its biggest single-day loss since 18 March 2021.
The futures contract for the Nasdaq 100 has now broken below its 100-day simple moving average (SMA). Tech aficionados would point to the fact that, since the market rout in March 2020, this index’s foray below its 100-day SMA has been fleeting. After that single day loss of 3.13% on 18 March 2021, the Nasdaq 100 went on to advance by almost 10% and post a new record high a month later (16 April).
Some traders are raising their bearish bets on the Nasdaq 100, while pulling funds out of the sector. In short, tech stocks appear likelier to experience larger bouts of volatility compared to other sectors.
Over the immediate term, with momentum now pointing firmly south, there’s likely to be more near-term declines for the Nasdaq 100 before the dust settles.
Why are tech stocks falling hard?
This is likely due to two major concerns:
Investors now deem the valuations of tech stocks to be overextended and are finding fewer catalysts that can spur these stocks higher.The Nasdaq 100 currently has a PE ratio of 35.63. That’s in contrast to the S&P 500’s PE ratio of 30, and the sub-27 ratio for the Dow. The higher the PE ratio, the more “expensive” the stock is deemed to be.
Hence, with concerns that these valuations are no longer justifiable, in light of the anticipated reopening of the US economy, many investors have instead engaged in the “reflation trade” at the expense of tech stocks which had a remarkable 2020.
Markets are also growing more concerned about the threat of faster US inflation.This is evident in the breakeven rates for 10-year US Treasuries, which hit a fresh 8-year peak on Monday before moderating slightly since.
Despite the sluggish April US nonfarm payrolls figures released this past Friday, some investors are holding fast to the notion that the trillions of dollars in stimulus spent by the government and the central bank is bound to show up in the inflation data. Such an inflation overshoot might force the Fed to pull back its support for financial markets sooner rather than later. And when policymakers start signalling for sure that they’re ready to pare back their bond purchases, there is likely to be an almighty reaction in US stocks, especially sectors that are showing signs of too much froth like tech.
The jury is still out about the US inflation outlook, and what that might mean for the Fed’s timeline before unwinding its stimulus measures. While such uncertainty may well trigger further bouts of volatility in equities, steadier hands may find more gains to be had from US stocks in the interim.
Disclaimer: The content in this article comprises personal opinions and should not be construed as containing personal and/or other investment advice and/or an offer of and/or solicitation for any transactions in financial instruments and/or a guarantee and/or prediction of future performance. ForexTime (FXTM), its affiliates, agents, directors, officers or employees do not guarantee the accuracy, validity, timeliness or completeness, of any information or data made available and assume no liability as to any loss arising from any investment based on the same.
Pound bulls dominated the scene on Monday as investors welcomed an easing political risk for the United Kingdom.
The falling likelihood of a second Scottish independence referendum in the near term following last week’s election boosted buying sentiment towards Sterling. A broadly weaker dollar also played a role in propelling the GBPUSD to its highest level since February 25th.
With Covid-19 cases falling, two-thirds of UK adults receiving a first dose of the vaccine and the next phase of lockdown easing scheduled on May 17th, the economic outlook for the post-pandemic UK remains bright. This may translate into a stronger Pound over the next few weeks.
Can the GBPUSD push higher?
Looking at the daily charts, the technicals are heavily bullish. The GBPUSD has jumped over 150 pips today and a total of 350+ pips since the start of May! Prices are trading comfortably above the 20-day and 50-day Simple Moving Average while the MACD trades above zero. A solid daily close above 1.4100 could provide a platform for bulls to springboard prices towards 1.4200 and the 2021 high of 1.4240.
One thing to keep in mind is that the Relative Strength Index (RSI) is very close to hitting 70 which suggests that the GBPUSD is overbought and may be primed for a technical pullback. Should prices fail to keep above 1.4100, a decline back towards 1.4000 and lower could be on the cards.
Zooming out on the weekly charts, there have been consistently higher highs and higher lows. Prices are trading above the 20-week Simple Moving Average while the MACD trades above zero. A strong weekly close above the 1.4000 resistance could encourage an incline towards 1.4240 which is the 2021 high. A move beyond this point could see the GBPUSD test 1.4350 – a level not seen April 2018.
Disclaimer: The content in this article comprises personal opinions and should not be construed as containing personal and/or other investment advice and/or an offer of and/or solicitation for any transactions in financial instruments and/or a guarantee and/or prediction of future performance. ForexTime (FXTM), its affiliates, agents, directors, officers or employees do not guarantee the accuracy, validity, timeliness or completeness, of any information or data made available and assume no liability as to any loss arising from any investment based on the same.
It seems farfetched to imagine that an ancient meditation technique, practised by Buddhists over 2,000 years ago, could have a place in the 21st-century corporate boardroom.
Yet, despite criticisms that it is just another faddish appropriation (and aberration) of Eastern traditions in the West, “mindfulness” is proving its worth in the workplace.
Mindfulness traces its origins to early Buddhist texts. The Pali word “Sati” describes a lucidity that is linked to the reduction of human suffering and enhanced states of calmness and contentment. Understandings of mindfulness are also present in other traditions such as Hinduism, Judaism and Christianity.
But the technique has taken on new forms and fluid meanings in the West. As a result, mindfulness training in the workplace, too, comes in different shapes and with varying interpretations. This has led to concerns that the fundamental understandings of mindfulness are getting lost in translation. Specifically, ethical pillars such as putting aside greed and self-concern are being watered down, if not casually culled.
Likewise, fears abound that mindfulness could be opportunistically deployed by managers eager to squeeze more out of their workforce, or to co-opt them into corporate “group-think”.
Research has also pointed to other potential adverse effects like alienation from others and the workplace.
On the other hand, there is growing consensus that mindfulness can benefit people in leadership positions. It’s been found to help business leaders strengthen relationships at the office, build greater resilience, improve the performance of tasks and decision-making, and more.
To extend our understanding of the impact of mindfulness on leadership we recently conducted a study with an array of professionals, including engineers, health professionals, senior managers, human resource administrators and consultants.
The participants had all attended some form of training in mindfulness leadership. The training was in the tradition developed by the American professor emeritus of medicine Jon Kabat Zinn. The practices and understandings were derived from vipassana, which focuses on seeing clearly the true nature of reality.
Participants in the study would carve out time daily for formal mindfulness practices. These included sitting meditation, mindful yoga, body scanning, and walking meditation. They also practised infusing awareness into daily activities.
We then asked them how – if at all – they had been able to apply those practices to their work.
We found that the capacities developed through mindfulness affected the leaders’ own sense of productivity. It also affected their awareness of the power dynamics in their workplace relationships, and their relationships with others. This ultimately helped them manage conflict and disharmony in their environment better.
Individual leadership capacities
We identified four factors that could be defined as the overarching psychological capital, as well as social resources and strengths that aid individuals in their careers. They were:
meta-cognition (being aware of one’s state of mind);
enhancing kindness (the ability to extend compassion to the self and others);
developing equanimity (to experience both good and difficult moments with a sense of balance); and
“embodiment”, to be aware of the movement and spatial orientation of the body, even the sensations from one’s internal organs.
By drawing on these, the participants could then, in turn, develop four individual leadership capacities. These were:
the ability to be with unpleasant thoughts, feelings and sensations or experiences;
an enhanced sense of self;
resilience; and
openness to multiple perspectives and possibilities.
A different lens on the workplace
Some participants explained that their learnings from mindfulness were at times painstaking and at odds with their knee-jerk, automatic impulses and psychological trigger-reactions. One participant described an encounter with a person he was on the brink of firing. In a final meeting with the employee
I was able to be released from the structure, from the constructs, and allow the person to talk and for me to listen… deciding {ultimately} to retain the person, who has turned out to be massively successful, reliable and stable.
Mindfulness allowed others to understand that they were overworking simply to fit in with their corporate culture. Many reported that the emotional energy expended in “covering” – downplaying certain aspects of their identity in order to blend in – was exhausting.
After purposefully considering their own deep dilemmas, their more authentic identities came to the fore.
Mindfulness also helped them to:
overcome senses of failure;
tap into colleagues’ and subordinates’ creativity;
defuse charged situations; and
improve their workplace relationships across cultural divides.
The participants said they’d made changes as a result. This included adapting the way they interacted with their workforce and paying attention to the concerns and needs of followers. It also led to changes to the way they communicated with colleagues and employees, and the ways in which they built and sustained relationships with their teams.
All ultimately impact employees’ motivation, workplace engagement, and performance at work.
Benefits
Based on these findings, we have developed a mindfulness model that shows that mindfulness can transform leadership in the workplace, while retaining essential Buddhist tenets.
Our model shows that the awareness that mindfulness brings can provide an antidote to the “Three Poisons” of greed, hatred and delusion. As expressed in the workplace, these are:
excessive productivity;
hatred (“Dvesha”) in the form of aggressive workplace behaviours; and
delusion (“Moha”), which is the abuse of power at work.
The future and forms of mindfulness in the 21st century workplace – especially one transformed by a global pandemic – remain to be seen. But by remaining true to its founding principles, we imagine that it can play a helpful role in transforming the workplace. This is because it can shift the centrality of productivity and the relationship to busy-ness and overwork to a richer engagement with personal values and its alignment to constructive workplace behaviours.
This process opens the door to healthier boundaries being set for individuals in relation to work. It also allows others to constructively dissent and critique and to continuously hold up the status quo to interrogation.
For leaders it can mean disconnecting from needing to control and rather finding ways to enhance and empower others. And to act compassionately in the workplace.
If during the first quarter of this year we commented that the U.S. dollar was experiencing a rebound against the main currencies, and as we commented in past analyses, during last April, the dollar yielded 2.11% compared to the main currencies with a decrease reflected in the dollar index from the $93.36 with which it opened last April to the $91.27 rate at the end of the month.
This decline can be explained by the relaxation in the yields of North American bonds and the uncertainty in relation to whether or not the Federal Reserve will finally make a decision on its current monetary policy, in terms of tightening it due to the economic recovery. However, these doubts seem to have dissipated for the moment, following the bad unemployment data on Friday.
Specifically, in the employment data for last April, we can see that not only were they not lower than those of last month, but they fell far short of market expectations after creating 266,000 jobs compared to the 770,000 expected, negatively impacting the dollar.
EURUSD analysis
Market attention last week focused mainly on employment data from the United States after the important NFP was released on Friday. This data was especially bad, since 266,000 jobs were created compared to the 770,000 expected, affecting the dollar significantly, so the EURUSD managed to overcome the medium-term downtrend line.
Technically speaking, the break of this trend line can cause a new upward momentum that takes the price to levels not seen since the beginning of the year, although for this we must be attentive as to whether the price is able to maintain this break. On the contrary, the loss of the 18 session average would in turn endanger the 1.20 level and open the doors to a further decline.
Source: Daily chart of the EURUSD of the Admiral Markets MetaTrader 5 platform from January 23, 2020 to May 10, 2021. Taken on May 10 at 12:45 CEST. Note: Past performance is not a reliable indicator of future results, or future performance.
Evolution of the last 5 years:
2020 = + 8.93%
2019 = -2.21%
2018 = -4.47%
2017 = + 14.09%
2016 = -3.21%
GBPUSD analysis
In the case of GBPUSD, we can see that this pair is following a very clear upward trend since it marked minimums on March 20, 2020 around the level of 1.14100 until it almost reached the level of 1.42366, which led it to exceed its long-term downtrend line (in dotted red).
As we can see in the weekly chart, after marking maximums last February, the EURUSD price began a correction that led it to lose the important level of 1.40. This was in search of its average of 18 sessions, where it has found an important support point to start a new momentum that has led it to break above not only the 1.40 level but also to trade at levels close to 1.41.
As long as the price does not lose its average of 18, the feeling will continue to be bullish. The final loss of the 1.40 and the 18 average would unlock a further correction to the previous resistance level in red.
Source: GBPUSD weekly chart from Admiral Markets MetaTrader 5 platform from September 28, 2014 to May 10, 2021. Taken on May 10 at 1:10 p.m. CEST Note: Past performance is not a reliable indicator of future results, or future performance.
Evolution of the last 5 years:
2020 = + 3.10%
2019 = + 3.95%
2018 = -5.54%
2017 = + 9.43%
2016 = -16.26%
USDJPY Analysis
Finally, if we take a look at the USDJPY pair, we can observe how the Japanese Yen was one of the currencies that was greatly affected by the increases in the dollar. This is because, during the rises in February and March, it went from trading at levels close to 102,700 to trading at levels close to 111,000. As we can see in the weekly chart, after facing its important support level for a long time, represented by the red band, the price definitely bounced past the 200 red average and the long-term downtrend line.
As we have commented previously, during the month of April this currency pair fell by 1.29%, leading the price to find the coincident zone of its 200 session average and the downtrend line, thus leaving the accumulated overbought.
Technically speaking, we must pay attention to the evolution of the price in the coming weeks, since if the price confirms the upward break of the previous resistance levels that currently act as the main support, the price could look for the upper band of the lateral channel in green. On the contrary, if the price re-enters lower levels, we could obtain a greater correction.
Source: Weekly USDJPY chart from Admiral Markets MetaTrader 5 platform from December 14, 2014 to May 10, 2021. Taken on May 10 at 1:15 PM CEST. Note: Past performance is not a reliable indicator of future results, or future performance.
Evolution of the last 5 years:
2020 = -4.95%
2019 = -0.88%
2018 = -2.76%
2017 = -3.59%
2016 = -2.85%
Discover Premium Analytics
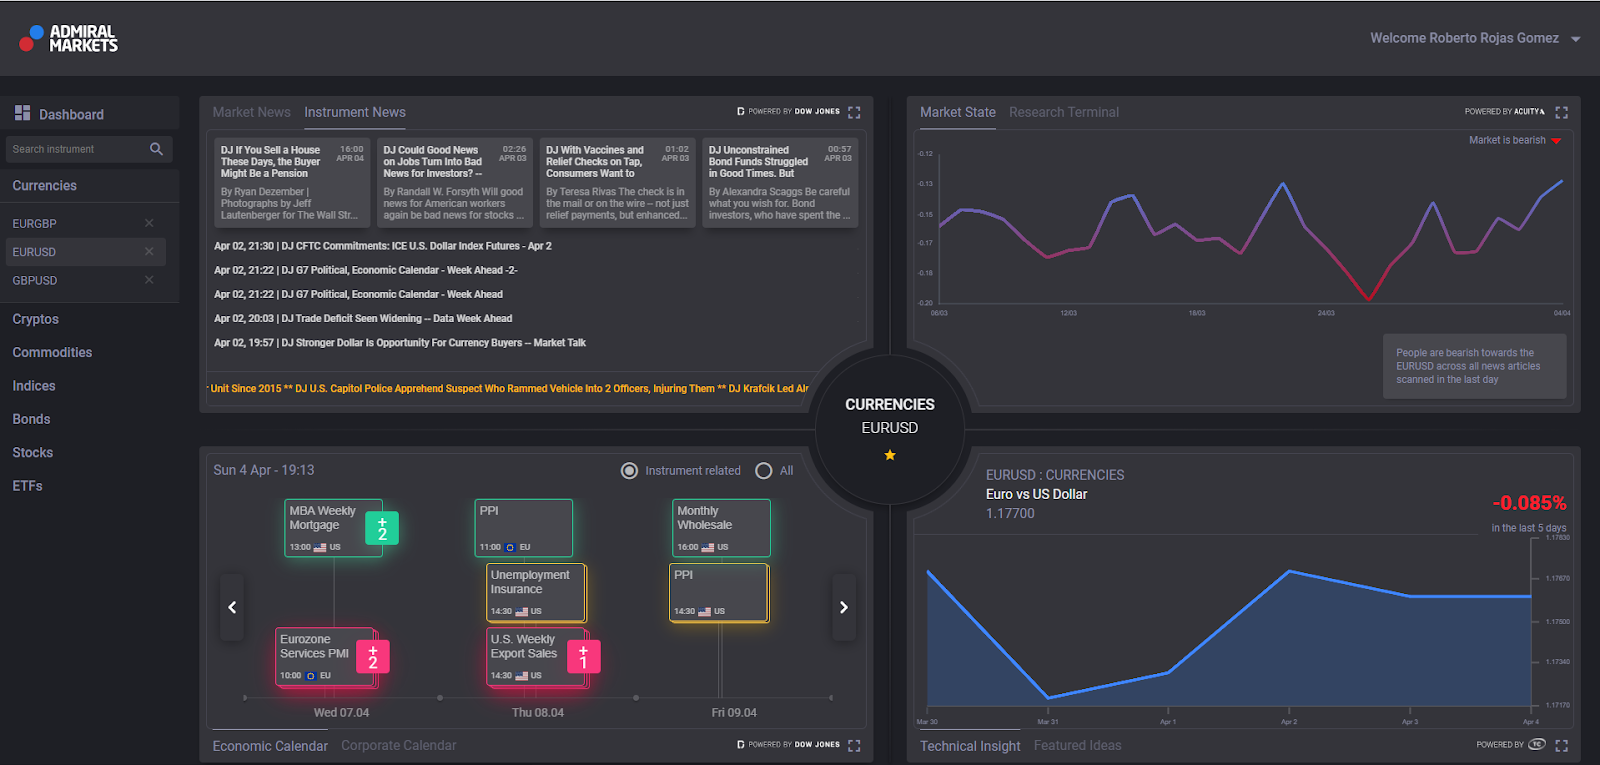
With Premium Analytics, you can follow all the important news and get the latest macroeconomic data through the news and the economic calendar offered by Dow Jones:
With the Admirals Trade.MT5 account, you can trade Contracts for Differences (CFDs) on EURUSD, GBPUSD and USDJPY and many more instruments. CFDs allow traders to try to profit from bull and bear markets, as well as the use of leverage. Click on the following banner to open an account today:
INFORMATION ABOUT ANALYTICAL MATERIALS:
The given data provides additional information regarding all analysis, estimates, prognosis, forecasts, market reviews, weekly outlooks or other similar assessments or information (hereinafter “Analysis”) published on the websites of Admiral Markets investment firms operating under the Admiral Markets trademark (hereinafter “Admiral Markets”) Before making any investment decisions please pay close attention to the following:
This is a marketing communication. The content is published for informative purposes only and is in no way to be construed as investment advice or recommendation. It has not been prepared in accordance with legal requirements designed to promote the independence of investment research, and that it is not subject to any prohibition on dealing ahead of the dissemination of investment research.
Any investment decision is made by each client alone whereas Admiral Markets shall not be responsible for any loss or damage arising from any such decision, whether or not based on the content.
With view to protecting the interests of our clients and the objectivity of the Analysis, Admiral Markets has established relevant internal procedures for prevention and management of conflicts of interest.
The Analysis is prepared by an independent analyst, Roberto Rojas (analyst), (hereinafter “Author”) based on their personal estimations.
Whilst every reasonable effort is taken to ensure that all sources of the content are reliable and that all information is presented, as much as possible, in an understandable, timely, precise and complete manner, Admiral Markets does not guarantee the accuracy or completeness of any information contained within the Analysis.
Any kind of past or modeled performance of financial instruments indicated within the content should not be construed as an express or implied promise, guarantee or implication by Admiral Markets for any future performance. The value of the financial instrument may both increase and decrease and the preservation of the asset value is not guaranteed.
Leveraged products (including contracts for difference) are speculative in nature and may result in losses or profit. Before you start trading, please ensure that you fully understand the risks involved.
– We recently completed some interesting research related to one of our newest Custom Indexes – the Commodities to Smart Cash Index (C2SC Heat Index) – weighted by the US Dollar and VIX. We’ve been reviewing this new index for months watching it to see how it reacts to various trends in Lumber, Gold, Treasury Yields, the Smart Cash Index, and other weighted values. Recently, we added the Fed Funds Rate to this chart and suddenly things took on a different perspective.
We had drawn horizontal lines on the Commodities to Smart Cash index highlighting historical high, low, and confluence price levels. Historically, when we see a chart that channels in a sideways range, one can often identify high and low price thresholds while also trying to find a confluence level (where a continued rise or decline in price is likely to continue). We can see how the US Fed reacted to rising inflationary concerns almost immediately as the C2SC Index rose near or above 6.5 (the RED Confluence level) throughout the past 25 years. Each time, in 1994, 1999, and 2005, when a period of increasing inflationary trends, the Fed was quick to act to contain inflation. The only time the Fed acted differently was in 2013~2015 and in 2020~now.
Where’s The Fed? Watch Precious Metals For Signs Of Panic
In 2013~2015, the C2SC Index rose above the Confluence level (the RED line) multiple times, yet the Fed kept rates extremely low – ignoring inflationary risks at that time. Then, in 2016, the Fed raised rates very slightly in an effort to test the global market’s reaction to tightening financial policy ahead of a big US election event. By mid-2017, the C2SC index started rising and the US Fed continued to raise interest rates. By late 2017, the C2SC index had risen past the RED Confluence level again and the US Fed continued to raise rates well into early Summer 2018.
In August 2018, the Fed attempted another 0.25% raise that broke the market trend and prompted a broad market decline into December 2018. In reaction to this breakdown in US markets, the US Fed dropped the Fed Funds Rate from 2.5% to 1.5% in a panic move. It stayed at that level until COVID-19 hit in February/March 2020.
Looking at the C2SC index, commodities have rallied more than 300% above the past 25 years of historic highs recently while Yields and Gold/Silver continue to stay rather muted in trends. Our concern is that the US Fed, in an effort to spark a solid post-COVID-19 economic recovery, has ignored the risks related to the extreme excess phase rally taking place throughout the globe in commodities, Cryptos, non-tangible speculative assets (NFTs, digital and others) as well as the risks associated with an eventual raising of interest rates to curb this inflationary excess phase. Gold and Silver have just started what appears to be a new bullish price trend. Will the US Fed be pushed to raise rates soon to curb this incredible bubble rally?
We started bouncing around the idea that the US Fed was inadvertently prompting a South Seas Company type of bubble event by allowing gross amounts of capital into the markets and artificially keeping interest rates near zero. For those of you who don’t know the story of the South Seas Company in London (1720), you can read more about it here: https://www.britannica.com/event/South-Sea-Bubble
FOMO Hyper-inflation Continues (until it ends)
In short, The South Seas Company was awarded £7 million to finance the war against France by the House of Lords. This bill, known as the South Sea Bill, allowed the South Sea Company a monopoly on the trade to South America (mostly Slave trade) and was expected to be a boost to the companies bottom line as the war with France ended with the Treaty of Utrecht (1713). Over the next 5+ years, the South Seas Company enjoyed robust profits and trade. Shares of the South Sea Company rose to 10x their value. Then, the South Seas Company, with King George I of Great Britain as governor of the company in 1781, suggested taking over the national debt of Great Britain in 1720.
The South Seas Company accomplished this incredible feat and shares started to skyrocket higher from $128.5 to over $1000 in just 7 months. As the hype continued to drive speculation and rumors, other stocks (some newly formed companies) were quick to catch the hype and quickly rallied to extreme highs as false statements, word-of-mouth hype and a general hyperbolic frenzy continued to drive speculation.
What brought down the South Seas Company was unbridled rumors, outright lies, hyperbolic speculation, and, eventually, a flood of money from France’s modernized economy. When the trend finally broke down, it took about 12 months for the entire bubble to deflate – leaving speculative investors holding empty bags.
The rally of the South Seas Company is very similar to what we are seeing right now in the US economy and in digital assets. There were a number of facets in place to drive this type of hyperbolic rally. First, the South Seas Company took over the national debt – essentially acting like the US Federal Reserve for Great Britian. Secondly, the wild speculation related to ongoing business activities and future expectations prompted an over-enthusiastic buying frenzy – driving prices higher by 10x traditional valuation levels.
In the end, with all the speculation, hype and people of title involved, the expected profits and returns from the South Seas Company never really materialized. The stock price started to decline and finally broke downward very sharply near late 1720 – almost 3 months after it peaked.
Is The US Fed Preparing To Make A Move Soon?
The recent rally in the US stock markets has seemed to stall recently, as can be seen in this Smart Cash Index chart below. Still, the recent rally since the November 2020 elections is nothing short of amazing – very similar to the rally in 2017 and into early 2018 – almost straight up.
Our research team believes a continued market rally may keep attempting to “melt-up” as long as the US Fed does not step in to try to curb inflationary aspects of the markets. It is hard to argue that traders and investors are going to suddenly change their minds in the midst of this FOMO rally – although, it does happen at some point.
There are really two concerns related to how this may end: the US Fed suddenly acting to curb inflation by raising rates and/or the consumers suddenly realizing the valuation levels have exceeded realistic expectations. We feel the rise in commodity prices as well as the current uptrend in precious metals and Copper may be pushing consumers closer and closer to that sudden realization that valuations are grossly advanced in comparison to real expectations.
When you look at this Smart Cash Index Monthly chart, below, you see that the Fed Funds Rate is still anchored near ZERO while the Smart Cash Index is nearing the highest levels since the January 2018 Ultimate Peak. The primary difference is that the US Federal Reserve is not acting to raise rates like they were in 2018 or even just before the Housing Bubble (2005~06). This suggests the rally may continue in a hyper-inflation trend and may push well beyond anyone’s expectations in the near future.
Remember, our C2SC Heat Index is showing the current rally is nearly 300%+ above normal upper ranges. How far will it go? We really don’t know how far this could continue to rally or where the ultimate peak is going to set up. All we can suggest at this point in time is that we’ve entered uncharted waters and we don’t have many historical reference points to use for our analysis. All we can do is ride this trend out using our advanced price modeling systems and watch for signs of a breakdown in support and correlative assets (like Precious Metals, Bonds, Utilities, and the Fed Funds Rate).
If the Fed suddenly starts making moves to address pending inflation, then we may see some big volatility hit the markets. We feel the Fed will slowly move to address inflationary concerns over the next 12+ months – not move in a sudden, aggressive manner.
We need to watch how commodities continue to rally and how consumers react to these inflationary price concerns. If global consumers suddenly shift away from spending as prices continue to rally, then we may start to see a dynamic shift in how the economy continues to expand/recover. Consumers become very protecting of capital/resources when an economy shifts from expansion to contraction.
Either way, there are going to be some really big trends in 2021 and 2022 for traders/investors. This is the type of setup that can make fortunes for skilled traders/investors.
The bigger question is, will you be ready to jump into the strongest sectors when this downside trending ends? Do you know which sectors present the best opportunities for future profits? You can learn more about how I identify and trade the markets by watching my FREE step-by-step guide to finding and trading the best sectors.
Don’t miss the opportunities in the broad market sectors over the next 6+ months. Staying ahead of these sector trends is going to be key to developing continued success in these markets. My BAN Trader Pro newsletter service does all the work for you with daily pre-market reports, proprietary research, and trade alerts. More frequent or experienced traders have been killing it trading options, ETFs, and stocks using my BAN Hotlist ranking the hottest ETFs, which is updated daily for my premium subscribers. Sign up today!
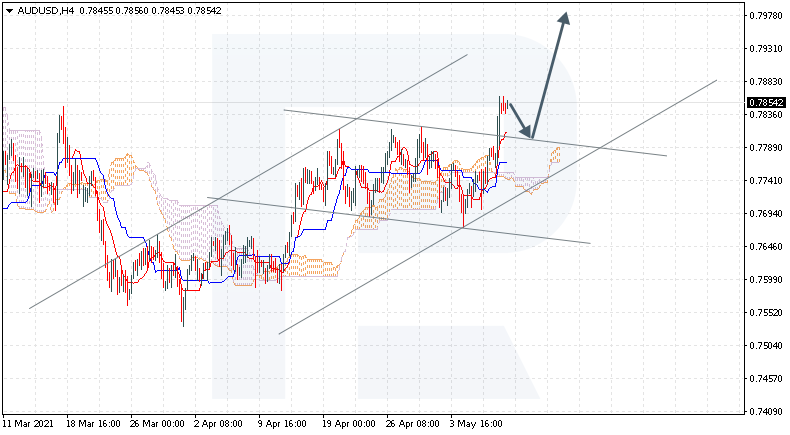
AUDUSD is trading at 0.7854; the instrument is moving above Ichimoku Cloud, thus indicating an ascending tendency. The markets could indicate that the price may test Tenkan-Sen and Kijun-Sen at 0.7795 and then resume moving downwards to reach 0.7985. Another signal in favor of a further uptrend will be a rebound from the upside border of the descending channel, which was earlier broken by bulls to the upside. However, the bullish scenario may no longer be valid if the price breaks the cloud’s downside border and fixes below 0.7675. In this case, the pair may continue falling towards 0.7585.
NZDJPY, “New Zealand Dollar vs Japanese Yen”
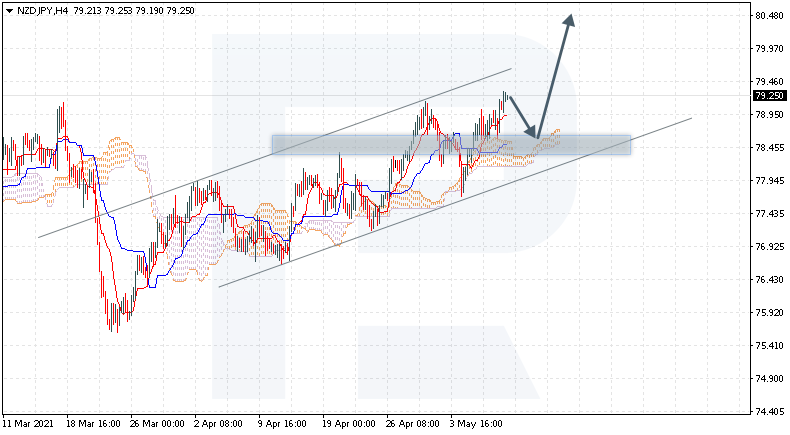
NZDJPY is trading at 79.25; the instrument is moving above Ichimoku Cloud, thus indicating an ascending tendency. The markets could indicate that the price may test the cloud’s upside border at 78.45 and then resume moving upwards to reach 80.55. Another signal in favor of a further uptrend will be a rebound from the support level. However, the bullish scenario may no longer be valid if the price breaks the cloud’s downside border and fixes below 77.95. In this case, the pair may continue falling towards 76.85.
USDCAD, “US Dollar vs Canadian Dollar”
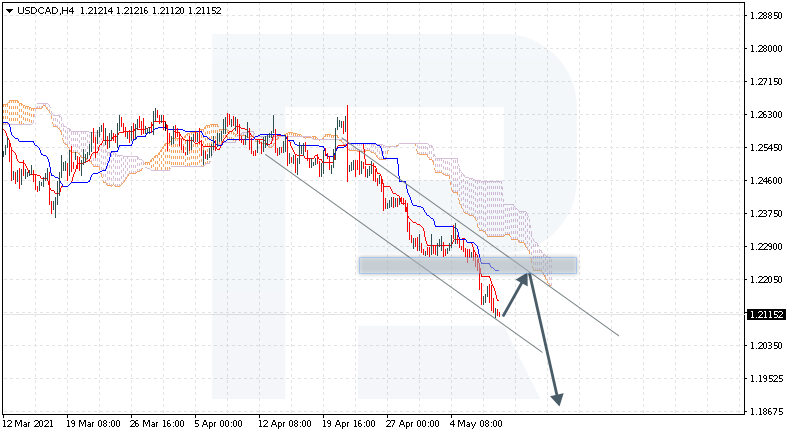
USDCAD is trading at 1.2115; the instrument is moving below Ichimoku Cloud, thus indicating a descending tendency. The markets could indicate that the price may test Tenkan-Sen and Kijun-Sen at 1.2215 and then resume moving downwards to reach 1.1865. Another signal in favor of a further downtrend will be a rebound from the descending channel’s upside border. However, the bearish scenario may no longer be valid if the price breaks the cloud’s upside border and fixes above 1.2315. In this case, the pair may continue growing towards 1.2405.
Attention! Forecasts presented in this section only reflect the author’s private opinion and should not be considered as guidance for trading. RoboForex LP bears no responsibility for trading results based on trading recommendations described in these analytical reviews.
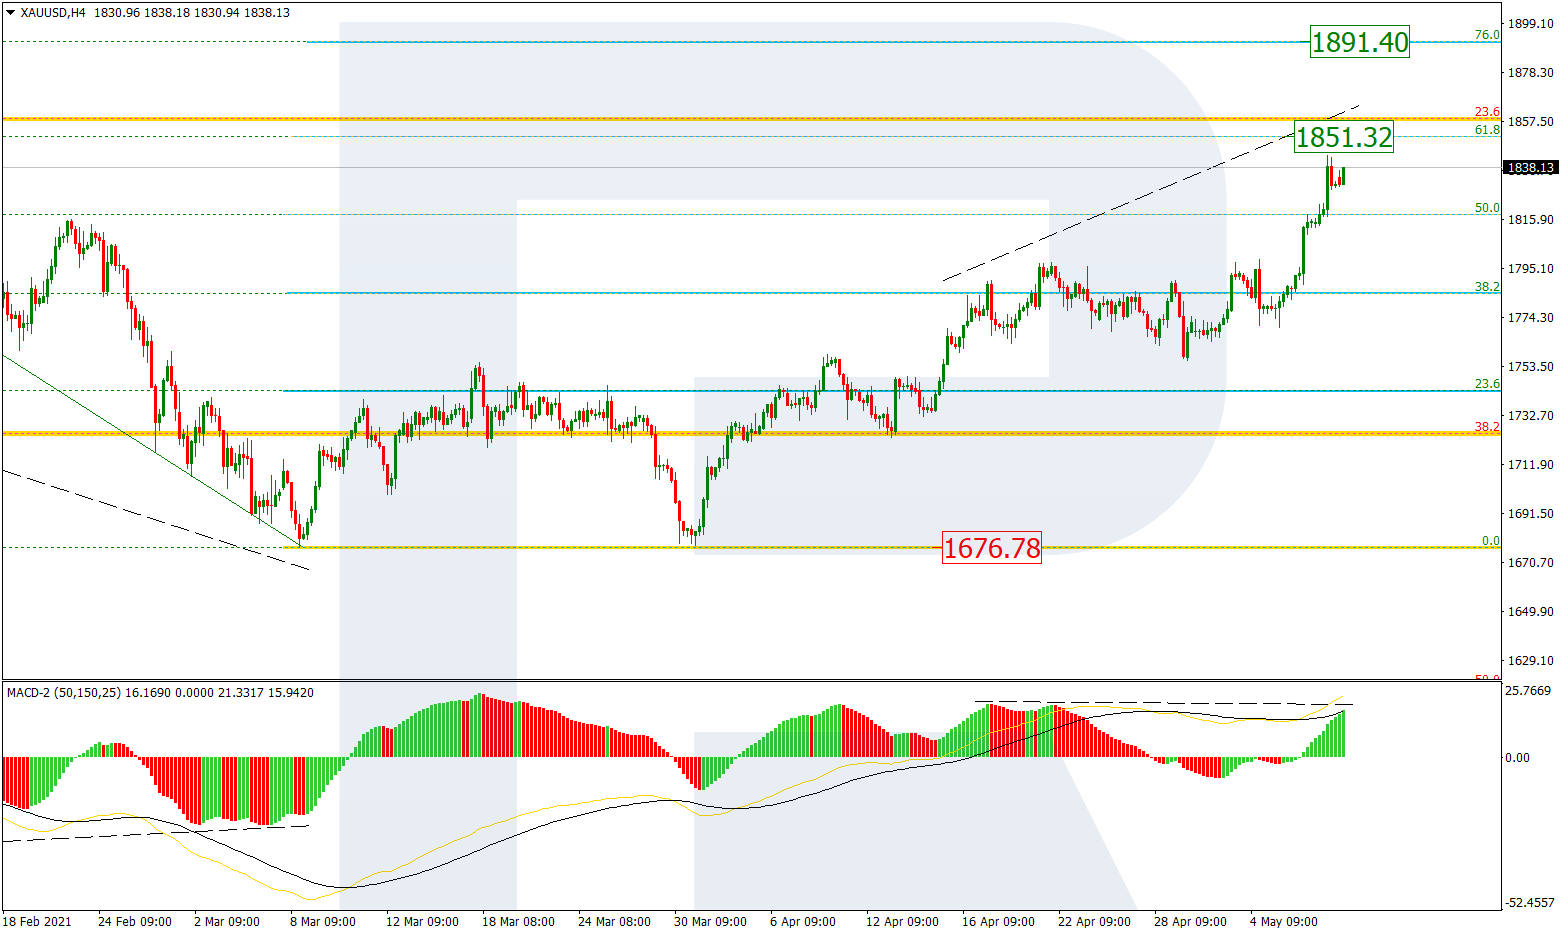
As we can see in the H4 chart, the uptrend continues. After breaking 50.0% fibo, XAUUSD is approaching 61.8% fibo at 1851.32 and may later break this level as well. In this case, the next upside target will be 76.0% fibo at 1891.40. However, despite the fact that the current uptrend is quite stable, there is a divergence on MACD, which may hint at a possible reversal. The key support is the low at 1676.78.
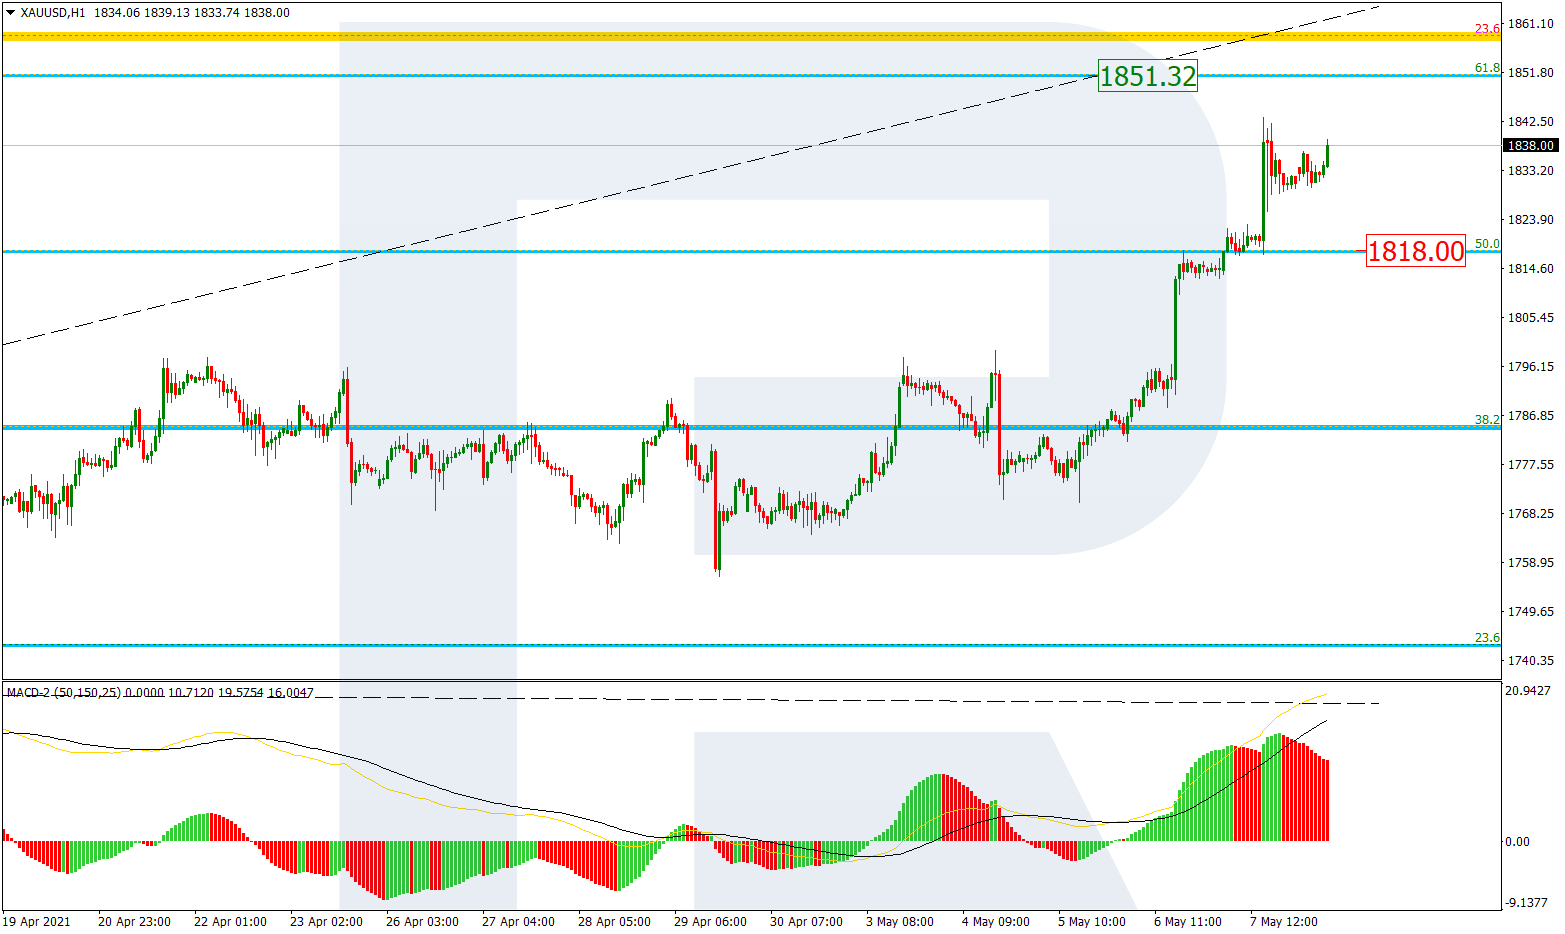
In the H1 chart, after completing the ascending impulse, the pair is forming a short-term consolidation range and may later resume growing to reach 61.8% fibo at 1851.32. However, if this range transforms into a correction, the target will be at 1818.00.
USDCHF, “US Dollar vs Swiss Franc”
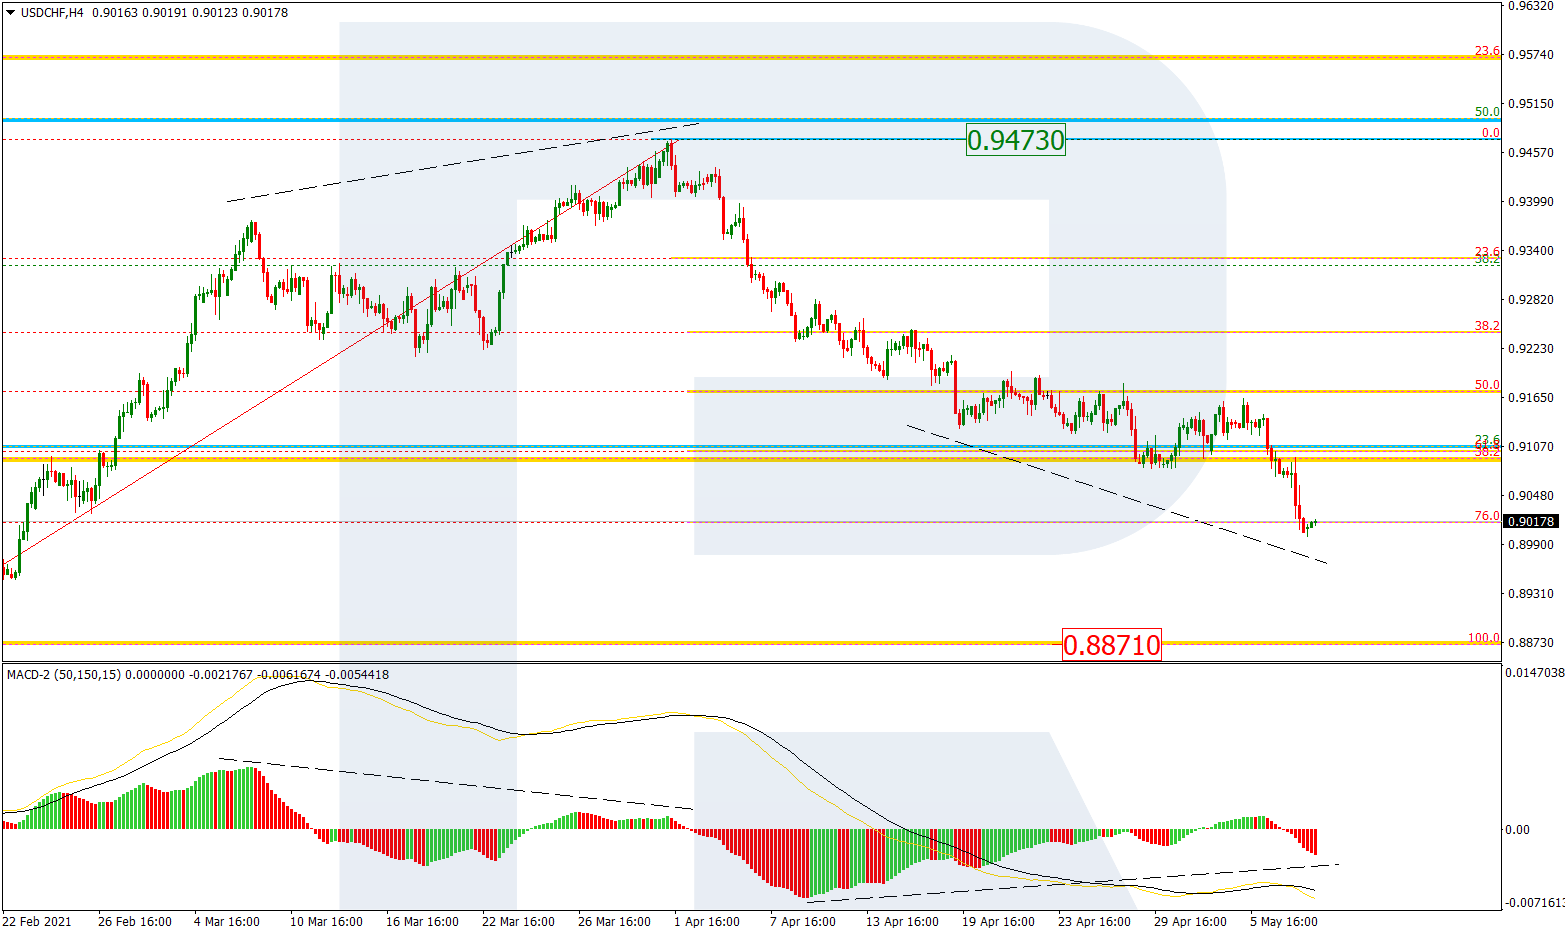
In the H4 chart, after finishing the short-term pullback, the asset is forming a new descending impulse, which has already reached 76.0% fibo. At the same time, there is a convergence on MACD, which may hint at a correctional uptrend soon. Still, the key downside target remains the fractal low at 0.8871.
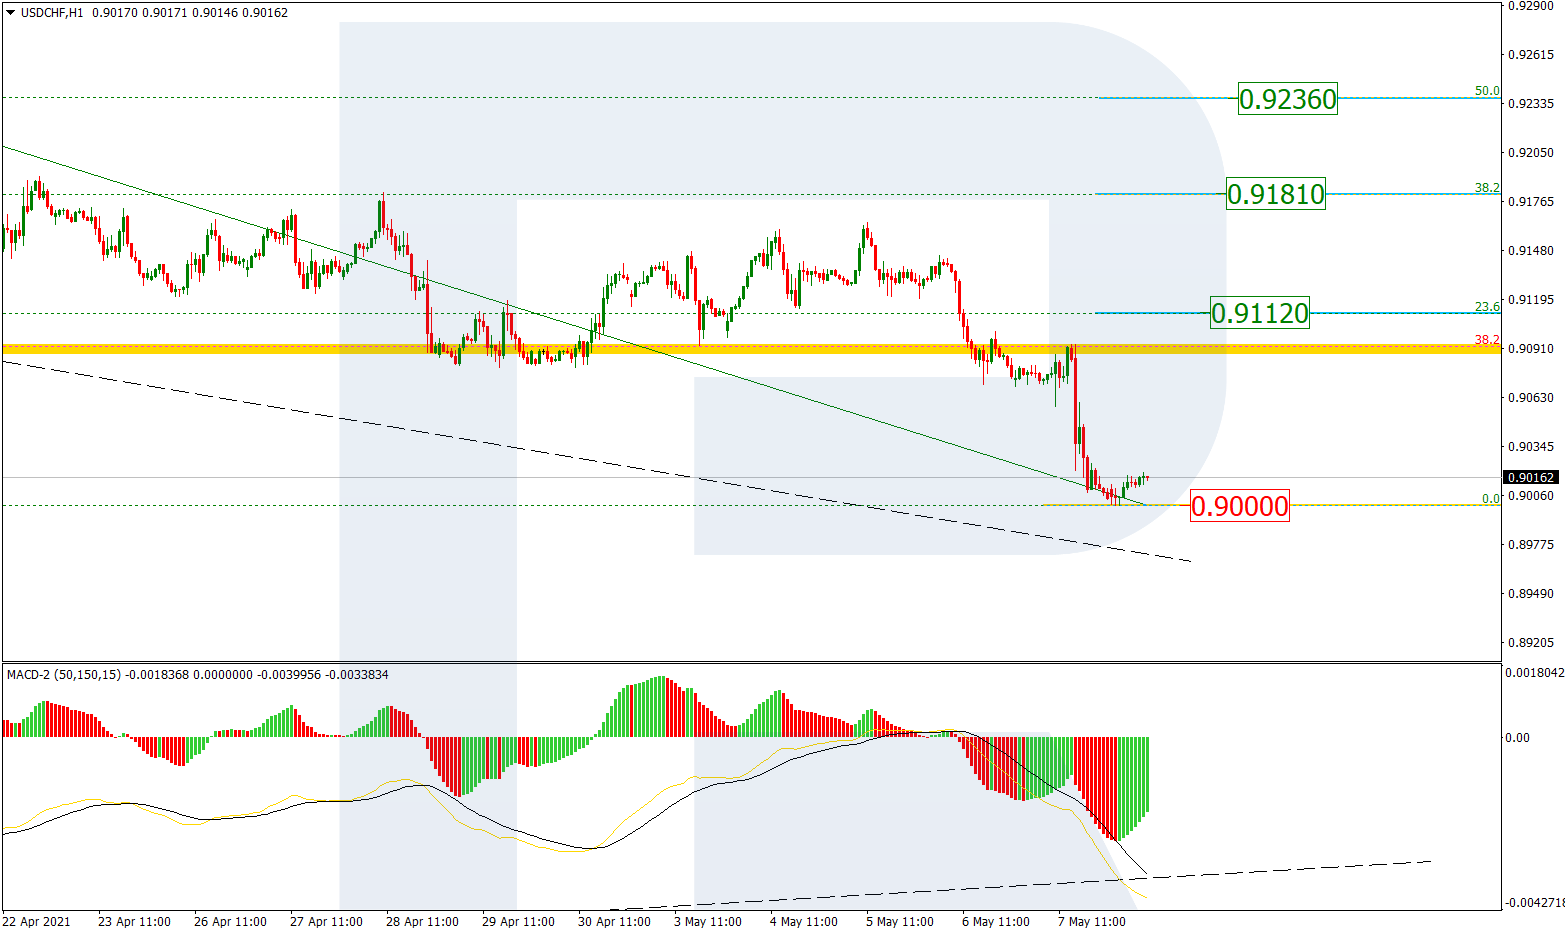
The H1 chart shows potential correctional targets after a convergence on MACD – 23.6%, 38.2%, and 50.0% fibo at 0.9112, 0.9181, and 0.9236 respectively. The local support is the low at 0.9000, a breakout of which may lead to a further downtrend.
Attention! Forecasts presented in this section only reflect the author’s private opinion and should not be considered as guidance for trading. RoboForex LP bears no responsibility for trading results based on trading recommendations described in these analytical reviews.






 Article by




 Source: Daily chart of the EURUSD of the Admiral Markets MetaTrader 5 platform from January 23, 2020 to May 10, 2021. Taken on May 10 at 12:45 CEST. Note: Past performance is not a reliable indicator of future results, or future performance.
 Source: GBPUSD weekly chart from Admiral Markets MetaTrader 5 platform from September 28, 2014 to May 10, 2021. Taken on May 10 at 1:10 p.m. CEST Note: Past performance is not a reliable indicator of future results, or future performance.
 Source: Weekly USDJPY chart from Admiral Markets MetaTrader 5 platform from December 14, 2014 to May 10, 2021. Taken on May 10 at 1:15 PM CEST. Note: Past performance is not a reliable indicator of future results, or future performance.