– Elon Musk’s sudden u-turn regarding Bitcoin on Twitter – which sent prices plummeting by 15% – could be more of a PR stunt than anything else, says the CEO of one of the world’s largest independent financial and fintech organizations.
The observation from Nigel Green, deVere Group’s chief executive, comes as the Tesla billionaire boss said the company will halt sales of cars using Bitcoin due to the environmental impact of mining that cryptocurrency.
Mr Green comments: “Musk is once again flexing his influencer muscles on social media. In a somewhat Trumpian move, he’s taken to Twitter to announce a major u-turn.
“Just a few months ago, to much fanfare, Musk announced that his company Tesla had bought $1.5 billion worth of Bitcoin and that it would accept it as payment for cars. The move was one of the reasons the cryptocurrency’s price has soared this year.”
He continues: “All of a sudden, he’s not so keen due to environmental concerns. But why now? Those issues surrounding the environmental impact have not come up in the last few months? Did Musk seriously not know about them before he bought $1.5 billion Bitcoin?
“There are serious and important environmental matters which urgently need to be addressed about Bitcoin mining. Any action to support the further transition to fully using sustainable energy must be championed – it is something I whole-heartedly support.
“According to research 76% of cryptocurrency miners currently use electricity from renewable energy sources as part of their energy mix. Which begs the question: why, with all his immense resources and power is Musk not able to ensure that all his Bitcoin is mined this way?
“In addition, why is he not using this influence to further advance and incentivize renewable energy for cryptocurrencies – something that Twitter founder Jack Dorsey has previously tweeted about and with which Musk agreed on the social platform.”
Could there also be another driver behind the Bitcoin move?
“Musk likes being known as being a contrarian. He likes to go against the crowd in a high-profile way. Is his waning interest in Bitcoin at a time when huge amounts of institutional investment from major Wall Street banks is pouring in, part of this?” asks Mr Green.
With the fundamentals of Bitcoin – the very ones that are attracting enormous institutional and retail interest remaining unchanged – many investors are likely to use this current price drop from recent all-time highs as an important buying opportunity.
Previously the deVere CEO observed that inherent traits of cryptocurrencies are ever-more attractive. “These characteristics include that they’re borderless, making them perfectly suited to a globalized world of commerce, trade, and people; that they are digital, making them an ideal match to the increasing digitalization of our world; and that demographics are on the side of cryptocurrencies as younger people are more likely to embrace them than older generations.”
Mr Green concludes: “Clearly, Musk still believes in Bitcoin – he didn’t sell any – and I now hope he will use not just words but his immense resources to further expediate the transition to sustainable energy for crypto mining.”
About:
deVere Group is one of the world’s largest independent advisors of specialist global financial solutions to international, local mass affluent, and high-net-worth clients. It has a network of more than 70 offices across the world, over 80,000 clients and $12bn under advisement.
· There are no easy solutions to shoring up U.S. national cyber defenses.
· Software supply chains and private sector infrastructure companies are vulnerable to hackers.
· Many U.S. companies outsource software development because of a talent shortage, and some of that outsourcing goes to companies in Eastern Europe that are vulnerable to Russian operatives.
· U.S. national cyber defense is split between the Department of Defense and the Department of Homeland Security, which leaves gaps in authority.
The ransomware attack on Colonial Pipeline on May 7, 2021, exemplifies the huge challenges the U.S. faces in shoring up its cyber defenses. The private company, which controls a significant component of the U.S. energy infrastructure and supplies nearly half of the East Coast’s liquid fuels, was vulnerable to an all-too-common type of cyber attack. The FBI has attributed the attack to a Russian cybercrime gang. It would be difficult for the government to mandate better security at private companies, and the government is unable to provide that security for the private sector.
Similarly, the SolarWinds hack, one of the most devastating cyber attacks in history, which came to light in December 2020, exposed vulnerabilities in global software supply chains that affect government and private sector computer systems. It was a major breach of national security that revealed gaps in U.S. cyber defenses.
These gaps include inadequate security by a major software producer, fragmented authority for government support to the private sector, blurred lines between organized crime and international espionage, and a national shortfall in software and cybersecurity skills. None of these gaps is easily bridged, but the scope and impact of the SolarWinds attack show how critical controlling these gaps is to U.S. national security.
The SolarWinds breach, likely carried out by a group affiliated with Russia’s FSB security service, compromised the software development supply chain used by SolarWinds to update 18,000 users of its Orion network management product. SolarWinds sells software that organizations use to manage their computer networks. The hack, which allegedly began in early 2020, was discovered only in December when cybersecurity company FireEye revealed that it had been hit by the malware. More worrisome, this may have been part of a broader attack on government and commercial targets in the U.S.
The Biden administration is preparing an executive order that is expected to address these software supply chain vulnerabilities. However, these changes, as important as they are, would probably not have prevented the SolarWinds attack. And preventing ransomware attacks like the Colonial Pipeline attack would require U.S. intelligence and law enforcement to infiltrate every organized cyber criminal group in Eastern Europe.
Supply chains, sloppy security and a talent shortage
The vulnerability of the software supply chain – the collections of software components and software development services companies use to build software products – is a well-known problem in the security field. In response to a 2017 executive order, a report by a Department of Defense-led interagency task force identified “a surprising level of foreign dependence,” workforce challenges and critical capabilities such as printed circuit board manufacturing that companies are moving offshore in pursuit of competitive pricing. All these factors came into play in the SolarWinds attack.
Vinoth Kumar reported that the password for the software company’s development server was allegedly “solarwinds123,” an egregious violation of fundamental standards of cybersecurity. SolarWinds’ sloppy password management is ironic in light of the Password Management Solution of the Year award the company received in 2019 for its Passportal product.
In a blog post, the company admitted that “the attackers were able to circumvent threat detection techniques employed by both SolarWinds, other private companies, and the federal government.”
The larger question is why SolarWinds, an American company, had to turn to foreign providers for software development. A Department of Defense report about supply chains characterizes the lack of software engineers as a crisis, partly because the education pipeline is not providing enough software engineers to meet demand in the commercial and defense sectors.
There’s also a shortage of cybersecurity talent in the U.S. Engineers, software developers and network engineers are among the most needed skills across the U.S., and the lack of software engineers who focus on the security of software in particular is acute.
Fragmented authority
Though I’d argue SolarWinds has much to answer for, it should not have had to defend itself against a state-orchestrated cyber attack on its own. The 2018 National Cyber Strategy describes how supply chain security should work. The government determines the security of federal contractors like SolarWinds by reviewing their risk management strategies, ensuring that they are informed of threats and vulnerabilities and responding to incidents on their systems.
However, this official strategy split these responsibilities between the Pentagon for defense and intelligence systems and the Department of Homeland Security for civil agencies, continuing a fragmented approach to information security that began in the Reagan era. Execution of the strategy relies on the DOD’s U.S. Cyber Command and DHS’s Cyber and Infrastructure Security Agency. DOD’s strategy is to “defend forward”: that is, to disrupt malicious cyber activity at its source, which proved effective in the runup to the 2018 midterm elections. The Cyber and Infrastructure Security Agency, established in 2018, is responsible for providing information about threats to critical infrastructure sectors.
Neither agency appears to have sounded a warning or attempted to mitigate the attack on SolarWinds. The government’s response came only after the attack. The Cyber and Infrastructure Security Agency issued alerts and guidance, and a Cyber Unified Coordination Group was formed to facilitate coordination among federal agencies.
These tactical actions, while useful, were only a partial solution to the larger, strategic problem. The fragmentation of the authorities for national cyber defense evident in the SolarWinds hack is a strategic weakness that complicates cybersecurity for the government and private sector and invites more attacks on the software supply chain.
A wicked problem
National cyber defense is an example of a “wicked problem,” a policy problem that has no clear solution or measure of success. The Cyberspace Solarium Commission identified many inadequacies of U.S. national cyber defenses. In its 2020 report, the commission noted that “There is still not a clear unity of effort or theory of victory driving the federal government’s approach to protecting and securing cyberspace.”
Many of the factors that make developing a centralized national cyber defense challenging lie outside of the government’s direct control. For example, economic forces push technology companies to get their products to market quickly, which can lead them to take shortcuts that undermine security. Legislation along the lines of the Gramm-Leach-Bliley Act passed in 1999 could help deal with the need for speed in software development. The law placed security requirements on financial institutions. But software development companies are likely to push back against additional regulation and oversight.
The Biden administration appears to be taking the challenge seriously. The president has appointed a national cybersecurity director to coordinate related government efforts. It remains to be seen whether and how the administration will address the problem of fragmented authorities and clarify how the government will protect companies that supply critical digital infrastructure. It’s unreasonable to expect any U.S. company to be able to fend for itself against a foreign nation’s cyberattack.
Steps forward
In the meantime, software developers can apply the secure software development approach advocated by the National Institute of Standards and Technology. Government and industry can prioritize the development of artificial intelligence that can identify malware in existing systems. All this takes time, however, and hackers move quickly.
Finally, companies need to aggressively assess their vulnerabilities, particularly by engaging in more “red teaming” activities: that is, having employees, contractors or both play the role of hackers and attack the company.
Recognizing that hackers in the service of foreign adversaries are dedicated, thorough and not constrained by any rules is important for anticipating their next moves and reinforcing and improving U.S. national cyber defenses. Otherwise, Colonial Pipeline is unlikely to be the last victim of a major attack on U.S. infrastructure and SolarWinds is unlikely to be the last victim of a major attack on the U.S. software supply chain.
This is an updated version of an article originally published on February 9, 2021.
But climate change is not the only global environmental threat that demands attention. Scientists widely agree that loss of wildlife and the natural environment is an equally urgent crisis. Some argue that biodiversity loss threatens to become Earth’s sixth mass extinction. But unlike efforts to fight climate change – which center on clear, measurable goals to reduce greenhouse gas emissions – there is no globally accepted metric for saving biodiversity.
As an expert on budgeting and public finance, I know that governments and private businesses alike pay much more attention to resources when they have a well-defined price tag. I believe that overhauling society’s concept of wealth to include “natural capital” – the value nature provides to humans – is a critical step for slowing and reversing the loss of precious ecosytems.
Economist Dieter Helm offers strategies for establishing natural capital policy.
What is natural capital?
Natural capital can be defined as the world’s stocks of natural assets – soil, air, water, grasslands, forests, wetlands, rocks and minerals – and all of its living things, from mammals and fish to plants and microbes. Conservation experts estimate that these resources contribute more than US$125 trillion to the global economy every year.
But human societies don’t formally recognize the economic value of these services. This oversight encourages people to recklessly deplete the natural environment.
A recent review of the economics of biodiversity, commissioned by the U.K. government and led by Cambridge University economist Sir Parth Dasgupta, warns that human prosperity is growing at a “devastating cost to nature” and estimates that it would take 1.6 Earths to maintain the world’s current living standards. The report calls for the world to treat nature like an asset to be reported in financial statements and national accounts.
The Capitals Coalition, a global consortium of 380 initiatives and businesses, is trying to “change the math.” The organization seeks to persuade at least half of the world’s businesses, financial institutions and governments to incorporate natural capital into their decision-making by 2030.
Globally, researchers estimate that public and private spending that harms natural assets is significantly higher than spending to protect and enhance them. Dasgupta Review, CC BY-ND
Valuing ecosystems
Current accounting methods used by corporations and governments largely ignore what ecosystems and their services contribute to the economy and to human social well-being, jobs and livelihoods. As a consequence, modern societies spend far more on investments that deplete or exploit natural assets than they do to preserve them.
Under the current model, short-term economic gains typically win out against longer-term ecological benefits. For example, failing to maintain forests can spark wildfires. And constructing homes on fragile coastal wetlands can erode soil and reduce fish stocks, destroying local communities.
A recent study by the Paulson Institute, a research institute founded by former U.S. Treasury Secretary Henry Paulson, estimated that global investments that degrade nature exceed conservation efforts by $600 billion to $824 billion per year.
Natural capital accounting would require businesses and governments to calculate how human activity affects nature, much as they assess depreciation of buildings or machinery. Analyzed in this way, nature is a financial asset, and damage to it becomes a liability. This approach creates incentives to conserve natural resources and restore others that have been degraded or depleted.
Global recognition of this issue is growing. In March 2021 the United Nations updated a statistical framework for standardizing ecosystem accounting, which was first published in 2012. These guidelines help countries track changes in ecosystems and their services and provide leaders with a baseline with which to compare their stocks and flows when making policy decisions.
Some 90 countries have adopted this System of Environmental Economic Accounting and produced baseline “national capital accounts.” They include European Union members, Australia, Canada, the United Kingdom and more than 40 developing countries. The U.S. is planning to implement this approach but has not done so yet.
Assessing nature’s value
Placing values on natural assets is really no different from government assessments of the benefits of new roads, bridges and other infrastructure. People intuitively understand that natural resources are precious. And the COVID-19 pandemic has made clear how closely human health is intertwined with the health of the planet.
The U.S has lost decades of potential progress since Congress suspended fledgling efforts by the Bureau of Economic Analysis to develop environmental accounting methods in 1995. Researchers at the U.S. Geological Survey and other federal agencies are now urging the U.S. to adopt national capital accounts using the U.N. framework.
In contrast, the U.K. created public environmental accounts and set up a Natural Capital Committee in 2012, led by its finance ministry, to help corporations develop natural capital accounts. Today, the U.K. maintains these accounts, which capture data on the size, condition, quantity and value of habitats and ecosystem services. President Biden could empower the U.S. Treasury Department to spearhead a similar initiative.
Adopting metrics to measure and track the benefits people receive from wildlife and ecosystems would clarify how human activities affect nature and show how much investment is needed to reverse humanity’s current destructive trajectory. Conservation advocates will be much better positioned to protect our planet’s resources with a strong balance sheet to back it up.
This simple, corrective Elliott price pattern helps you anticipate reversals instead of getting run over by them
By Elliott Wave International
Often, as traders and investors we start off with an open mind about playing the field, so to speak. We watch the news, listen to friends and colleagues — and we try to apply what’s known as “fundamental” market analysis to make our trading decisions.
Soon, though, we start to realize that the “bullet-proof” logic of “fundamental” analysis is not Kevlar, but a piece of cardboard. We see markets fall after good news; rally after bad; and go sideways, defying both bulls and bears.
That’s when we realize that trading is not as easy as it seems.
At that point, serious traders start to turn to technical market analysis. It doesn’t look at the news, or events, or politics, or what the Fed Chairman had for breakfast. It doesn’t even look at the name besides the ticker symbol. It looks at the price charts, at the market itself, to determine internal strength, momentum — and, ultimately, the trend.
One of the leading technical models today is Elliott wave analysis, which teaches that market prices are not random, but patterned. These patterns are constantly unfolding in all liquid markets, on all time frames — bullish, bearish, lasting over the next few minutes or the next few months.
Take, for instance this chart below of a venerable Big Board stock, global timberland producer and real estate investment trust, Weyerhaeuser Company (ticker symbol WY) — in May 2020, at the start of the pandemic.
If you’d been tied to the name Weyerhaeuser or the news surrounding its name at that time, you would’ve likely done one of two things: Shorted the stock or made a hard pass talk to the hand.
Remember, this was May 2020. The world was two months into the worst pandemics in centuries. The global economy had come to a crashing halt, and the future of real estate seemed doomed.
In fact, the mainstream consensus about companies associated with the constructing, buying, and selling of property was terminal. On May 1, 2020, Motley Fool described a single-day bloodbath in Weyerhaeuser and wrote:
**”WY plunged 15% in a matter of seconds… Any company’s cutting its dividend is unwelcome, but a REIT’s doing so is particularly bad since the REIT structure was created specifically to pass income on to shareholders.”
But on May 26, 2020, Elliott Wave International’s Trader’s Classroom editor Jeffrey Kennedy showed subscribers this bullish chart of Weyerhaeuser:
Why was Trader’s Classroom turning bullish when the rest of the world all but wrote WY off?
Because the decline in WY had a signature look of one key Elliott wave pattern: a zigzag. Here, the Elliott Wave Principle — Key to Market Behavior offers this definition and idealized diagram:
**”A single zigzag is a simple three-wave pattern labeled A-B-C. The subwave sequence is 5-3-5, and the top of wave B is noticeably lower than the start of wave A.”
Zigzags are corrections — i.e., countertrend moves, and signify a temporary break in the larger trend. The significance of WY’s completion of this countertrend move was clear: The stock was headed for a powerful rebound.
Press “play” to listen to Jeffrey Kennedy’s analysis of WY from his May 26, 2020 Trader’s Classroom video lesson in which he calls for a “new bull market.”
The next chart captures what followed: WY indeed caught a powerful upwind and rode the current to its highest price level in its 121-year history, a comeback that shocked much of the mainstream financial world and those traders betrothed to a narrow view of market behavior.
In the end, Elliott wave analysis proves that finding opportunity in financial markets is truly unlimited.
It starts with learning the five core Elliott wave patterns. Once you identify a pattern using the Wave Principle, you can then confidently anticipate the direction prices will most likely move next.
The best way to learn these patterns is by reading the “bible” of Elliott wave theory — the book Elliott Wave Principle: Key to Market Behavior.
You can read the entire online version of the book for free by becoming a member of Club EWI, the world’s largest Elliott wave educational community. Club EWI gives you free access to timeless educational resources like lessons, eBooks, seminars, video tutorials, and more — meticulously curated to create the most comprehensive Elliott wave learning experience anywhere.
This article was syndicated by Elliott Wave International and was originally published under the headline . EWI is the world’s largest market forecasting firm. Its staff of full-time analysts led by Chartered Market Technician Robert Prechter provides 24-hour-a-day market analysis to institutional and private investors around the world.
In the H4 chart, after breaking its consolidation range to the upside, GBPUSD is forming a steady rising impulse, which may be heading to reach the local and key highs at 1.4241 and 1.4376 respectively. However, there might be another scenario implying a new descending wave, which is confirmed by a divergence on MACD. If it happens, the asset will continue falling to reach 38.2%, 50.0%, and 61.8% fibo at 1.3643, 1.3459, and 1.3273 respectively.
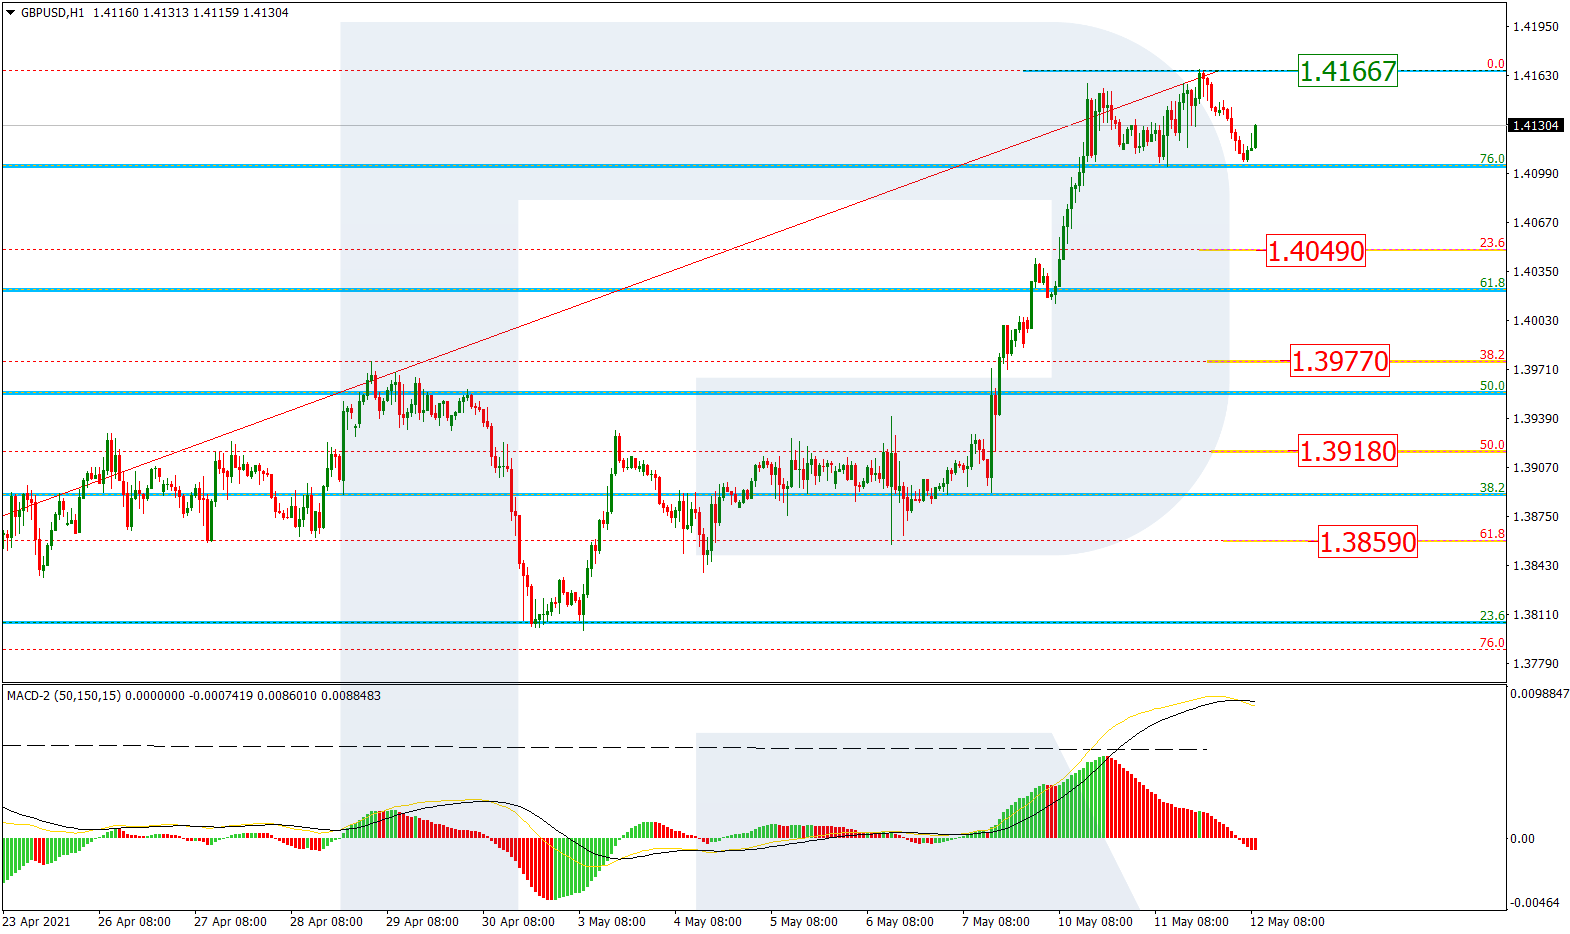
The H1 chart shows the short-term correctional targets after a divergence on MACD – 23.6%, 38.2%, 50.0%, and 61.8% fibo at 1.4049, 1.3977, 1.3918, and 1.3859 respectively. On the other hand, a breakout of the current high at 1.4166 will lead to a further uptrend.
EURJPY, “Euro vs. Japanese Yen”
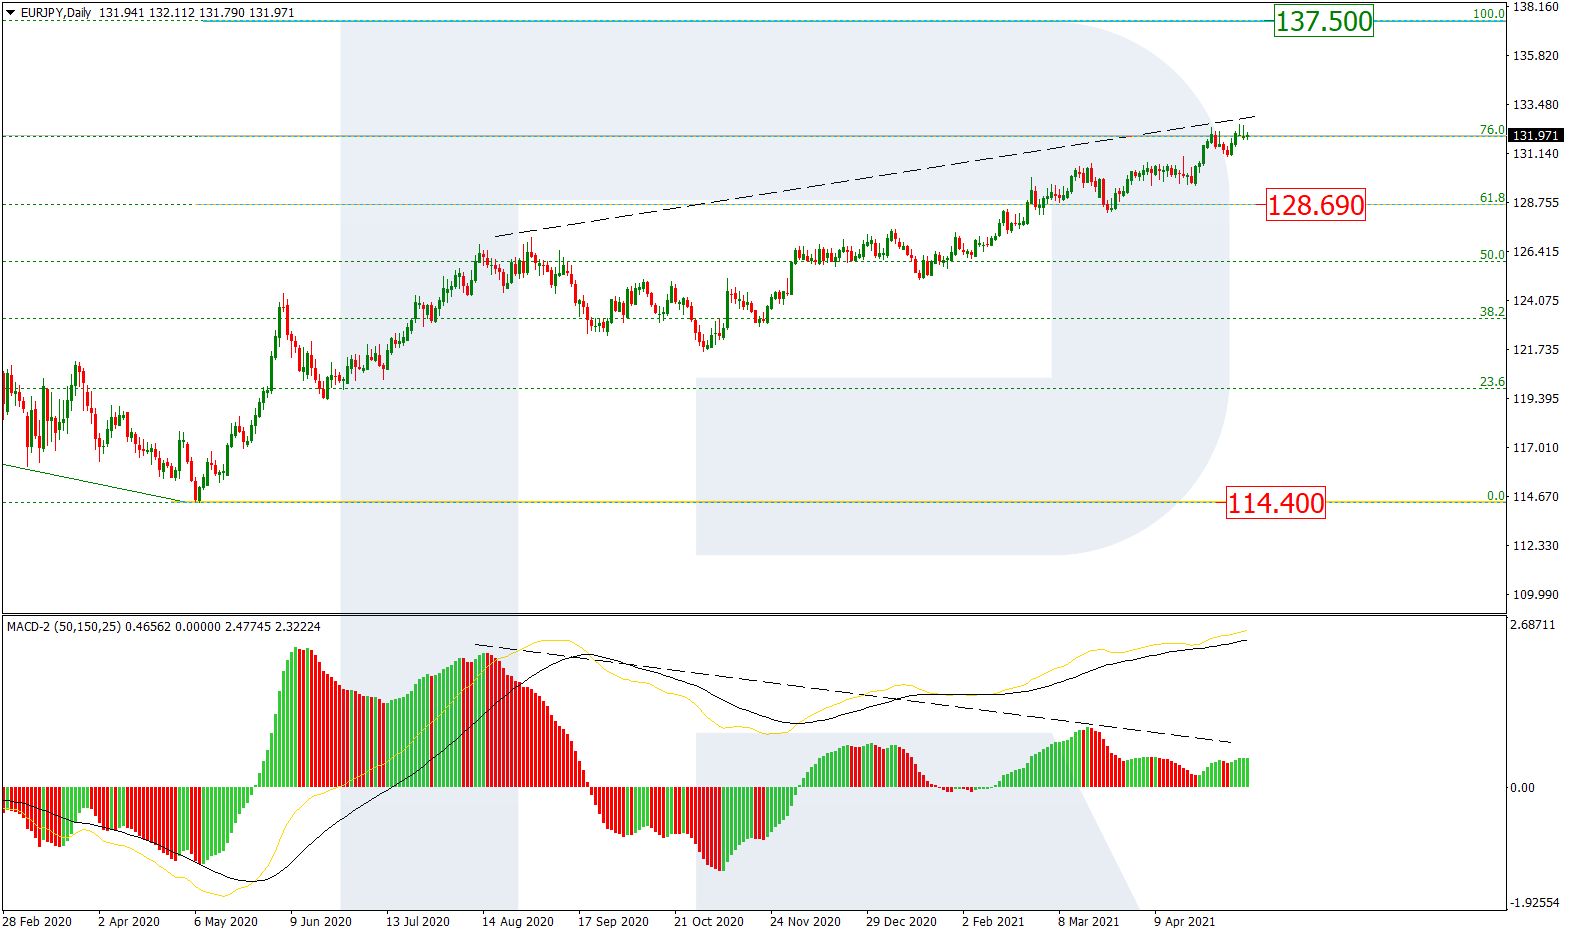
In the daily chart, EURJPY is still trading not far from the long-term 76.0% fibo. A further test of this level and a divergence on MACD may hint at a possible correctional decline soon with the short-term target at the support at 61.8% fibo (128.69). After finishing the correction, the instrument may form a new rising impulse towards the high at 137.50.
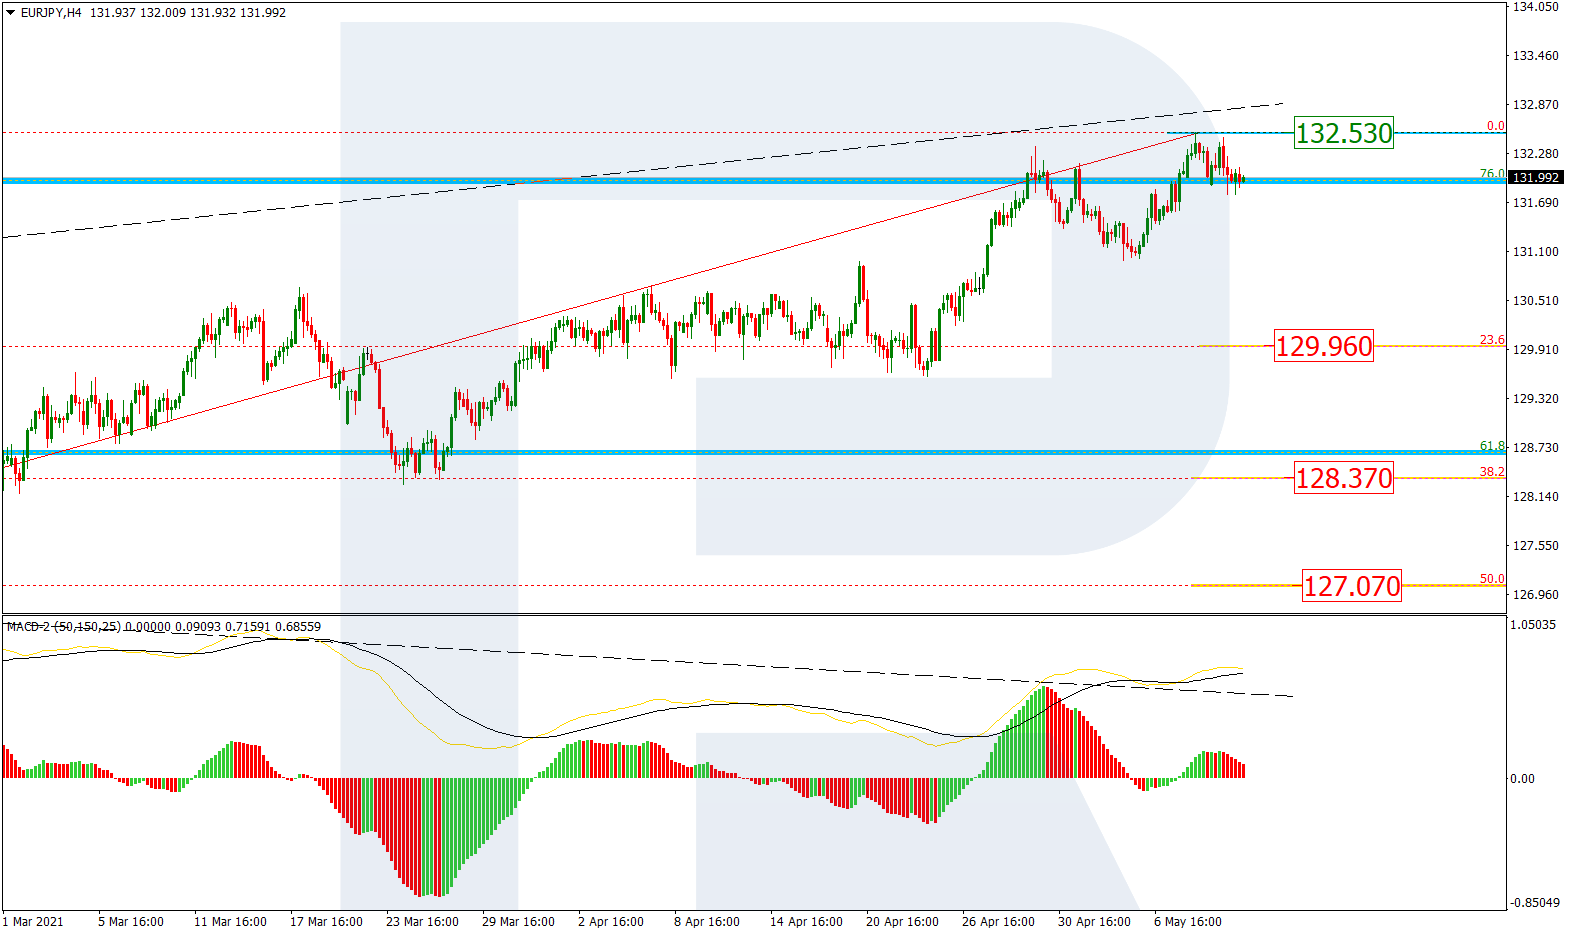
The H4 chart shows possible correctional targets after a divergence on MACD – 23.6%, 38.2%, and 50.0% fibo at 129.96, 128.37, and 127.07 respectively. The resistance is the high at 132.53.
Attention! Forecasts presented in this section only reflect the author’s private opinion and should not be considered as guidance for trading. RoboForex LP bears no responsibility for trading results based on trading recommendations described in these analytical reviews.
– A growing number of under 30s are seeking financial advice, according to data released by one of the world’s largest independent financial advisory and fintech organizations.
deVere Group has revealed that there has been a 54% year-on-year jump in the number of inquiries from potential clients under the age of 30 who are seeking to work with a professional adviser to devise and implement a financial planning strategy.
Nigel Green, chief executive and founder of deVere Group, comments: “The sharp increase in the number of under 30s seeking out advice, once again, debunks the myth that younger generations are not interested in building a plan for their long-term financial security.
“It would be a reasonable assumption to make that the year-on-year increase has been largely driven by the pandemic.
“It has brought into all-too-real focus how things can quickly change, how important it is to have a back-up/emergency plan, and value more than ever what really matters to them. For most, this includes ensuring that they can enjoy the opportunities and lifestyle that they desire.”
In March this year, a deVere poll of 450 clients found that seven out of 10 people will not splurge excessive savings accumulated over the pandemic.
When asked ‘Are you likely to spend the majority of the extra money you have managed to save over the last 12 months?’ 72% responded ‘no’, 16% said ‘yes’ and 12% ‘did not know.’
Mr Green continues: “Whilst it’s a fool’s game to generalize about any given cohort, anecdotally, our advisers who are working with the under 30s report that there are some definite trends.
“Perhaps unsurprisingly, more than other generations, the under 30s – who are ‘digital natives’ having grown up under the ubiquitous influence of the internet and other technologies – demand digital solutions such as fintech apps alongside their personalized financial advice.
“This gives them immediate, on-the-go, low-cost access to, use and management of their money.”
Another trend, says the deVere CEO, is impactful saving and investing.
“Our advisers say that, typically, younger people want to use their savings and their investments not only to improve their own lifestyles but for the betterment of their communities and the environments.
“Having more control over their financial affairs is a critical part of their wider activism on issues such as human rights and climate change.” Mr Green concludes: “Perhaps more than ever, the under 30s are showing a desire to be financially resilient and put their long-term financial goals at the heart of their decision-making process.
“I believe that this ‘think about tomorrow first’ attitude is likely to be a permanent phenomenon due to recent seismic cultural, social and economic shifts.”
About:
deVere Group is one of the world’s largest independent advisors of specialist global financial solutions to international, local mass affluent, and high-net-worth clients. It has a network of more than 70 offices across the world, over 80,000 clients and $12bn under advisement.
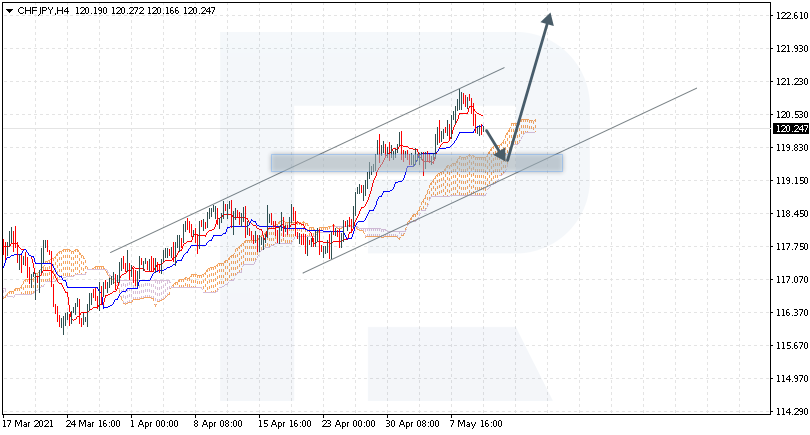
CHFJPY is trading at 120.24; the instrument is moving above Ichimoku Cloud, thus indicating an ascending tendency. The markets could indicate that the price may test the cloud’s downside border at 119.75 and then resume moving upwards to reach 122.65. Another signal in favor of a further uptrend will be a rebound from the support level. However, the bullish scenario may no longer be valid if the price breaks the cloud’s downside border and fixes below 118.55. In this case, the pair may continue falling towards 117.65.
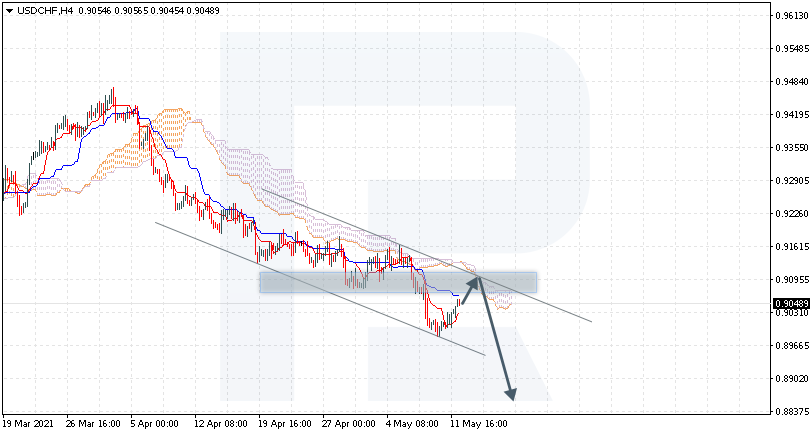
USDCHF, “US Dollar vs Swiss Franc”
USDCHF is trading at 0.9048; the instrument is moving below Ichimoku Cloud, thus indicating a descending tendency. The markets could indicate that the price may test the cloud’s downside border at 0.9095 and then resume moving downwards to reach 0.8875. Another signal in favor of a further downtrend will be a rebound from the descending channel’s upside border. However, the bearish scenario may no longer be valid if the price breaks the cloud’s upside border and fixes above 0.9155. In this case, the pair may continue growing towards 0.9245.
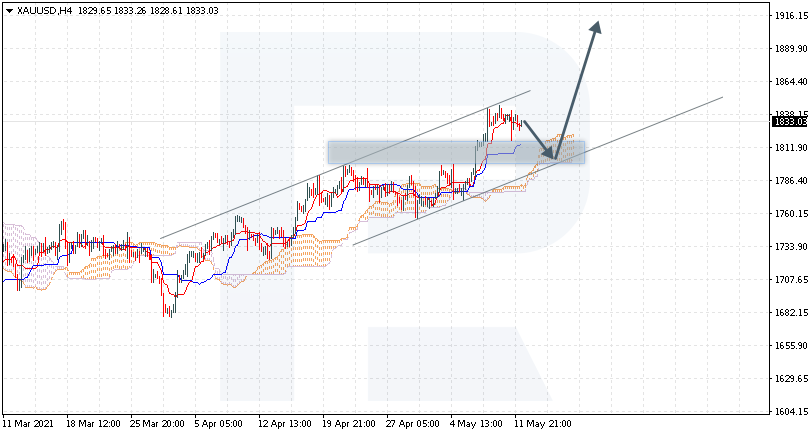
XAUUSD, “Gold vs US Dollar”
XAUUSD is trading at 1833.00; the instrument is moving above Ichimoku Cloud, thus indicating an ascending tendency. The markets could indicate that the price may test the cloud’s downside border at 1805.00 and then resume moving upwards to reach 1915.00. Another signal in favor of a further uptrend will be a rebound from the rising channel’s downside border. However, the bullish scenario may no longer be valid if the price breaks the cloud’s downside border and fixes below 1770.00. In this case, the pair may continue falling towards 1735.00.
Attention! Forecasts presented in this section only reflect the author’s private opinion and should not be considered as guidance for trading. RoboForex LP bears no responsibility for trading results based on trading recommendations described in these analytical reviews.
On Tuesday, the EUR/USD price tried to break through the resistance level of 1.2176 again, but the sellers managed to defend their positions.
Trading recommendations
Support levels: 1.2108, 1.2074, 1.2027, 1.2002, 1.1957, 1.1835
Resistance levels: 1.2150, 1.2176, 1.2212, 1.2243
The trend remains bullish, and the price is above the moving average. But the buyers failed to hold the support level of 1.2150. The divergence on the MACD indicator worked very well this time. As a result, the price went into a deeper local correction.
Alternative scenario: if the price breaks down through the 1.2074 support level and holds below, the general uptrend is likely to be broken.
News feed for 2021.05.12:
– European Commission Economic Forecasts (q/q) at 12:00 (GMT+3);
– US Consumer Price Index (m/m) at 15:30 (GMT+3);
– US Core CPI (m/m) at 15:30 (GMT+3);
– US 10-y Bond Auction (m/m) at 20:01 (GMT+3).
The GBP/USD currency pair
Technical indicators of the currency pair:
Prev Open: 1.4114
Prev Close: 1.4139
% chg. over the last day: +0.17%
The GBP/USD currency pair is still in a strong uptrend, but now the price looks overbought. This is indicated by a strong deviation from the moving average and divergence on the MACD indicator.
Trading recommendations
Support levels: 1.3996, 1.3913,1.3835, 1.3801, 1.3756, 1.3690
Resistance levels: 1.4110, 1.4207
It is important for the buyers to hold the support level of 1.4110 in order not to let the price go into a deeper correction. A price fixation under 1.4110 will make room for the next support level of 1.3996.
Alternative scenario: if the price breaks down through the 1.3913 support level and holds below, the bullish scenario is likely to be canceled.
News feed for 2021.05.12:
– UK Gross Domestic Product (q/q) at 09:00 (GMT+3);
– UK BOE Governor Andrew Bailey Speaks at 12:00 (GMT+3).
The USD/JPY currency pair
Technical indicators of the currency pair:
Prev Open: 108.76
Prev Close: 108.61
% chg. over the last day: -0.13%
On Tuesday, the USD/JPY currency pair tried to break through the support level of 108.44, but the buyers defended their positions. As a result, a wide flat with a price range of 108.44-108.87 was formed. A price move above 109.01 would resume the mid-term upward momentum.
Trading recommendations
Support levels: 108.44, 108.19,107.77, 107.47, 107.04
The price is still trading below the moving average.The MACD indicator is in the negative area with signs of a hidden divergence. Under such market conditions, it is possible to work in both directions, “long” from the support or “short” from the resistance levels. But if the dollar index continues to fall, the USD/JPY will form a mid-term downtrend.
Alternative scenario: if the price drops below 108.44, the general downtrend is likely to resume.
There is no news feed for today.
The USD/CAD currency pair
Technical indicators of the currency pair:
Prev Open: 1.2100
Prev Close: 1.2100
% chg. over the last day: 0%
The situation in the USD/CAD currency pair did not change much. Deceleration of the price movement downward switched into a narrow flat. The price is facing a very strong support level.
The trend remains bearish for USD/CAD. But the MACD indicator is already signaling about 2 divergences (mid-term and local). It is too early to look for long positions, as the initiative from the buyers is too weak. Also, it is too late to open short deals, as the support level is ahead. Traders should wait or trade intraday timeframes.
Alternative scenario: if the price breaks through the 1.2321 resistance level and holds above, a local corrective uptrend is likely to form.
This article reflects a personal opinion and should not be interpreted as an investment advice, and/or offer, and/or a persistent request for carrying out financial transactions, and/or a guarantee, and/or a forecast of future events.
On Tuesday, the main U.S. stock indexes showed negative dynamics, but by the end of the trading day it recovered their positions. At the moment, the investor sentiment is very mixed. On the one hand, the economy is filling up with cheap money, but on the other hand, there are growing concerns about rising inflation, which could stimulate the Fed to tighten monetary policy.
Concerns about inflation have also affected European markets. European tech stocks fell to their lowest level since late March. At the end of Tuesday, Europe’s EURO STOXX 50 Index decreased by 2.12%, Germany’s DAX decreased by 1.82% and Britain’s FTSE 100 lost 2.47%. Today, consumer price changes in Germany and France are expected to be released.
The price of the gold declined sharply during the American trading session but recovered a bit by the end of the day. Investors want to wait for the macroeconomic data on the U.S. inflation, which will be published later this week. Also, the gold price is affected by reports on the U.S. Treasury bond yields, which are expected to be released today and tomorrow.
Prices for “Black Gold” continue to move higher. While the Colonial Pipeline is recovering, the U.S. eastern states are already experiencing fuel shortages, and refiners in the Gulf of Mexico are unable to increase production to cover those losses. A report on oil inventories is expected from the Energy Department today.
Concerns about rising inflation have also affected Asian markets. As a result of the panic sales, Asian stocks fell to their lowest level in seven weeks. Asia-Pacific’s broadest index of stocks outside Japan, MSCI, lost another 1.5%, with all major indices being under strong selling pressure. Also, Taiwan warned of an extremely serious situation with COVID-19 on the island.
Main market quotes:
S&P 500 (F) 4,152.10 -36.33 (-0.87%)
Dow Jones 34,269.16 -473.66 (-1.36%)
DAX 15,119.75 -280.66 (-1.82%)
FTSE 100 6,947.99 -175.69 (-2.47%)
USD Index 90.19 -0.03 (-0.03%)
Important events:
– UK Gross Domestic Product (q/q) at 09:00 (GMT+3);
– UK BOE Governor Andrew Bailey Speaks at 12:00 (GMT+3);
– European Commission Economic Forecasts (q/q) at 12:00 (GMT+3);
This article reflects a personal opinion and should not be interpreted as an investment advice, and/or offer, and/or a persistent request for carrying out financial transactions, and/or a guarantee, and/or a forecast of future events.
It has been a challenging year for Disney thus far.
The magic kingdom continues to nurse deep wounds inflicted by the pandemic.
Since the start of 2021, shares of the entertainment giant have gained a paltry 0.27%, underperforming against the S&P 500’s 10.5% gain over the same period.
Although the Covid-19 menace has dished out much pain, it has also provided opportunities. Given how the re-opened theme parks are operating at a lower capacity and the cruise line business remains closed, this may negatively impact Disney’s second-quarter results. However, the streaming services could come to the rescue after Disney reported in early March that Disney+ subscribers surpassed 100 million for the first time.
When is Disney’s earnings call and what to expect?
Disney reports its fiscal second-quarter earnings after U.S markets close on Thursday 13 May.
According to Bloomberg, the entertainment giant is expected to post adjusted earnings of 28 cents per share on revenues of $15.85 billion for the fiscal second quarter. This will mark a 12% fall from fiscal Q1 and the fifth consecutive quarter where revenues have dropped. For the full year, adjusted earnings are forecast to hit $1.85 per share on revenues of $68.66 billion.
What to watch out for….
Disney+ subscriber numbers will be under the spotlight.
With the company’s cash producing juggernauts closed/operating at limited capacity, Disney’s streaming services are likely to remain the primary driver of growth moving forward. As stated earlier, the streaming platform topped 100 million subscribers by early March. Considering how Disney+ has been running for only 16 months, this growth is certainly phenomenal.
Now, this is where things get interesting. Netflix’s added only 3.98 million paid subscribers in the first quarter. With lockdown restrictions easing and consumers returning to outdoor entertainment, this could bad news for the streaming giants. If the subscription numbers for fiscal Q2 disappoint, it could suggest that growth in the industry may be slowing as normality returns. However, strong subscriber growth will be a welcome development for Disney while enforcing pressure on Netflix.
In March, Disney+ raised its monthly subscription to $7.99 a month from $6.99 while the annual subscription increased to $79.99 from $69.99. This hike in prices could boost profitability, especially when considering how its subscription remains cheaper than other competitors. Netflix charges $8.99 per month for a basic plan, Amazon Prime charges $12.99 while a single subscription plan for HBO costs $14.99 per month.
Back in December 2020, the entertainment giant expected Disney+ to have between 230 to 260 million subscribers by 2024. This is more than the population of Africa’s largest economy – Nigeria.
How about the theme parks and resorts?
It is widely known that Disney’s theme parks, cruise business, and hotels have been severely disrupted by the coronavirus pandemic. However, there is some light at the end of the tunnel as all four Walt Disney World theme parks and Disney’s Blizzard Beach Water Park are now open.
Nevertheless, the need for social distancing will likely cap the number of people which are allowed in the theme parks. This could hit revenues until restrictions are fully eased and the parks can run at full capacity.
Technicals: Is a breakout on the horizon?
Disney shares have traded within a $10 range over the past few weeks with support around $180 and resistance at $190. Despite the range, the longer-term trend respects a bearish channel while the MACD trades below zero.
If the earnings report disappoints market expectations, this could encourage decline and daily close below $180. Such a scenario could open the doors towards $173. Alternatively, upbeat numbers could boost buying sentiment towards Disney shares – propelling prices back towards the $190 resistance level. A strong break above $190 could trigger an incline towards $194 and $200, respectively.
Disclaimer: The content in this article comprises personal opinions and should not be construed as containing personal and/or other investment advice and/or an offer of and/or solicitation for any transactions in financial instruments and/or a guarantee and/or prediction of future performance. ForexTime (FXTM), its affiliates, agents, directors, officers or employees do not guarantee the accuracy, validity, timeliness or completeness, of any information or data made available and assume no liability as to any loss arising from any investment based on the same.

















 Article by