Murrey Math Lines 25.05.2021 (AUDUSD, NZDUSD)

Article By RoboForex.com

AUDUSD, “Australian Dollar vs US Dollar”

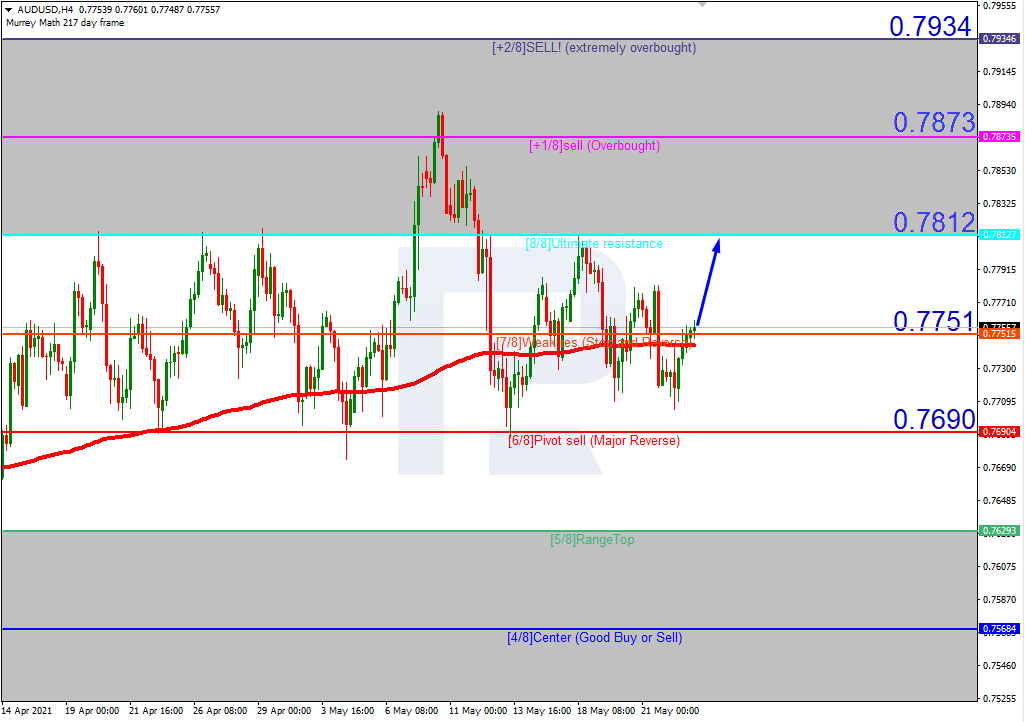
In the H4 chart, after breaking the 200-day Moving Average, AUDUSD is trading above it to indicate a possible ascending tendency. In this case, the price is expected to continue moving upwards and reach the resistance at 8/8. However, this scenario may be canceled if the price breaks 7/8 to the downside. After that, the instrument may continue falling towards the support at 6/8.

AUDUSD_H4
Risk Warning: the result of previous trading operations do not guarantee the same results in the future

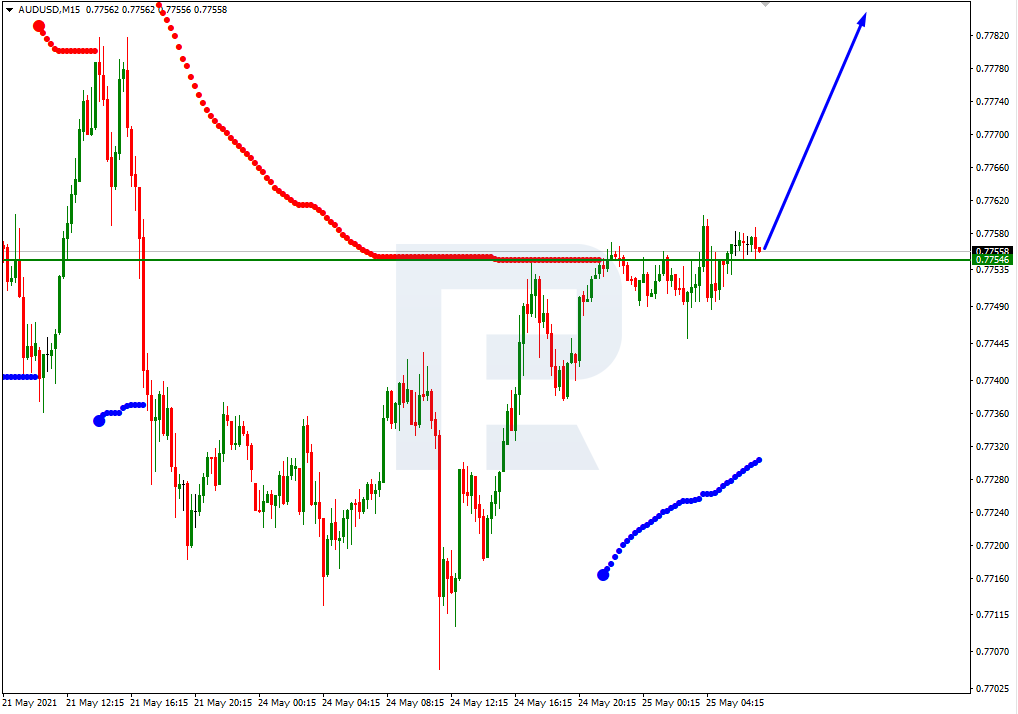
As we can see in the M15 chart, the pair has broken the upside line of the VoltyChannel indicator and, as a result, may continue trading upwards to reach 8/8 from the H4 chart.

AUDUSD_M15
Risk Warning: the result of previous trading operations do not guarantee the same results in the future

NZDUSD, “New Zealand Dollar vs US Dollar”

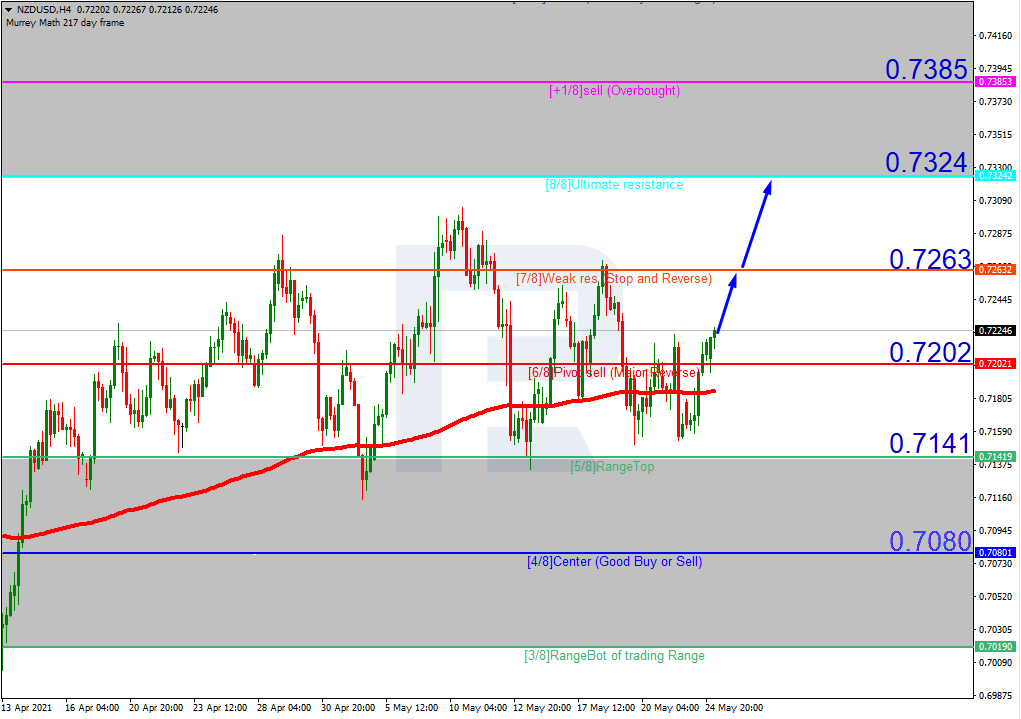
In the H4 chart, NZDUSD is trading above the 200-day Moving Average to indicate an ascending tendency. In this case, the price is expected to test 7/8, break it, and then continue growing to reach the resistance at 8/8. However, this scenario may no longer be valid if the price breaks 6/8 to the downside. In this case, the instrument may fall towards the support at 5/8.

NZDUSD_H4
Risk Warning: the result of previous trading operations do not guarantee the same results in the future

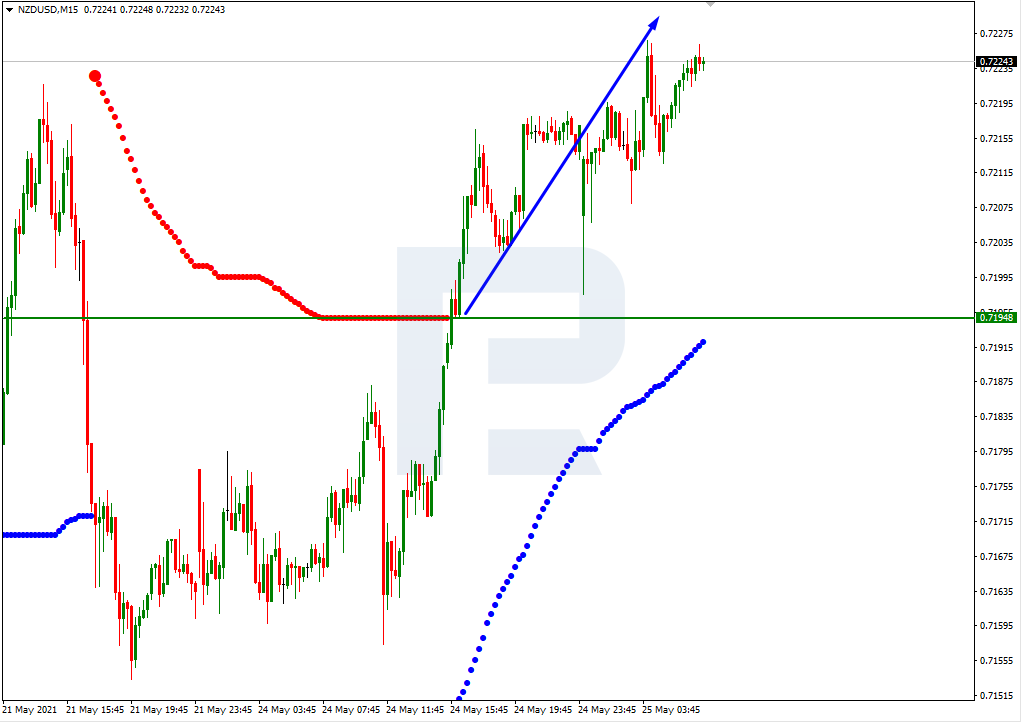
As we can see in the M15 chart, the pair has broken the upside line of the VoltyChannel indicator and, as a result, may continue its growth.

NZDUSD_M15

Article By RoboForex.com

Attention!
Forecasts presented in this section only reflect the author’s private opinion and should not be considered as guidance for trading. RoboForex LP bears no responsibility for trading results based on trading recommendations described in these analytical reviews.

The Analytical Overview of the Main Currency Pairs on 2021.05.25

by JustForex

The EUR/USD currency pair

Technical indicators of the currency pair:
  • Prev Open: 1.2179
  • Prev Close: 1.2216
  • % chg. over the last day: +0.30%

The situation with the EUR/USD currency pair has not changed much. The price is trading in a wide flat with the range of 1.2168-1.2243. The US Treasury Department is planning a Treasury bond redemption today, which may ultimately affect the weakening of the dollar index and the strengthening of the European currency.

Trading recommendations
  • Support levels: 1.2168, 1.2138, 1.2115, 1.2074, 1.2026, 1.2002, 1.1957
  • Resistance levels: 1.2243

The trend is still bullish. The price is above the change priority level of 1.2138. At the moment, the price is in front of the upper border of the corridor, but the MACD indicator is not active. Under such market conditions, traders can look for both buying from the lower border of the corridor and selling from the upper border of the flat range.

Alternative scenario: if the price breaks through the 1.2138 support level and fixes below, the general uptrend is likely to be broken.

EUR/USD
News feed for 2021.05.25:
  • – German Business Climate (m/m) at 11:00 (GMT+3);
  • – US CB Consumer Confidence (m/m) at 17:00 (GMT+3).

The GBP/USD currency pair

Technical indicators of the currency pair:
  • Prev Open: 1.4147
  • Prev Close: 1.4153
  • % chg. over the last day: +0.04%

At the moment, the British pound is strongly correlated with the euro. The situation with the GBP/USD currency pair is symmetrical to EUR/USD. The price is trading in the middle of a wide flat with a range of 1.4110-1.4207. Business activity statistics in Britain are positive, so investors expect the continuation of the uptrend.

Trading recommendations
  • Support levels: 1.4110, 1.4075, 1.3996, 1.3913,1.3835, 1.3801, 1.3756, 1.3690
  • Resistance levels: 1.4207

The trend remains bullish. The price is above the moving average. The MACD indicator has become inactive. It is recommended for traders to look for long positions from the lower border of the range or look for sell positions from the resistance level of 1.4207, where sellers hold the defense well.

Alternative scenario: if the price breaks through the 1.4075 support level and consolidates below, the bullish scenario is likely to be canceled.

GBP/USD
There is no news feed for today.

The USD/JPY currency pair

Technical indicators of the currency pair:
  • Prev Open: 108.88
  • Prev Close: 108.76
  • % chg. over the last day: -0.11%

The psychological resistance level of 109 along with the moving line pushed the price lower. The price is slowly descending towards the nearest support level. If the dollar index continues to fall, the price of USD/JPY will also go down. However, the macro statistics on business activity in Japan are still very weak.

Trading recommendations
  • Support levels: 108.66, 108.44, 108.19, 107.77, 107.47, 107.04
  • Resistance levels: 109.00, 109.40, 109.64, 109.95, 110.51

On the H1 timeframe, the trend remains bearish, and the price is trading below the moving average. The MACD indicator is still inactive. Under such market conditions, traders are better to look for sell positions from the resistance levels. It is also possible to consider long positions, but only within an uptrend on the lower timeframes.

Alternative scenario: if the price rises above 109.40, the general uptrend is likely to resume.

USD/JPY
There is no news feed for today.

The USD/CAD currency pair

Technical indicators of the currency pair:
  • Prev Open: 1.2064
  • Prev Close: 1.2043
  • % chg. over the last day: -0.17%

The USD/CAD currency pair has formed a narrow flat, with sellers slowly moving the price lower to the support level of 1.2048. Considering the background of the dollar index fall, the downtrend may strengthen again.

Trading recommendations
  • Support levels: 1.2048, 1.1944
  • Resistance levels: 1.2093, 1.2137, 1.2251, 1.2321, 1.2388, 1.2414, 1.2519

The price is trading below the moving average, and the trend remains bearish. However, there are signs of divergence on the MACD indicator. At the moment, the best strategy for the USD/CAD currency pair is to wait. It is possible to sell within the trend, if the price consolidates below the support level of 1.2048 again. It is too early to look for long positions, since there is no significant initiative from the buyers.

Alternative scenario: if the price breaks out through the 1.2137 resistance level and fixes above, a local corrective uptrend is likely to form.

USD/CAD
There is no news feed for today.

by JustForex


This article reflects a personal opinion and should not be interpreted as an investment advice, and/or offer, and/or a persistent request for carrying out financial transactions, and/or a guarantee, and/or a forecast of future events.

The US Treasury bond yields continue to decline, which plays in favor of the strengthening of major stock indices

by JustForex

As of yesterday’s results, the US indices rose significantly again. The S&P 500 index increased by 0.99%, the Dow Jones Industrials added 0.54%, and the Nasdaq Composite technology index jumped by 1.41%. Tech giants AAPL, MSFT, and NVDA were the leaders of the growth. This week the US will release statistics on personal consumption, which is a preliminary indicator of inflation. Also, there is a heated debate about tax increases in the US Congress.

In Europe (except the UK) there was a bank holiday yesterday. The markets were closed. Today, at the opening of the market, the European indices went up. In general, European indices are showing growth dynamics, despite the weak business activity and the GDP statistics of the main European countries.

The gold price is highly correlated with inflation data and Treasury bond yields. As long as the first is rising and the second is falling, which is the case right now, the price of gold and other precious metals will rise.

Negotiations to lift sanctions on Iran went nowhere for now. As a result, oil prices have skyrocketed again. Brent crude futures increased by 3% on Monday. Futures on West Texas Intermediate (WTI) crude oil rose by 3.9% to $66.13 a barrel in the previous session.

Amid the rising US indices, Japan’s Nikkei index rose by 0.6%, Australia’s AU200 index added 0.69%. Chinese stocks reached the highest level for the last two months, CSI blue-chip index jumped by 1.89%.

Main market quotes:

S&P 500 (F) 4,197.05 +41.19 (+0.99%)

Dow Jones 34,393.98 +186.14 (+0.54%)

DAX 15,437.51 0 (0)

FTSE 100 7,051.59 +33.54 (+0.48%)

USD Index 89.84 -0.18 (-0.20%)

Important events:
  • – Germany Business Climate (m/m) at 11:00 (GMT+3);
  • – US CB Consumer Confidence (m/m) at 17:00 (GMT+3).

by JustForex


This article reflects a personal opinion and should not be interpreted as an investment advice, and/or offer, and/or a persistent request for carrying out financial transactions, and/or a guarantee, and/or a forecast of future events.

Risk sentiment improves as inflation fears ease

By Lukman Otunuga Research Analyst, ForexTime

Asian markets flashed green on Tuesday while US futures rose after technology shares led gains on Wall Street overnight.

As a chorus of Fed officials reiterated that the recent pickup in inflation would be transitory, investor fears were soothed about rising prices forcing higher interest rates. US equity bulls rejoiced on this development, encouraging buying in expensive growth stocks in sectors such as technology.

While these comments have lifted risk sentiment and offered support to stock markets, concerns still linger over the Fed taking action sooner, rather than later if inflationary pressures mount. In the meantime, financial markets are likely to remain highly sensitive to inflation expectations and comments from Fed officials on this topic.

Dollar drifts lower…

The past few weeks have certainly not been kind to the dollar.

It has weakened against every single G10 currency this month and remains vulnerable to further losses amid weaker treasury yields. Although inflation worries are receding following the latest comments from Fed officials, the damage has already been inflicted on the dollar.

The main risk events for the greenback today will be the US new home sales and consumer confidence data. For April, sales of new homes are expected to hit 950,000, falling from the 1,021,000 new homes sales in March. In regard to consumer confidence, it is expected to decline slightly in May falling to 119 from 121.7 in April.

Focusing on the technical picture, the Dollar Index is under pressure on the daily charts. Sustained weakness below the psychological 90.00 level may encourage a decline towards 89.30.

Germany GDP downgraded in Q1

The euro offered a muted response this morning to the news that Germany’s economy contracted in the first quarter by more than reported in the first release. Europe’s largest economy shrank by 1.8% quarter-on-quarter in the three months to March 2021 which was weaker than the first estimate of -1.7%. On the year, the economy shrank 3.1% compared to the 3.0% preliminary estimate. Despite the downgrade, the economic outlook is starting to brighten as coronavirus cases fall and lockdown restrictions ease across the continent.

The EUR/USD is currently trading above 1.2250 and dollar weakness could send the pair towards levels not seen since early January at 1.2300.

Commodity spotlight – Gold

Gold continues to shine thanks to a weaker dollar, falling Treasury yields and extreme volatility in the cryptocurrency space.

The precious metal is trading around levels not seen in four months and is up over six per cent in May. Despite the receding US inflation fears, gold is supported by other fundamental drivers. Although the path of least resistance points north, the price action around $1870 could determine whether gold extends gains or experiences a technical pullback this week. Should $1870 prove to be reliable support, a move towards $1900 could be on the cards. However, a decline below $1870 may signal a drop towards $1855 and $1840, respectively.

Disclaimer: The content in this article comprises personal opinions and should not be construed as containing personal and/or other investment advice and/or an offer of and/or solicitation for any transactions in financial instruments and/or a guarantee and/or prediction of future performance. ForexTime (FXTM), its affiliates, agents, directors, officers or employees do not guarantee the accuracy, validity, timeliness or completeness, of any information or data made available and assume no liability as to any loss arising from any investment based on the same.


Forex-Time-LogoArticle by ForexTime

ForexTime Ltd (FXTM) is an award winning international online forex broker regulated by CySEC 185/12 www.forextime.com

Technical Outlook: G10 Currencies On Standby

By Lukman Otunuga Research Analyst, ForexTime

It was a dull start to the trading week for G10 currencies.

Other than the flicker of action witnessed on the Norwegian Krone and New Zealand Dollar, it pretty much felt like watching paint dry on a rainy day.

After looking at the paltry intraday gains (below), we decided to identify potential technical setups in the week ahead.

As of writing,

One thing that’s strikes out is the fact that all currencies in the G10 space have appreciated against the greenback today.

The not so mighty dollar remains pressured by inflation fears and is struggling to push back above the psychological 90.00 level. Sustained weakness below this point could open the doors towards 89.30.

EURUSD breakout on the horizon?

We see a classic breakout setup forming on the EURUSD.

Support can be found at 1.2170 and resistance around 1.2240. A solid breakout and daily close above 1.2240 could signal a move towards 1.2300. Alternatively, a decline below 1.2170 could pave a path towards 1.2060.

GBPUSD gearing up for a push higher?

It’s safe to say that the GBPUSD is firmly bullish on the daily charts.

There have been consistently higher highs and higher lows while the MACD trades above zero. Should 1.4100 prove to be reliable support, this could provide a platform for bulls to conquer the 1.4200 resistance level. A solid daily close above this point could pry open the doors towards 1.4240 and levels not seen since April 2018 at 1.4300.

One thing to keep in mind is the fact the Relative Strength Index (RSI) is slowly approaching overbought territory. This may instil bears with fresh inspiration if 1.4100 proves to be unreliable support.

USDNOK knocks on 8.3850’s door

If one word could be used to describe the USDNOK’s movements over the past few weeks, the best fit would be choppy.

We can see strong resistance around 8.3850 and support at 8.1700. A decisive breakout and daily close above 8.3850 could result in a move towards 8.4700.  Prices are likely to drift lower if 8.3850 proves to be reliable resistance.

USDJPY below 50-day SMA

Prices are trading below the 50-day Simple Moving Average while the MACD is in the process of crossing to the downside. Bears need to secure a solid daily close below 108.30 to encourage a decline towards 107.67. A rebound from the 108.30 level could inject bulls with enough confidence to elevate prices back towards 109.30.

Disclaimer: The content in this article comprises personal opinions and should not be construed as containing personal and/or other investment advice and/or an offer of and/or solicitation for any transactions in financial instruments and/or a guarantee and/or prediction of future performance. ForexTime (FXTM), its affiliates, agents, directors, officers or employees do not guarantee the accuracy, validity, timeliness or completeness, of any information or data made available and assume no liability as to any loss arising from any investment based on the same.


Forex-Time-LogoArticle by ForexTime

ForexTime Ltd (FXTM) is an award winning international online forex broker regulated by CySEC 185/12 www.forextime.com

Tesla and NIO continue with their declines

By Admiral Markets

Both Tesla and NIO have been two of the financial markets’ major players during the last year, since many investors have focused their attention on companies manufacturing electric vehicles. However, the market sentiment so far this year has failed to match up to levels seen in 2020.

While Tesla and NIO showed their positive side with increases of 743.40% and 1112.24% respectively last year, so far in 2021 both companies are experiencing a strong correction that amounts to 17.68 % and 30.12% respectively.

Such decreases can in part be explained by the problems and doubts emanating from the rise in inflation in the United States. Moreover, possible changes that the Federal Reserve may make in its current policy regarding interest rates and the programme of debt purchase could also have an impact. This is because it directly affects the yield of the US bond, and in turn, directly impacting the debt markets. As a result of this, technology companies are affected, because they generally have a significant debt structure, while an increase in this will reduce their margins and increase their costs.

On the other hand, these companies have also been affected by the problems derived from the crisis, caused by the shortage of semiconductor chips that has been an ongoing issue since the start of the pandemic. Following the emergence of the coronavirus last year, consumption habits towards digital products was fired up at a time when manufacturers had to delay their production. Therefore, despite these factories now being in full swing, we continue to have a shortage of these products, directly affecting production and the business model of both companies.

In April, the quarterly results of Tesla were released, where we saw an increase in the delivery of vehicles to 184,800 units and mixed data. This is despite the fact that the investment made in Bitcoin last February by Tesla had a generally positive impact on results.

Specifically, Tesla posted an earnings per share of $0.93 per share compared to the $0.74 expected by the market consensus after obtaining a net profit of $438 million in the first quarter of the year. The negative aspect of these results can be found in revenues, since these were lower than expected by the market consensus, reaching $10.39 billion, compared to an expected $10.42 billion.

If we look at the daily chart, we can see that, after breaking down its bullish channel that began at the beginning of last March, the price has experienced a new downward impulse. This has taken it back to the annual lows and to a fight for its important support level in the 200 session average, although it seems that the price could be making a double bottom. It is very important that the price maintains this level of support, since the break of this could open the door to a further correction towards a level close to $465 per share.
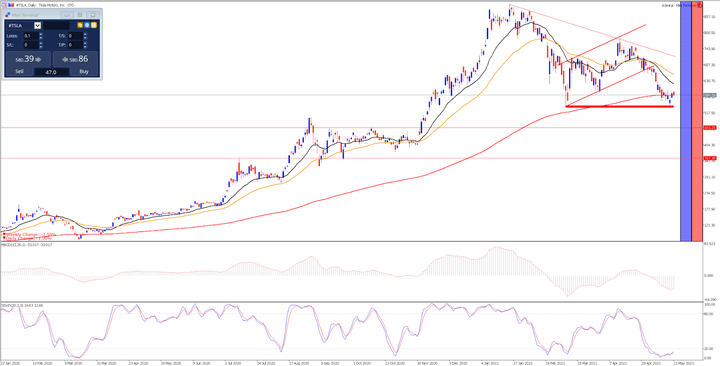
Source: Admiral Markets MetaTrader 5 platform Tesla daily chart from January 22, 2020 to May 24, 2021. Taken: May 24 at 12:40 CEST. Note: Past performance is not a reliable indicator of future results, or future performance.


Evolution of the last 5 years:

  • 2020: 743.40%
  • 2019: 25.71%
  • 2018: 6.89%
  • 2017: 45.69%
  • 2016: -10.96%


If we focus on NIO, we can see that last month the company also presented its corresponding results for the first quarter of the year, where we were able to find both a better than expected earnings per share and income amount. This is reflected in the results, with an earnings per share of -$0.23 and an income of $7.98. In addition, recently, we learned that NIO has opened a flagship store on alibaba’s Tmall.com, thus allying itself with the Chinese online sales giant and indicating that it is planning to increase its car manufacturing levels.

Technically speaking, if we look at the daily chart we can see how during this year it has maintained a clear bearish structure, breaking important support / resistance levels represented in green, thus fulfilling the negative divergence that we could observe in the last section of last year between the price and its MACD indicator. The loss of these levels has led the price to break down to the important average of 200 sessions and form a double bottom around $31 per share.

Looking ahead and facing a possible recovery, it is important that this possible double bottom is quickly confirmed, since its 18-session moving average in black has also broken down to its 200-session moving average and the loss of $30 would open the gates to a further correction. The upward break of the triangular formation between the bottom in red and the short-term downtrend line in red, could lead the price to seek levels close to the blue band above $45 per share.

Source: Daily chart of the Admiral Markets MetaTrader 5 platform NIO from January 21, 2020 to May 24, 2021. Realized: May 24 at 12:50 CEST. Note: Past performance is not a reliable indicator of future results, or future performance.


Evolution of the last 5 years:

  • 2020: 1112.24%
  • 2019: -36.89%
  • 2018: -8.74%


With the Admirals Trade.MT5 account, you can trade Contracts for Differences (CFDs) of Tesla, NIO and more than 3000 stocks! CFDs allow traders to try to profit from the bull and bear markets, as well as the use of leverage. Click on the following banner to open an account today:

Trade With MetaTrader 5

INFORMATION ABOUT ANALYTICAL MATERIALS:

The given data provides additional information regarding all analysis, estimates, prognosis, forecasts, market reviews, weekly outlooks or other similar assessments or information (hereinafter “Analysis”) published on the websites of Admiral Markets investment firms operating under the Admiral Markets trademark (hereinafter “Admiral Markets”) Before making any investment decisions please pay close attention to the following:

  1. This is a marketing communication. The content is published for informative purposes only and is in no way to be construed as investment advice or recommendation. It has not been prepared in accordance with legal requirements designed to promote the independence of investment research, and that it is not subject to any prohibition on dealing ahead of the dissemination of investment research.
  2. Any investment decision is made by each client alone whereas Admiral Markets shall not be responsible for any loss or damage arising from any such decision, whether or not based on the content.
  3. With view to protecting the interests of our clients and the objectivity of the Analysis, Admiral Markets has established relevant internal procedures for prevention and management of conflicts of interest.
  4. The Analysis is prepared by an independent analyst, Roberto Rojas (analyst), (hereinafter “Author”) based on their personal estimations.
  5. Whilst every reasonable effort is taken to ensure that all sources of the content are reliable and that all information is presented, as much as possible, in an understandable, timely, precise and complete manner, Admiral Markets does not guarantee the accuracy or completeness of any information contained within the Analysis.
  6. Any kind of past or modeled performance of financial instruments indicated within the content should not be construed as an express or implied promise, guarantee or implication by Admiral Markets for any future performance. The value of the financial instrument may both increase and decrease and the preservation of the asset value is not guaranteed.
  7. Leveraged products (including contracts for difference) are speculative in nature and may result in losses or profit. Before you start trading, please ensure that you fully understand the risks involved.

By Admiral Markets

Are some banks on wrong side of history on cryptocurrencies?

By George Prior

– Banks and other financial institutions who still refuse to recognize major cryptocurrencies, such as Bitcoin, as a legitimate asset class are putting themselves on the wrong side of history, says the CEO of one of the world’s largest independent financial advisory and fintech organizations.

The bold observation from Nigel Green, chief executive and founder of deVere Group, comes despite the cryptocurrency market shedding more than $1 trillion in a week after all-time highs, which have prompted some financial institutions to speak out on the likes of Bitcoin.

However, the world’s largest cryptocurrency advanced as much as 19% on Monday.

Mr Green says: “Bitcoin, amongst other digital tokens, has had a hugely impressive run over the last six months, so it’s not surprising that there’s a period of consolidation and short-term correction in such a hot market.

“We can expect market turbulence of this nature to continue until it fully matures and there is even greater institutional investment.

“But if you zoom out on the charts and take a look, they show that Bitcoin and Ethereum, the two biggest cryptocurrencies, have consistently been on an upward trajectory over the longer-term – but no financial market ever moves up in a completely straight line, yet the upside direction is clear.”

He continues: “As such, I find it baffling that some banks have decided to refute the legitimacy of cryptocurrencies.

“By doing so, they are not only placing themselves on the wrong side of history, but they’re not providing clients access to the potentially significant opportunities of key digital assets that could define the future.

“Of course, cryptocurrencies are not for every client – but neither is any investment. Therefore, a refusal of one particular asset class seems somewhat peculiar.”

He goes on to say: “The blistering pace of the digitalization of economies and our lives means that from now on there will be a growing demand for digital, global, borderless money.

“Indeed, digital currencies have already changed forever the way the world handles money, makes transactions, does business, and manages assets.

“They are becoming an integrated part of the mainstream financial system, which is evidenced by more and more Wall Street giants, social media platforms and multinationals, amongst others, becoming increasingly actively pro-crypto.

Mr Green, who has long been an advocate of cryptocurrencies, is one of the leading voices calling for greater regulatory scrutiny of the market.

Last week, he said that the U.S. Treasury Department’s new, stricter cryptocurrency rules underscore how the likes of Bitcoin are becoming increasingly mainstream.

“I believe that this is recognition by those running the world’s largest economy that cryptocurrencies, in some form or another, are the future of money. The genie can’t be put back in the bottle,” he noted.

He went on to say that he believed it could be the first significant step towards global regulation.

“It is inevitable as the market grows and matures.  Proportionate regulation should be championed. It would help protect investors, shore-up the market, tackle criminality, and reduce the potential possibility of disrupting global financial stability, as well as offering a potential long-term economic boost to those countries that introduce it.”

The deVere CEO concludes: “When everything from voting to entertainment is already digital, dismissing digital currencies in a digital era as part of a properly diversified portfolio, to my mind, seems a little archaic.”

About:

deVere Group is one of the world’s largest independent advisors of specialist global financial solutions to international, local mass affluent, and high-net-worth clients.  It has a network of more than 70 offices across the world, over 80,000 clients and $12bn under advisement.

Bitcoin: More Volatility Directly Ahead?

Here’s how Elliott wave analysis helps you prepare for cryptocurrency volatility

By Elliott Wave International

If there’s a single word to describe bitcoin’s price action, that word is “volatile.”

Yet, those who invested roughly a year ago in the cryptocurrency — and stuck with it — have been hugely rewarded. (At least until very recently, as bitcoin traded more than 50% lower from its all-time high on May 19, as the price careened nearly 30% at one point on that day alone.)

Indeed, Elliott Wave International cryptocurrency analyst Tony Carrion provided a video update on bitcoin in the March 2020 Global Market Perspective, a monthly publication from Elliott Wave International which provides coverage of 50+ worldwide financial markets.

You’ll notice in the chart below that his analysis included a forecast for higher prices (as indicated by the upward blue arrow in the right side of the chart):

At the time, bitcoin was trading a tad north of $8700. Of course, since then, bitcoin has climbed as high as near $64,000 before pulling back significantly.

Remember, at the time the March 2020 Global Market Perspective published its bullish outlook, there was a lot of negative news about this “granddaddy” of crypto-assets.

For example, here’s a Feb. 27, 2020 headline from a major financial publication (Forbes):

Bitcoin Has Crashed — Now What?

So, the upward rise in bitcoin from March 2020 was by no means a “given.”

Realize that EWI’s analysts do not extrapolate the present into the future as so many investors are inclined to do. No — they focus on a market’s Elliott wave pattern, and bitcoin’s price pattern at the time strongly suggested that the cryptocurrency was not only headed higher — but significantly so.

The questions now are: Does bitcoin have a lot further to climb — according to the Elliott wave model — or is an even higher degree of volatility expected just around the corner?

Well, a May 13 headline suggests that “fundamentals” are driving bitcoin’s price (CNBC, May 12):

As much as $365 billion wiped off cryptocurrency market after Tesla stops car purchases with bitcoin

Yet, it may be a good idea to see what Elliott wave analysis suggests is next for bitcoin, in addition to other cryptocurrencies.

If you’re new to Elliott wave analysis, or need to brush up on your knowledge, you are encouraged to read Frost & Prechter’s book, Elliott Wave Principle: Key to Market Behavior. Here’s a quote:

No matter what your convictions, it pays never to take your eyes off what is happening in the wave structure in real time. Ultimately, the market is the message, and a change in behavior can dictate a change in outlook. All one really needs to know at the time is whether to be long, short or out, a decision that can sometimes be made with a swift glance at a chart and other times only after painstaking work.

Good news: You can access the online version of this Wall Street classic for free when you join Club EWI, the world’s largest Elliott wave educational community (about 350,000 members and growing rapidly). A Club EWI membership is also free.

Just follow this link to get started: Elliott Wave Principle: Key to Market Behavior — free and instant access.

This article was syndicated by Elliott Wave International and was originally published under the headline Bitcoin: More Volatility Directly Ahead?. EWI is the world’s largest market forecasting firm. Its staff of full-time analysts led by Chartered Market Technician Robert Prechter provides 24-hour-a-day market analysis to institutional and private investors around the world.

US Clients Can Still Avail of Top Quality Online Forex Broker Services

Are you a US citizen and looking for Forex brokers to deal with? If you are, there are plenty of US brokers accepting US clients. But do they all accept US clients? Or are some US brokers still not accepting US clients? This is the question that many newbie Forex traders ask when looking for a US broker.

The question of whether brokers still accepting US forex clients has come up many times in forex forums recently. There have been questions raised about whether brokers are still accepting US clients, and the answer is yes.

One reason why forex brokers are still accepting US clients is that it’s still a pretty lucrative market. Forex is one of the biggest markets, with a daily turnover of over a Trillion dollars. There are lots of new brokers coming online every day – the average person just won’t have the time to visit all the forex brokers personally. So many US citizens want to take advantage of this opportunity and start investing, but they don’t know where to start. This is where the internet comes in handy.

Internet Trading Brokers:

Internet trading brokers can be found everywhere on the internet. You can start by going to Google or Yahoo and type “trading brokers” and you’ll find a bunch of them. Some of them will be US companies, but a lot of the best forex brokers around are offshore. If you research carefully you can find a brokerage firm offshore that offers the best forex trading opportunities to US citizens. Start looking now, before things get changed!

Maximize Sales and Profits:

The best forex brokers for US clients are those who do not even bother to look for international clients in the first place. Let’s face it. US client requirements are not that tight. But these brokers would surely want to maximize their possible sales and profits, and this is where they will advertise. And as far as advertising is concerned, most US brokers forget to inform their potential clients about US citizenship.

This is why many newbie forex traders ask if US online brokers are accepting US clients, and the answer is… Yes! If you check carefully, you will notice that most US forex brokers listed on their website or in their press releases are accepting US clients.

Demo Account:

When looking for a forex broker, there are several things one should keep in mind. For one thing, make sure the broker offers a demo account. A demo account is a way for new forex traders to practise forex trading without investing real money. Many forex brokers also offer free training videos and other materials that forex traders can use to practice forex trading. Finally, forex traders need to know that their broker will not force them into a trade before they are ready.

Open a Trading Account:

US clients may also have to satisfy another condition, however. They may need to open a trading account with a brokerage firm that does not do currency trading. This condition is often inconvenient as precious metals trading consists of a lot of international wire transfers.

Many brokers, however, have started to accept US clients as they realize that forex traders have become increasingly US-friendly in recent years. That said, however, they are still not fully ready to allow US clients to trade in the forex markets.

Features of Interactive Brokers:

If you are a US citizen, you may want to explore the option of opening an account with one of the online forex brokers that provides the features of interactive brokers. Interactive brokers provide forex trading with some different features such as chat, text-only options, and even video options.

While it is generally possible to keep a US account open long before you leave the country for travel purposes, you should be aware of the commissions and fees that may apply when you do depart. That said, interactive brokers do offer many US-dominant trading pairs like the US Dollar/Celtic Silver, US Dollar/Japanese Yen, US Dollar/Swiss Francs, and US Dollar/New Zealand Dollar among others.

Offer a Variety of Trading Option:

In terms of the forex brokers themselves, many US-based companies can be counted upon to have competent US traders on their staff. These companies tend to offer a variety of trading options for their US clients. But also have many different platform choices for potential traders to choose from.

You should look for forex brokers who are experienced in handling US dollar instruments. As they will be able to provide you with the most accurate information regarding the price movements of these particular currencies. This will enable you to make the most appropriate trade decisions.

By Taylor Wilman

Shape-shifting computer chip thwarts an army of hackers

By Todd Austin, University of Michigan and Lauren Biernacki, University of Michigan 

The Research Brief is a short take about interesting academic work.

The big idea

We have developed and tested a secure new computer processor that thwarts hackers by randomly changing its underlying structure, thus making it virtually impossible to hack.

Last summer, 525 security researchers spent three months trying to hack our Morpheus processor as well as others. All attempts against Morpheus failed. This study was part of a program sponsored by the U.S. Defense Advanced Research Program Agency to design a secure processor that could protect vulnerable software. DARPA released the results on the program to the public for the first time in January 2021.

A processor is the piece of computer hardware that runs software programs. Since a processor underlies all software systems, a secure processor has the potential to protect any software running on it from attack. Our team at the University of Michigan first developed Morpheus, a secure processor that thwarts attacks by turning the computer into a puzzle, in 2019.

A processor has an architecture – x86 for most laptops and ARM for most phones – which is the set of instructions software needs to run on the processor. Processors also have a microarchitecture, or the “guts” that enable the execution of the instruction set, the speed of this execution and how much power it consumes.

Hackers need to be intimately familiar with the details of the microarchitecture to graft their malicious code, or malware, onto vulnerable systems. To stop attacks, Morpheus randomizes these implementation details to turn the system into a puzzle that hackers must solve before conducting security exploits. From one Morpheus machine to another, details like the commands the processor executes or the format of program data change in random ways. Because this happens at the microarchitecture level, software running on the processor is unaffected.

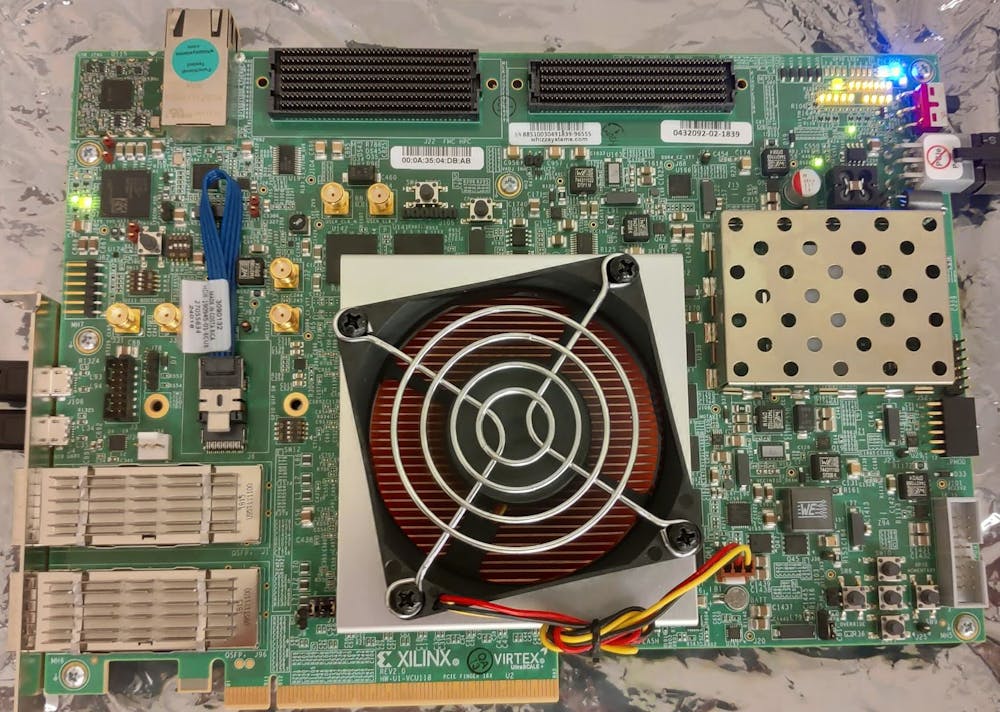
a fan on top of a metal square in the middle of a computer circuit board
The Morpheus computer processor, inside the square beneath the fan on this circuit board, rapidly and continuously changes its underlying structure to thwart hackers.
Todd Austin, CC BY-ND

A skilled hacker could reverse-engineer a Morpheus machine in as little as a few hours, if given the chance. To counter this, Morpheus also changes the microarchitecture every few hundred milliseconds. Thus, not only do attackers have to reverse-engineer the microachitecture, but they have to do it very fast. With Morpheus, a hacker is confronted with a computer that has never been seen before and will never be seen again.

Why it matters

To conduct a security exploit, hackers use vulnerabilities in software to get inside a device. Once inside, they graft their malware onto the device. Malware is designed to infect the host device to steal sensitive data or spy on users.

The typical approach to computer security is to fix individual software vulnerabilities to keep hackers out. For these patch-based techniques to succeed, programmers must write perfect software without any bugs. But ask any programmer, and the idea of creating a perfect program is laughable. Bugs are everywhere, and security bugs are the most difficult to find because they don’t impair a program’s normal operation.

Morpheus takes a distinct approach to security by augmenting the underlying processor to prevent attackers from grafting malware onto the device. With this approach, Morpheus protects any vulnerable software that runs on it.

What other research is being done

For the longest time, processor designers considered security a problem for software programmers, since programmers made the software bugs that lead to security concerns. But recently computer designers have discovered that hardware can help protect software.

Academic efforts, such as Capability Hardware Enhanced RISC Instructions at the University of Cambridge, have demonstrated strong protection against memory bugs. Commercial efforts have begun as well, such as Intel’s soon-to-be-released Control-flow Enforcement Technology.

Morpheus takes a notably different approach of ignoring the bugs and instead randomizes its internal implementation to thwart exploitation of bugs. Fortunately, these are complementary techniques, and combining them will likely make systems even more difficult to attack.

The Morpheus secure processor works like a puzzle that keeps changing before hackers have a chance to solve it.
Alan de la Cruz via Unsplash

What’s next

We are looking at how the fundamental design aspects of Morpheus can be applied to protect sensitive data on people’s devices and in the cloud. In addition to randomizing the implementation details of a system, how can we randomize data in a way that maintains privacy while not being a burden to software programmers?

About the Author:

Todd Austin, Professor of Electrical Engineering and Computer Science, University of Michigan and Lauren Biernacki, Ph.D. Candidate in Computer Science & Engineering, University of Michigan

This article is republished from The Conversation under a Creative Commons license. Read the original article.