The morning after the day before…

By Lukman Otunuga Research Analyst, ForexTime

After blockbuster US inflation numbers and the ECB avoiding taper talk, stock markets hit all-time highs in the US with large cap growth stocks outperforming all other sectors as bond yields touched three-month lows. Declining rates are a boon to interest rate sensitive stocks like tech and investors have been moving out of value and into the growth sector for the whole of this week with the Nasdaq gaining 0.8% yesterday while the Dow edged higher by 0.1%.

Yesterday’s consensus-busting CPI data was boosted by hefty contributions in used car prices and airline ticket prices which analysts are seeing as short-term in nature – “transitory” in the Fed’s words! Bond markets are certainly taking this view as the market has concluded that enough inflation risk is now discounted. This should see more pressure on the dollar which continues to trade around 90 after a few narrow range days this week.

EUR/USD nears 1.22

The ECB left policy measures unchanged but their upbeat tone saw them move the balance of risks to broadly balanced. Growth and inflation forecasts were revised higher but the latter was downplayed with the 2023 projection of 1.4% pointing to a very gradual taper of bond buying. President Lagarde swatted away any taper talk during the press conference and the ECB will remain flexible on the amounts of bond buying and continue with very accommodative monetary conditions through the summer.

EUR/USD was fairly unmoved by the meeting and bulls need to claim 1.22 before they can revisit the may highs.  Strong support below lies at 1.21 with the 50-day SMA just below.

FTSE eyeing new highs

The UK economy missed forecasts for its GDP figures this morning printing 2.3% m/m, up from 2.1% but one tenth below analyst estimates. The FTSE has found support above 7,000 and looks be making new highs for the month this morning. The index is trading above the upward sloping 50-day and 100-day SMA in a bullish trend.  7,100 is a round number target before the May high at 7164.

Disclaimer: The content in this article comprises personal opinions and should not be construed as containing personal and/or other investment advice and/or an offer of and/or solicitation for any transactions in financial instruments and/or a guarantee and/or prediction of future performance. ForexTime (FXTM), its affiliates, agents, directors, officers or employees do not guarantee the accuracy, validity, timeliness or completeness, of any information or data made available and assume no liability as to any loss arising from any investment based on the same.


Forex-Time-LogoArticle by ForexTime

ForexTime Ltd (FXTM) is an award winning international online forex broker regulated by CySEC 185/12 www.forextime.com


Hot US inflation data injects some life into markets

By Lukman Otunuga Research Analyst, ForexTime

Investors who have been craving for some volatility this afternoon had their wishes fulfilled following the May inflation report that showed prices rising in the United States at their fastest rate since 2008.

The consumer price index (CPI) jumped to 5% year-on-year, up from 4.2% in April and topping the 4.7% forecast. Core inflation, which strips out volatile items like food and energy rose 3.8% annually, its biggest increase since 1998. This report will most likely fuel concerns over rising inflationary pressures in the United States as the economy bounces back from the pandemic. While the hot inflation data may not be enough to force the Fed to make any policy moves anytime soon, it may prompt the central bank to think twice about their “transitory” mantra while fueling speculation over official taper discussions.

Looking at the reaction across markets, US Treasury yields spiked above 1.53%, US stocks opened higher while the dollar whipsawed.

In other news, US jobless claims fell to 376,000 last week which was above the median economist estimate but the lowest level since 13 March last year. Given how the Federal Reserve has made it clear to markets that employment is a key component in its mandate, the improving jobless claims could add to the growing list of factors that may bring more hawks to the policy discussion table.

Looking at the technical picture, the Dollar Index has found some support above the 90.00 level. A daily close above this point could open the doors towards 90.45. Alternatively, a decline back below 90.00 may inspire a move towards 89.52.

ECB leaves rates and stimulus unchanged

As widely expected, the European Central Bank kept its interest rates and stimulus program unchanged despite rising inflation across the bloc.

In its statement, the central bank said it would continue with its mammoth €1.85 trillion pandemic emergency purchase programme (PEPP) until at least March 2022 or until its judges that the Covid-19 crisis phase is over. The council stated that the pace of the PEPP purchases would be kept unchanged at a “significantly higher pace during the first months of the year”.

When it came to the staff projections and post-meeting press conference, Christine Lagarde sounded optimistic over the economic outlook. The growth forecasts for 2021 and 2022 were raised with GDP seen expanding 4.6% this year and 4.7% in 2022. In regard to inflation, the forecasts were increased to 1.9% in 2021 from 1.5% and 1.5% in 2022 from 1.2%. This means the ECB still sees current inflation as being temporary.

All in all, Lagarde struck an upbeat tone on economic growth and saw broadly balanced risks and stable financial conditions Despite the rosier outlook, the ECB maintained a safe distance from any mention of taper talks. The euro has been choppy but has found a bid above 1.2180 since the end of the press conference.

Commodity spotlight – Gold

Gold was injected with volatility on Thursday after the US inflation data exceeded market expectations. The precious metal appreciated as further signs of inflationary pressures boosted appetite for the commodity which is seen as a hedge against inflation. However, upside gains may be capped if inflation fears send US Treasury yields climbing and boost the dollar.

Lagging indicators remain in favour of the bulls with the MACD trading above the zero level while the 50-day Simple Moving Average has crossed above the 100-day. Gold bugs remain in the driving seat above the $1855 support level with $1916 acting as the first level of interest if $1900 proves to be weak resistance. Beyond $1916, gold has the potential to test $1927 and the year-to-date high a t $1959.

Alternatively, sustained weakness below $1900 could trigger a decline back towards $1870, $1855 and $1842.

Disclaimer: The content in this article comprises personal opinions and should not be construed as containing personal and/or other investment advice and/or an offer of and/or solicitation for any transactions in financial instruments and/or a guarantee and/or prediction of future performance. ForexTime (FXTM), its affiliates, agents, directors, officers or employees do not guarantee the accuracy, validity, timeliness or completeness, of any information or data made available and assume no liability as to any loss arising from any investment based on the same.


Forex-Time-LogoArticle by ForexTime

ForexTime Ltd (FXTM) is an award winning international online forex broker regulated by CySEC 185/12 www.forextime.com

Is Amazon readying an 11% surge higher from support?

By Admiral Markets

Amazon shares have rallied more than 120% higher since the lows of the pandemic in 2020. Since then, the retail giant’s share price has traded in a tight range.

News of a coordinated global tax tech caused some weakness but the shares have remained surprisingly resilient. But, perhaps, it is not that surprising to some.

In its latest earnings call, the company announced net sales have surged 44% to $108.5 billion while net income has also surged higher.

Investors point to even more growth in Amazon Prime, Amazon Studios and Amazon Web Services (AWS) – the latter accounting for a third of the global cloud computing market.

What do the charts tell us?

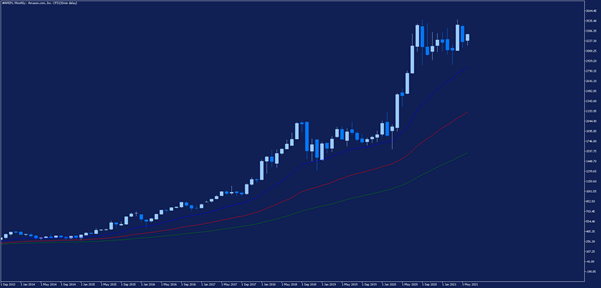
Source: Admirals MetaTrader 5, #AMZN, Monthly – Data range: from Sep 1, 2013, to Jun 10, 2021, performed on Jun 10, 2021, at 8:30 pm GMT. Please note: Past performance is not a reliable indicator of future results.
 

The monthly chart of Amazon’s share price shown above demonstrates a clear long-term trend higher and the consolidation of the price since October last year.

However, the 20-period (blue) exponential moving average and 50-period (red) exponential moving average are still moving higher, confirming an uptrend.

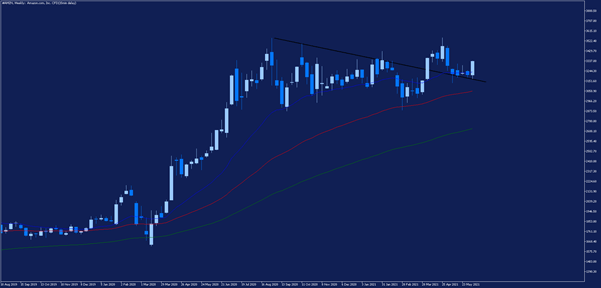
Source: Admirals MetaTrader 5, #AMZN, Weekly – Data range: from Aug 18, 2019, to Jun 10, 2021, performed on Jun 10, 2021, at 8:30 pm GMT. Please note: Past performance is not a reliable indicator of future results.


 

The most interesting chart from a technical analysis perspective is the weekly chart of Amazon’s share price shown above. The price has broken through a previous descending resistance line shown by the black line.

Interestingly, the price has now retested the same level – something technical analysts call resistance turning into support.

If the price can stay supported then it could represent a near 11% move higher back to the all-time high.

Did you know that you can use the Trading Central Technical Ideas Lookup indicator to find actionable trading ideas on thousands of different markets?

Start your free download by clicking on the banner below:

Download MetaTrader 5 Supreme Edition

INFORMATION ABOUT ANALYTICAL MATERIALS:

The given data provides additional information regarding all analysis, estimates, prognosis, forecasts, market reviews, weekly outlooks or other similar assessments or information (hereinafter “Analysis”) published on the websites of Admiral Markets investment firms operating under the Admiral Markets trademark (hereinafter “Admiral Markets”) Before making any investment decisions please pay close attention to the following:

  1. This is a marketing communication. The content is published for informative purposes only and is in no way to be construed as investment advice or recommendation. It has not been prepared in accordance with legal requirements designed to promote the independence of investment research, and that it is not subject to any prohibition on dealing ahead of the dissemination of investment research.
  2. Any investment decision is made by each client alone whereas Admiral Markets shall not be responsible for any loss or damage arising from any such decision, whether or not based on the content.
  3. With view to protecting the interests of our clients and the objectivity of the Analysis, Admiral Markets has established relevant internal procedures for prevention and management of conflicts of interest.
  4. The Analysis is prepared by an independent analyst, Jitan Solanki (analyst), (hereinafter “Author”) based on their personal estimations.
  5. Whilst every reasonable effort is taken to ensure that all sources of the content are reliable and that all information is presented, as much as possible, in an understandable, timely, precise and complete manner, Admiral Markets does not guarantee the accuracy or completeness of any information contained within the Analysis.
  6. Any kind of past or modeled performance of financial instruments indicated within the content should not be construed as an express or implied promise, guarantee or implication by Admiral Markets for any future performance. The value of the financial instrument may both increase and decrease and the preservation of the asset value is not guaranteed.
  7. Leveraged products (including contracts for difference) are speculative in nature and may result in losses or profit. Before you start trading, please ensure that you fully understand the risks involved.

By Admiral Markets

Does A Debt Relief Loan Hurt Your Credit?

If you have multiple debts, you can get overwhelmed, particularly if you aren’t in a position to clear them all as the loan terms demand. The best option to save the situation is to consider a debt relief loan. But does a debt relief loan hurt your credit? That’s the question we’ll answer, but before we answer it, you need to understand what a debt relief loan means.

Debt relief, just as the name suggests, refers to different ways of easing your debt burned through ways such as debt consolidation, debt settlement, debt negotiation, and even credit counseling.

All these efforts aim at one of the following goals: extending your loan term to reduce your monthly repayments, lowering the rate of interest charged on your loans including credit card loans, or reducing the outstanding principal owed to lenders.

accredited debt relief

How Debt Relief Affects Your Credit

Whether or not debt relief will affect your credit depends on how far you’ve delayed your payments and the debt relief method you’ve chosen. The fact is, if you let your accounts go beyond the due dates or you miss payments, your credit rating will be affected. You may be having several debts, but if you manage them well, your credit standing will still be impressive. A reputable debt relief expert can help you manage your debts responsibly to keep a high credit score.

Here are the different ways in which debt relief can affect your credit score:

Debt Settlement

This is a debt relief option that’s a little dangerous and can easily harm your credit rating. A debt settlement company will ask you to stop payment to your lender as they negotiate for you better deals. Bear in mind that your payment history is a major factor when it comes to determining your credit score. So the moment you stop payments, your credit score will be jeopardized. Debt settlement companies aren’t concerned about your credit rating. They aim to eliminate or lower the amount you owe. For this reason, make sure you deal with an accredited debt relief provider, so your deal doesn’t fail.

Also, consider how missing payments will impact your credit history and any tax consequences. Debt settlement should be your last option if other debt solutions fail to work.

Debt Management

If you are entangled in lots of debts that you find difficult to handle, then debt management would be your best option. Debt management won’t hurt your credit score in any way because it’s just a matter of creating a repayment plan that works best for you. And you don’t have to do it on your own. You can hire a credit counselor to deal with the lenders on your behalf.

Once the credit counselor has created a payment plan for you, it’s better to stick to it and be honest to honor it. Don’t miss any payments and delay your payments.

Debt Consolidation

Debt consolidation is a way of combining all your debts into one debt. This debt relief method won’t hurt your credit score if managed well. When you succeed in consolidating your debts, there are high chances the new lender will check your credit when appraising your application. This will result in a “hard inquiry”, which can hurt your credit rating but only for a short duration. Before you go for a debt consolidation loan, make sure you always make your payments in time to have a good credit score. Also, don’t apply for any new credit cards.

Bankruptcy

Bankruptcy is a way of getting debt relief, but it will greatly hurt your credit score. When you apply for bankruptcy and succeed, it will be part of your credit history for a decade. It will make it really hard for you to get any loans in the future. So before you consider getting declared bankrupt, try other options at your disposal.

Back to the question, does a debt relief loan hurt your credit? As you can see from our discussion, debt relief is both good and bad. It all depends on how you play your cards. Let a financial expert help you make an informed decision.

By Taylor Wilman

Murrey Math Lines 10.06.2021 (USDCHF, GOLD)

Article By RoboForex.com

USDCHF, “US Dollar vs Swiss Franc”

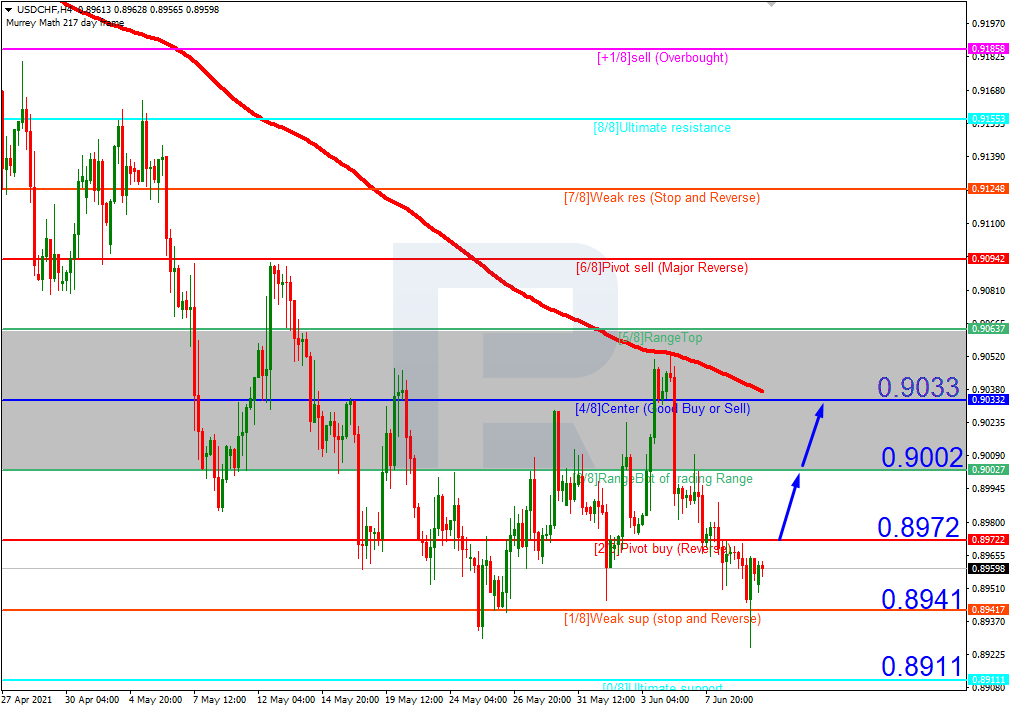
As we can see in the H4 chart, USDCH has rebounded from 1/8, thus indicating a possible ascending correction. In this case, the price is expected to break 2/8 and then continue growing to reach the resistance at 3/8. Still, this scenario may no longer be valid if the price breaks 1/8 to the downside. After that, the instrument may fall towards the support at 0/8.

USDCHF_H4
Risk Warning: the result of previous trading operations do not guarantee the same results in the future

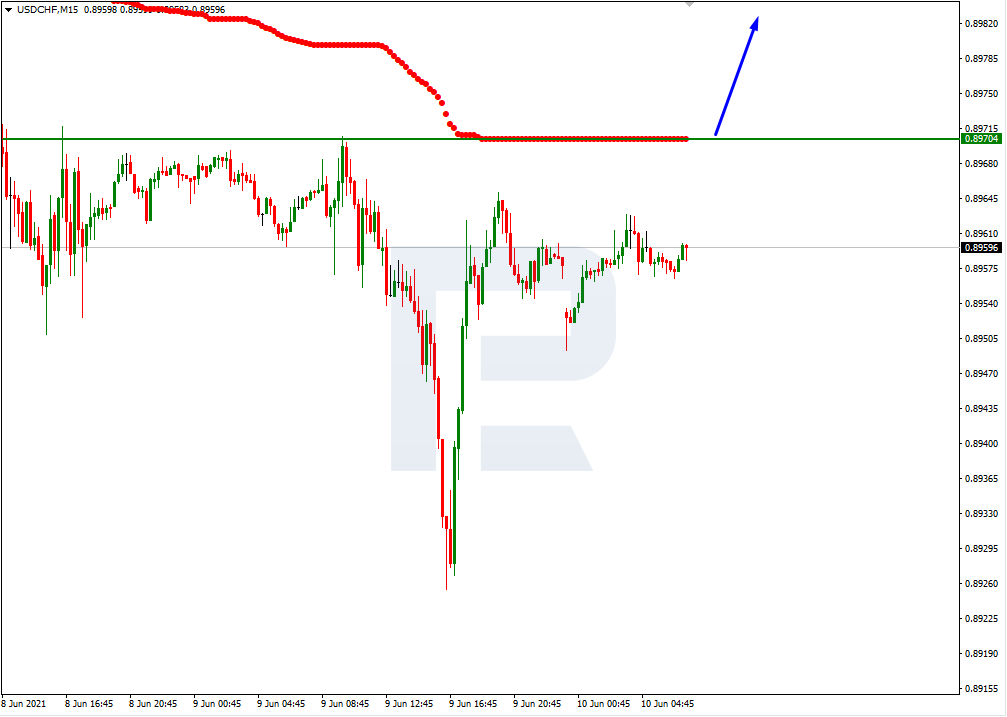
In the M15 chart, the pair may break the upside line of the VoltyChannel indicator and, as a result, continue the ascending tendency.

USDCHF_M15
Risk Warning: the result of previous trading operations do not guarantee the same results in the future

XAUUSD, “Gold vs US Dollar”

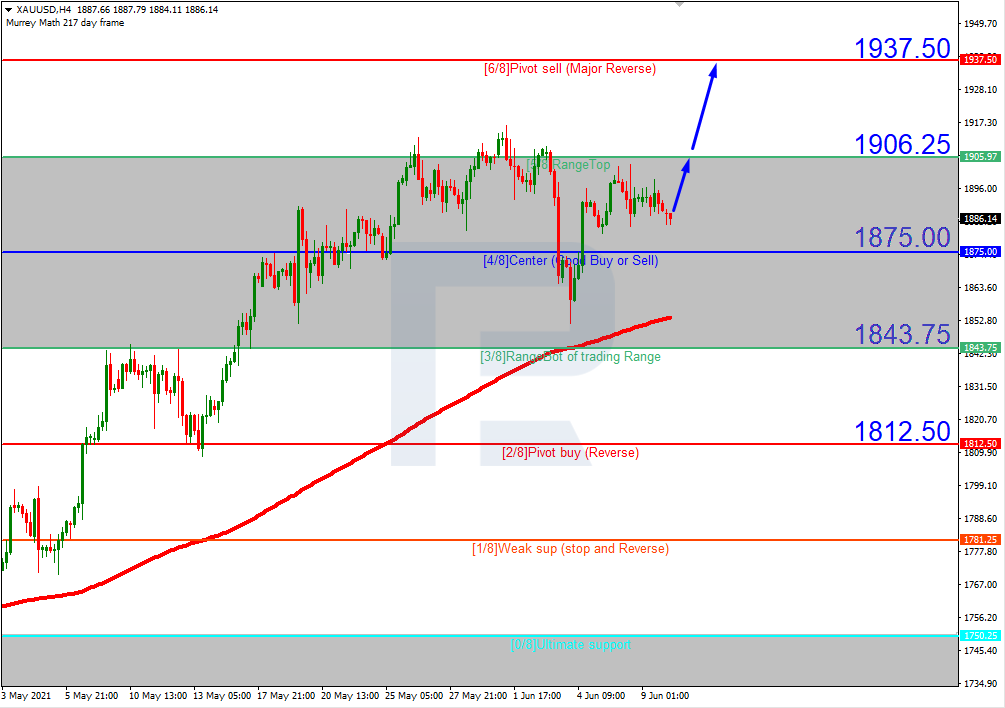
As we can see in the H4 chart, XAUUSD is still trading above the 200-day Moving Average, thus indicating an ascending tendency. In this case, the price is expected to test 5/8, break it, and continue growing to reach the resistance at 6/8. However, this scenario may no longer be valid if the price breaks 4/8 to the downside. After that, the instrument may reverse and correct towards 3/8.

XAUUSD_H4
Risk Warning: the result of previous trading operations do not guarantee the same results in the future

In the M15 chart, the pair may break the upside line of the VoltyChannel indicator and, as a result, continue moving upwards to reach 6/8 from the H4 chart.

XAUUSD_M15

Article By RoboForex.com

Attention!
Forecasts presented in this section only reflect the author’s private opinion and should not be considered as guidance for trading. RoboForex LP bears no responsibility for trading results based on trading recommendations described in these analytical reviews.

Forex Technical Analysis & Forecast 10.06.2021

Article By RoboForex.com

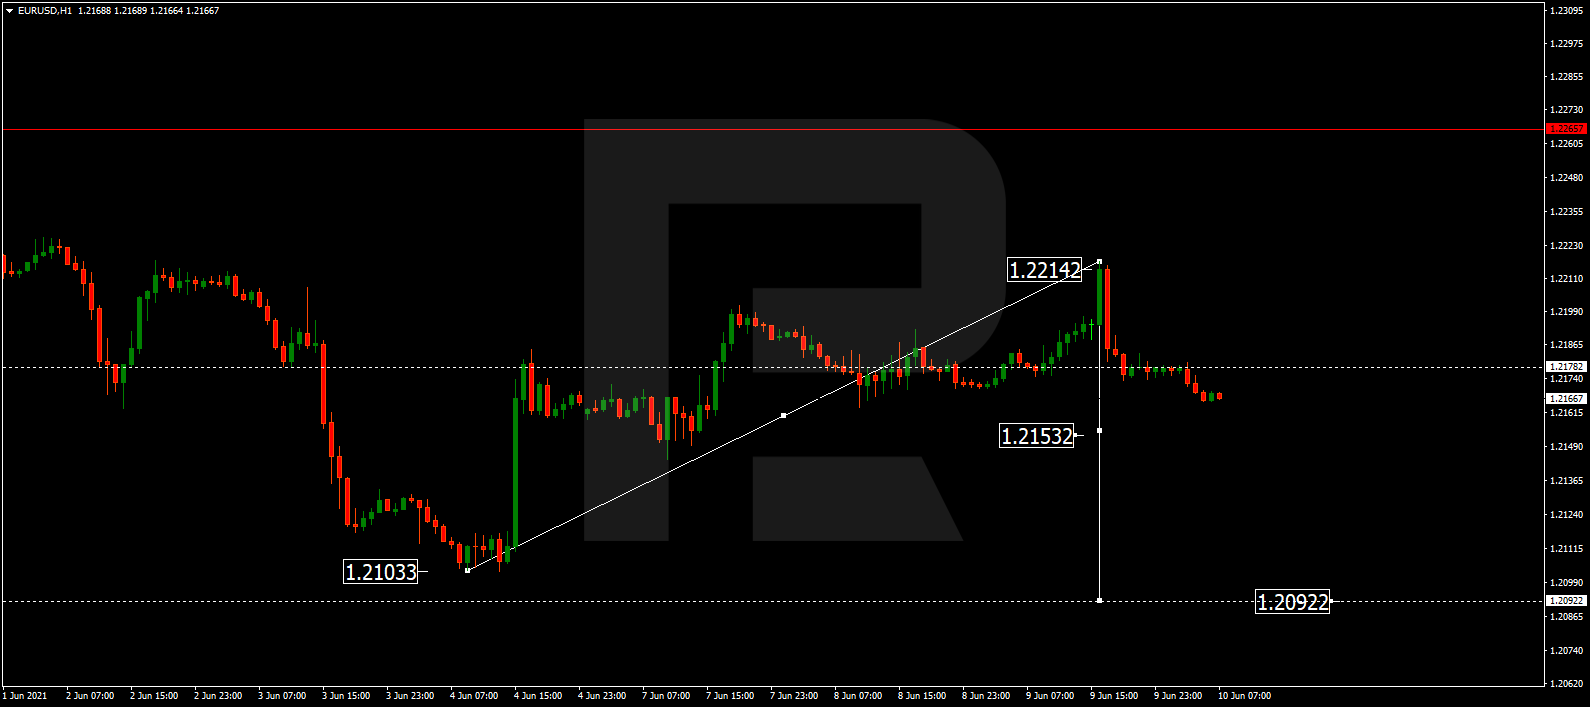
EURUSD, “Euro vs US Dollar”

EURUSD is still consolidating around 1.2178; after expanding the range up to 1.2214 and rebounding from this level, it is falling towards 1.2144. Today, the pair may break the latter level and then continue trading downwards with the target at 1.2090. After that, the instrument may start a new correction towards 1.2170.

EURUSD
Risk Warning: the result of previous trading operations do not guarantee the same results in the future

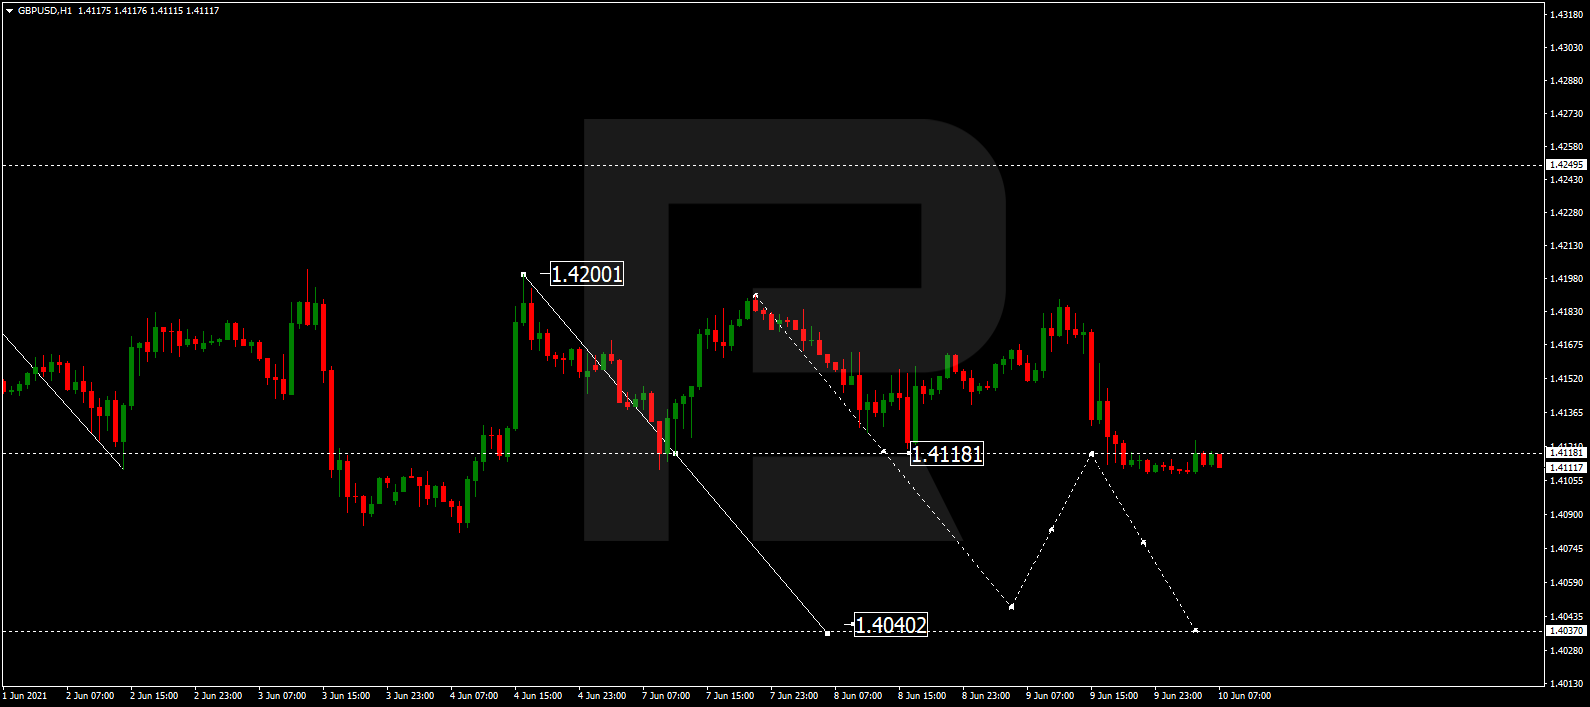
GBPUSD, “Great Britain Pound vs US Dollar”

After breaking 1.4111 and forming a new consolidation range around this level, GBPUSD is expected to continue falling 1.4040. Later, the market may correct to return to 1.4111 and form one more ascending structure with the target at 1.4000.

GBPUSD
Risk Warning: the result of previous trading operations do not guarantee the same results in the future

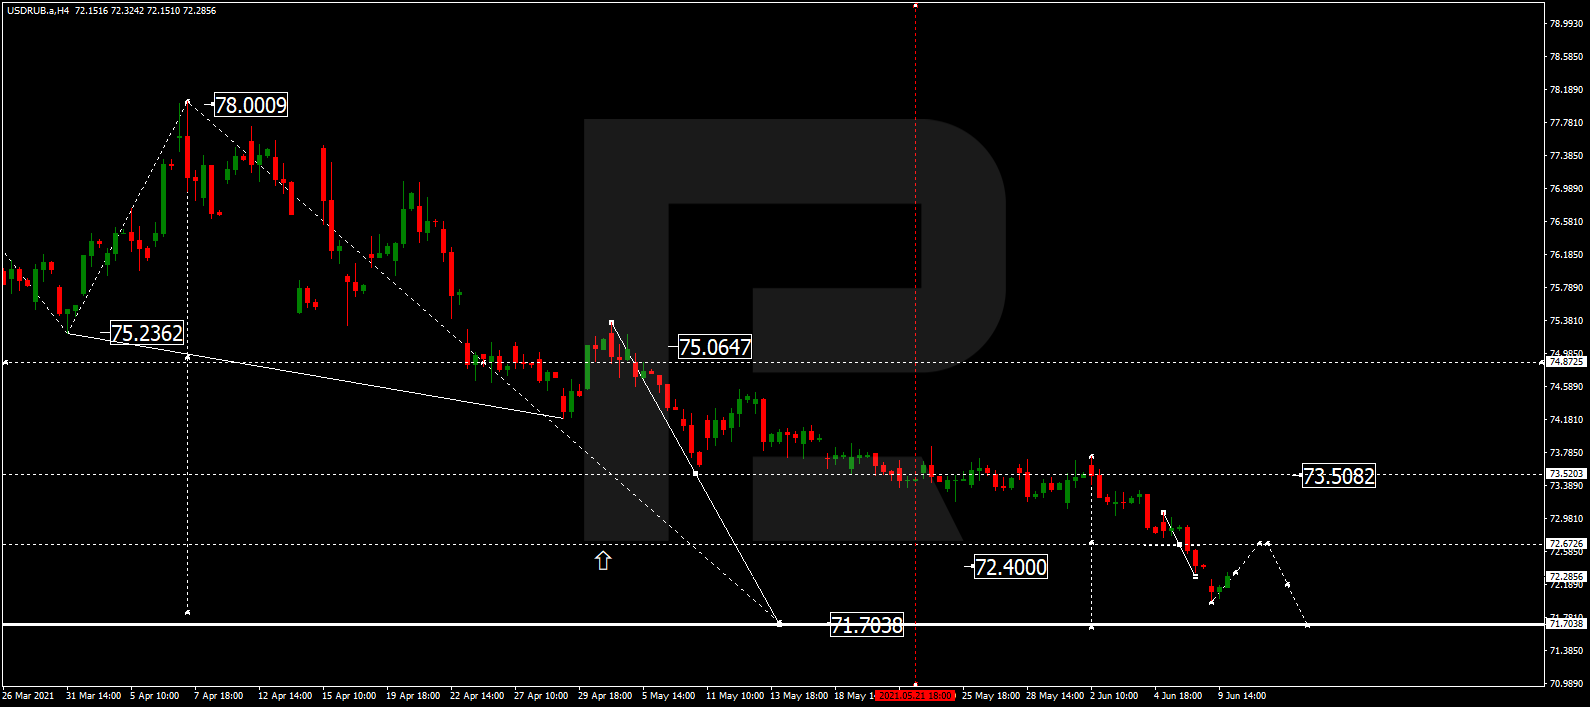
USDRUB, “US Dollar vs Russian Ruble”

After finishing the descending wave at 72.00, USDRUB is expected to correct towards 72.55. After that, the instrument may resume trading downwards with the target at 71.71 or even reach 71.50.

USDRUB
Risk Warning: the result of previous trading operations do not guarantee the same results in the future

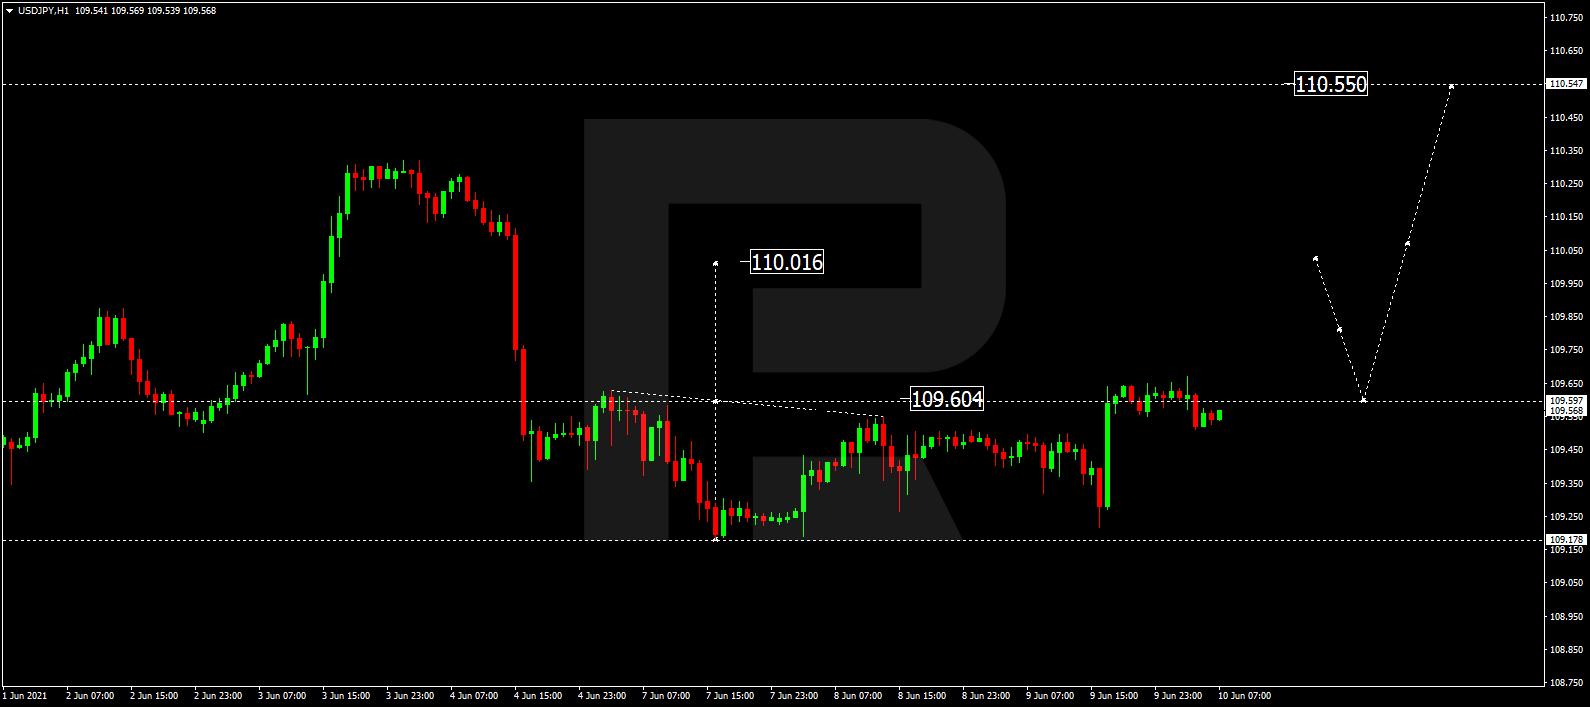
USDJPY, “US Dollar vs Japanese Yen”

After completing the ascending wave at 109.60, USDJPY is consolidating around this level. Today, the pair may grow to break 110.00 and then form one more ascending structure with the target at 110.55.

USDJPY
Risk Warning: the result of previous trading operations do not guarantee the same results in the future

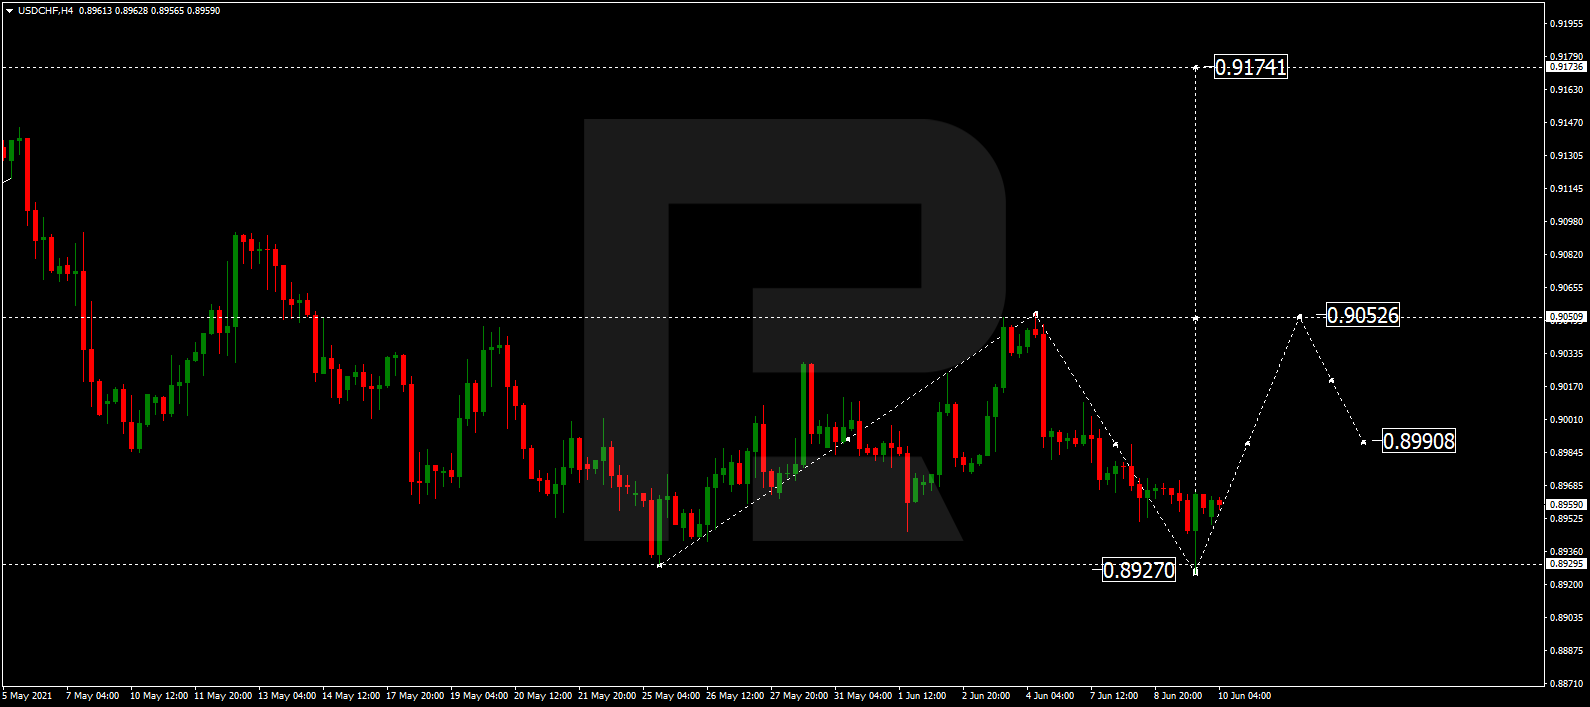
USDCHF, “US Dollar vs Swiss Franc”

After reaching the downside border of the range at 0.8927 and rebounding from this level to the upside, USDCHF is growing. Possibly, today the pair may reach the upside border of the range at 0.9050. Later, the market may break this level and then continue trading upwards with the short-term target at 0.9174.

USDCHF
Risk Warning: the result of previous trading operations do not guarantee the same results in the future

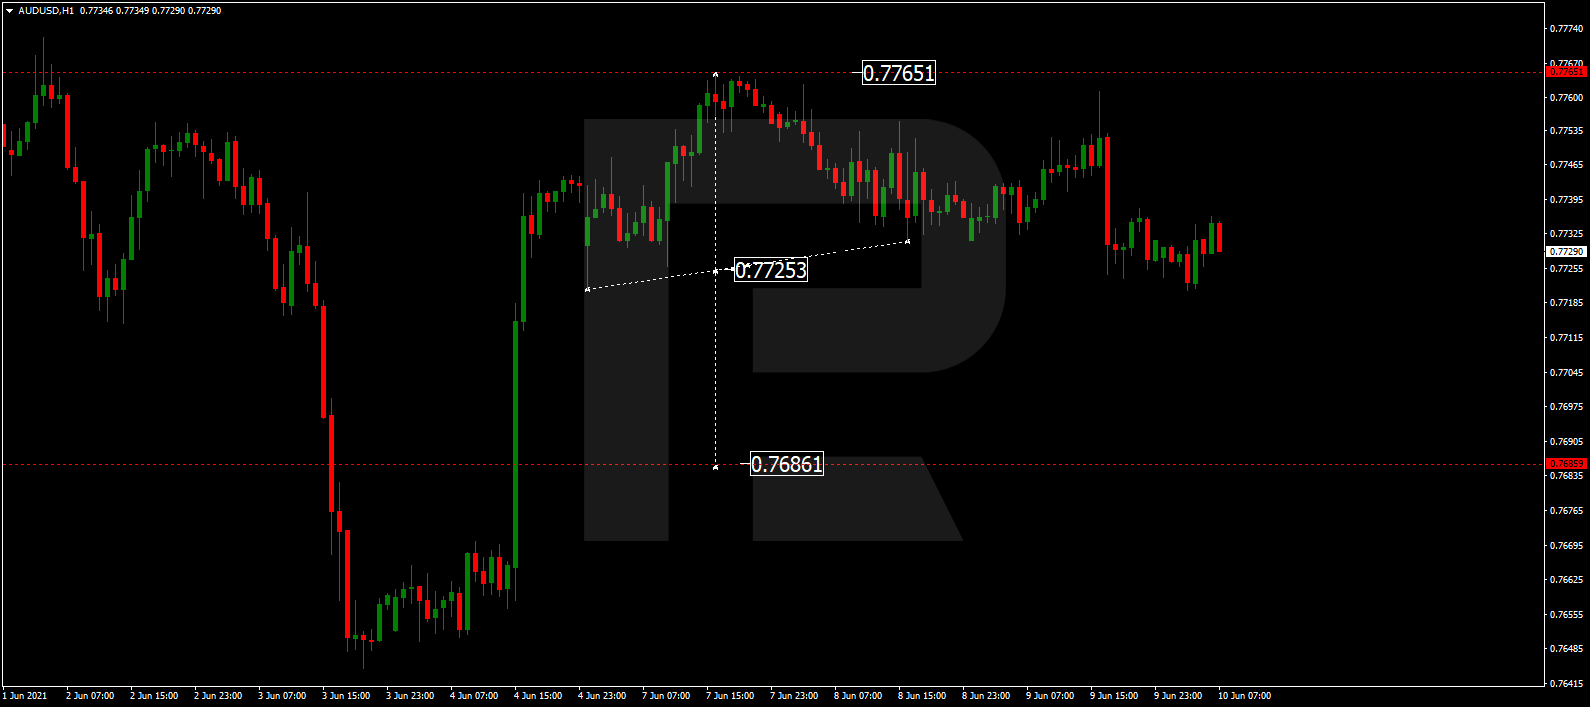
AUDUSD, “Australian Dollar vs US Dollar”

AUDUSD has finished the descending structure at 0.7725; right now, it is consolidating around this level. Today, the pair may break this range to the downside and continue trading downwards with the first target at 0.7686.

AUDUSD
Risk Warning: the result of previous trading operations do not guarantee the same results in the future

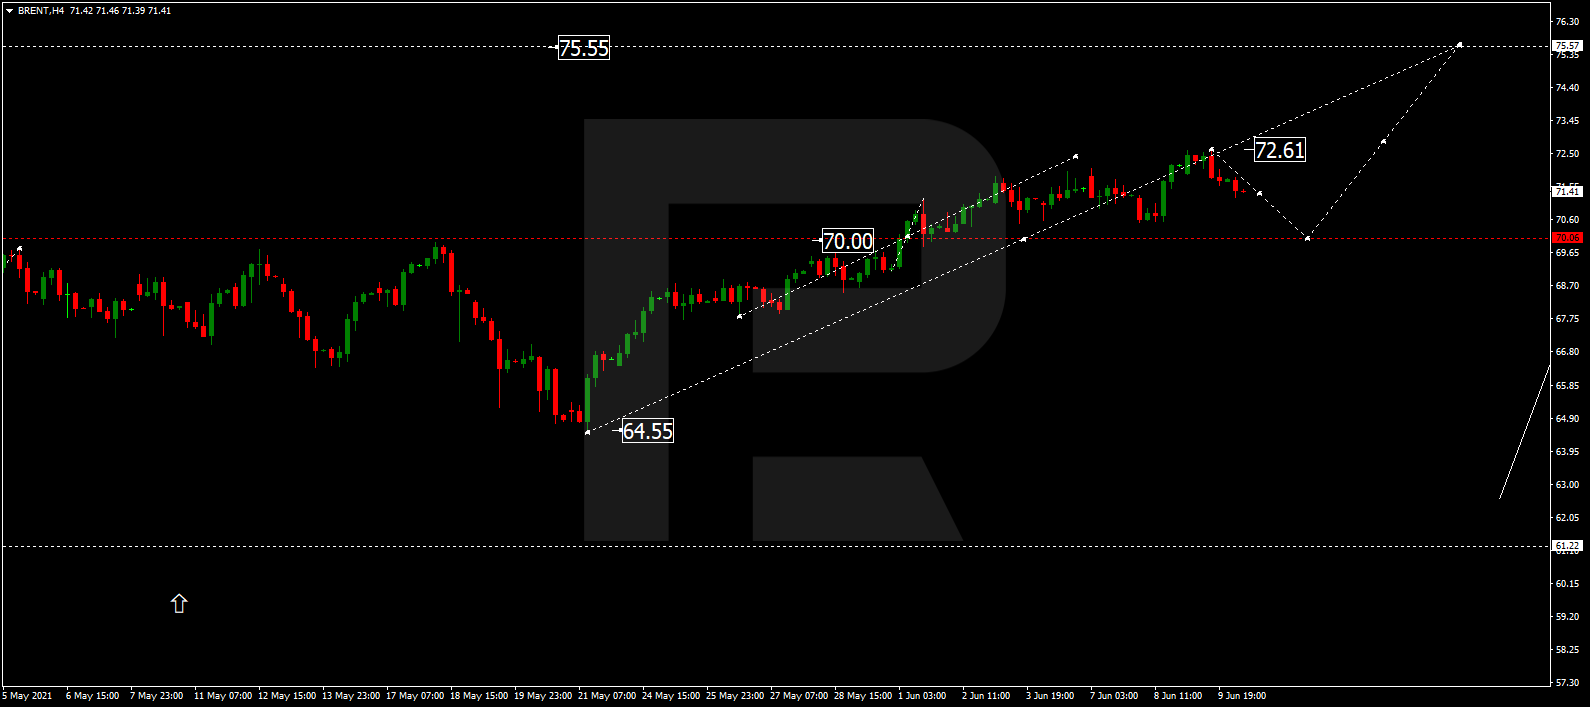
BRENT

Brent has expanded the range up to 72.61. Possibly, today the asset may correct towards 70.00 and then resume trading upwards with the short-term target at 75.55. After that, the instrument may start a new correction to reach 70.00.

BRENT
Risk Warning: the result of previous trading operations do not guarantee the same results in the future

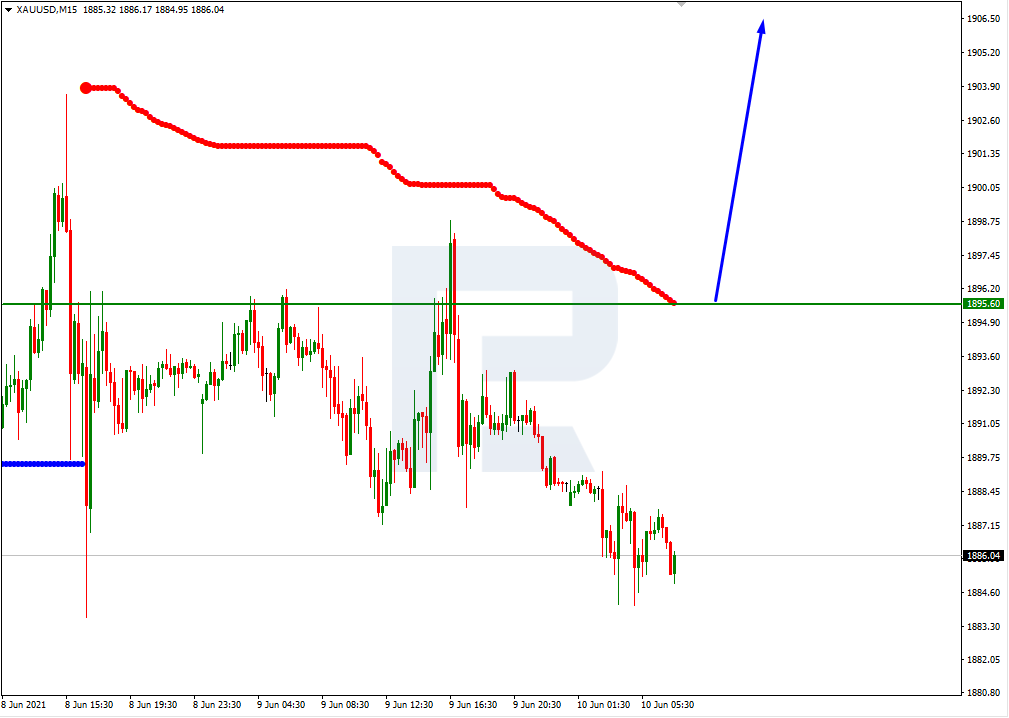
XAUUSD, “Gold vs US Dollar”

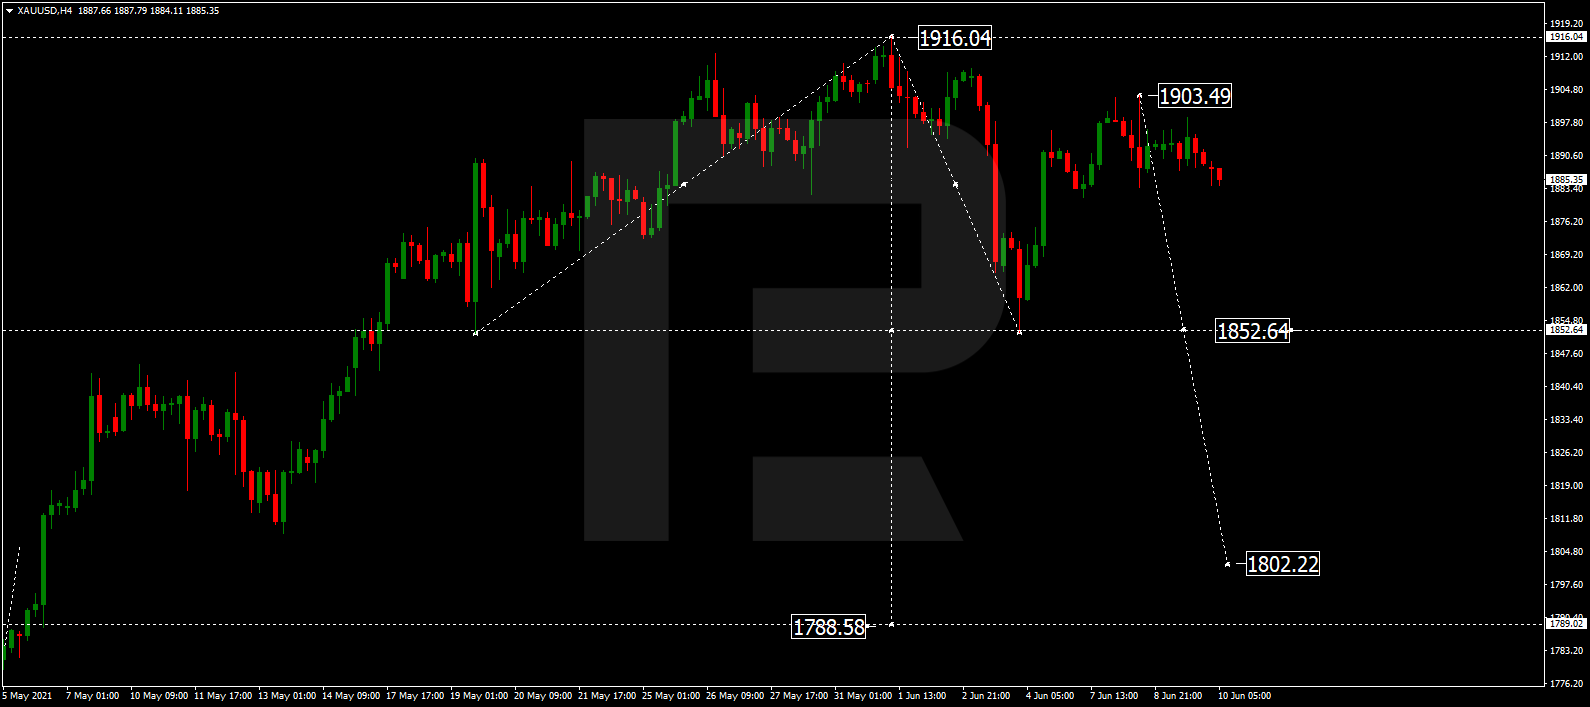
Gold is falling towards 1852.64. Possibly, the metal may break this level to the downside and form a new descending structure with the short-term target at 1802.22.

GOLD
Risk Warning: the result of previous trading operations do not guarantee the same results in the future

S&P 500

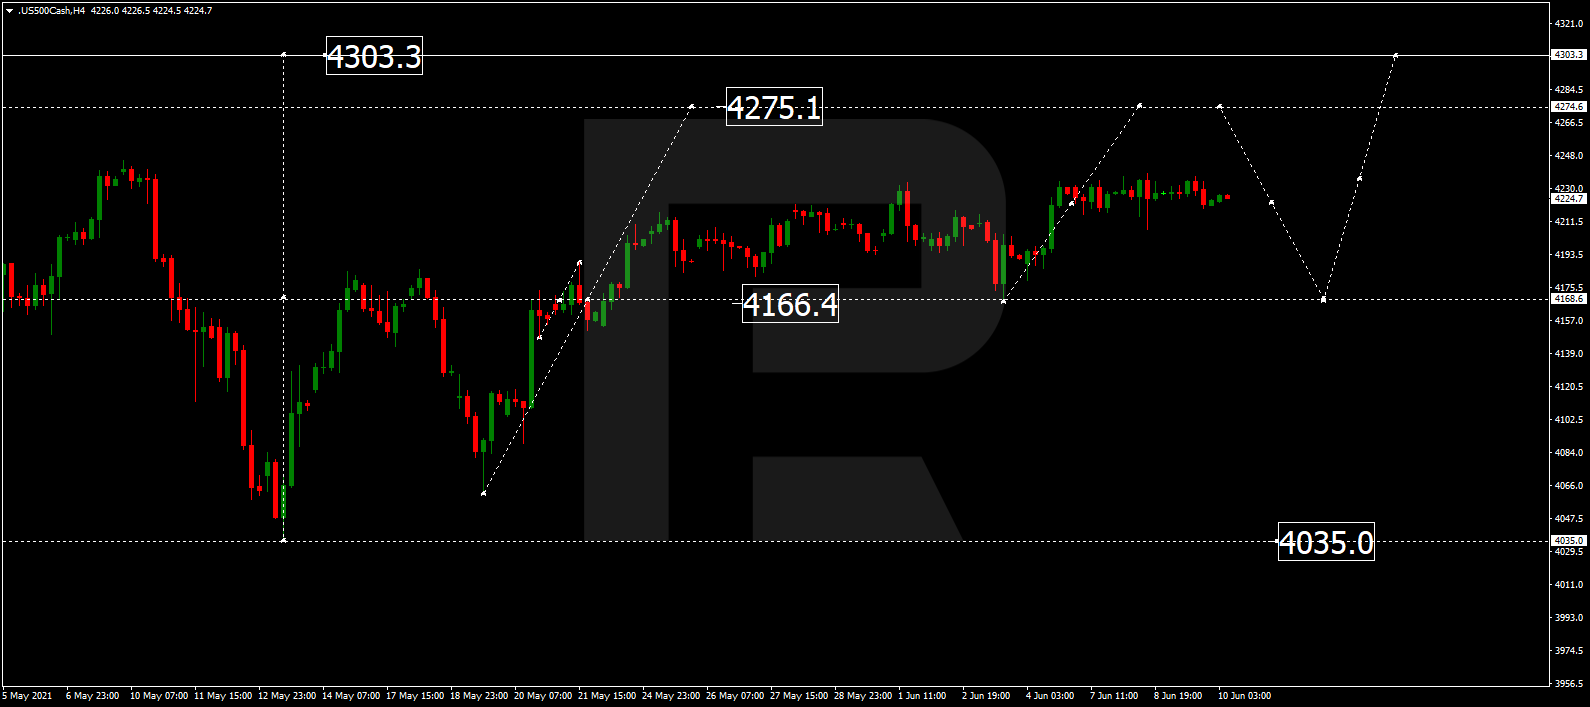
The S&P index is still consolidating around 4222.0 without any particular direction. Possibly, today the asset may break this range to the upside and resume growing towards 4275.1. After that, the instrument may correct downwards to reach 4170.0 and then form one more ascending structure with the target at 4303.3.

S&P 500

Article By RoboForex.com

Attention!
Forecasts presented in this section only reflect the author’s private opinion and should not be considered as guidance for trading. RoboForex LP bears no responsibility for trading results based on trading recommendations described in these analytical reviews.

Inflation debate volatility will shape markets for the rest of 2021

By George Prior

– Inflation debate volatility will define stock markets in the second half of 2021, and investors need to be “super-selective” and ensure “proper diversification,” to take advantage of the turbulence, warns the CEO of one of the world’s largest independent financial advisory and fintech organizations.

The warning from Nigel Green, deVere Group CEO and founder, comes ahead of the release of inflation figures for the biggest economy in the world.

The U.S. CPI is predicted to rise to a 13-year high of 4.7% from a year earlier, up from 4.2% in April – which was already the fastest jump since 2008.

Mr Green says: “Global financial markets are bracing for further turbulence as attention focuses on inflation for the world’s largest economy.

“A larger-than-expected rise in U.S. core inflation and a retreat in commodities and equities may result in a sharp increase in volatility across most asset classes.

“It will stir fears that central banks will be forced to row back from policies that have kept interest rates low, driven liquidity and provided fuel for the stock market gains.”

He continues: “If inflation is lower than expected, the rising prices will more likely be seen as transient, and that they will fade after pent-up consumer spending drops back and the supply bottlenecks ease.

“Either way, today’s inflation figures won’t end the debate amongst investors – in fact, it will get hotter – as it remains too early to say either way about whether inflation is transient or persistent.

“This debate will stir-up volatility which will define the second half of 2021 in global financial markets.”

This market turbulence demands that “investors ensure proper diversification of their portfolios” if they are “serious about creating, building and safeguarding wealth,” says Mr Green.

Diversification is universally regarded as investors’ best tool to mitigate risk and seize opportunities. A sufficiently diversified portfolio covers geographical regions, asset classes, sectors and currencies.

The deVere CEO goes on to add: “We can expect a stronger than had previously been forecast global economic rebound this year, particularly in developed economies.

“We are likely to see the fastest growth in decades – and investors will want to capitalize on this.

“But as the world readjusts investors must be super-selective as there will be ongoing volatility.

“We saw this last month with the tech sell-off – although nobody seriously believes the future isn’t going to be tech-driven.  As such savvy investors were drawn to the massive growth that tech offers and used the sell-off as a buying opportunity.”

Mr Green concludes: “This is a major day for the markets. The inflation argument is here to stay for at least the rest of 2021, stirring up volatility. Investors need to shore-up their portfolios to seize the opportunities that this will provide.”

About:

deVere Group is one of the world’s largest independent advisors of specialist global financial solutions to international, local mass affluent, and high-net-worth clients.  It has a network of more than 70 offices across the world, over 80,000 clients and $12bn under advisement.

The Analytical Overview of the Main Currency Pairs on 2021.06.10

by JustForex

The EUR/USD currency pair

Technical indicators of the currency pair:
  • Prev Open: 1.2172
  • Prev Close: 1.2178
  • % chg. over the last day: +0.05%

On Wednesday, the EUR/USD currency pair tried to break through the priority change level, but the sellers managed to defend their positions. As a result, the euro bounced back down to the nearest support level. At the moment, the price is trading in the middle of the wide 1.2134-1.2243 range. Today, the ECB will report on the interest rate. The rate is expected to remain unchanged, but the euro is likely to be sensitive to changes in analysts’ forecasts.

Trading recommendations
  • Support levels: 1.2168, 1.2134, 1.2112, 1.2074, 1.2026, 1.2002, 1.1957
  • Resistance levels: 1.2212, 1.2243, 1.2311

Technically, the global downward correction movement is not over yet. The price failed to break through the priority change level of 1.2112. Under such market conditions, traders are better to look for both sell trades from the nearest resistance levels and buy trades from the support levels.

Alternative scenario: if the price breaks out through the 1.2212 resistance level and fixes above, the general uptrend is likely to resume.

EUR/USD
News feed for 2021.06.10:
  • – ECB Interest Rate Decision (m/m) at 14:45 (GMT+3);
  • – ECB Monetary Policy Statement (m/m) at 14:45 (GMT+3);
  • – ECB Press Conference at 15:30 (GMT+3);
  • – US Consumer Price Index (m/m) at 15:30 (GMT+3);
  • – US Core CPI (m/m) at 15:30 (GMT+3);
  • – US Initial Jobless Claims (w/w) at 15:30 (GMT+3);
  • – US 10-y Bond Auction at 20:01 (GMT+3).

The GBP/USD currency pair

Technical indicators of the currency pair:
  • Prev Open: 1.4151
  • Prev Close: 1.4112
  • % chg. over the last day: -0.27%

The GBP/USD currency pair decreased by 0.27% on Wednesday. The sellers are pushing the price to the lower boundary of a wide corridor again. Taking into account the lack of response from the buyers, the price is very likely to decline.

Trading recommendations
  • Support levels: 1.4110, 1.4075, 1.3996, 1.3913,1.3835, 1.3801, 1.3756, 1.3690
  • Resistance levels: 1.4191, 1.4212, 1.4338

At the moment, the price is trading below the moving average, and the MACD indicator in the negative area. The trend of the GBP/USD currency pair remains bullish, as the price is above the priority change level, but sellers’ pressure is stronger now. Under such market conditions, traders are better to look for both buy trades from the support levels and sell trades from the nearest resistance levels within the bearish momentum.

Alternative scenario: if the price breaks down through the 1.4075 support level and consolidates below, the bullish scenario is likely to be canceled.

GBP/USD
There is no news feed for today.

The USD/JPY currency pair

Technical indicators of the currency pair:
  • Prev Open: 109.49
  • Prev Close: 109.63
  • % chg. over the last day: +0.13%

The USD/JPY currency pair has formed a flat with the 109.18-109.63 range. The currency pair is in a contradictory situation right now, as both the dollar index and the Japanese yen are showing weakness. When both currencies show weakness, the price of the currency pair is usually trading in a corridor. Today’s US inflation data could trigger big moves of the USD/JPY price.

Trading recommendations
  • Support levels: 109.63, 109.35, 109.18, 108.66, 108.44, 108.19, 107.77
  • Resistance levels: 109.83, 110.09 110.51, 110.73

Technically, the mid-term trend is bullish as the price is above the priority change level of 109.18. The price is trading near the moving average while the MACD indicator is inactive. Under such market conditions, traders are better to look for both buy trades from the nearest support levels and sell trades from the resistance levels. But the buyers are more active now.

Alternative scenario: if the price falls below 109.18, the general downtrend is likely to resume.

USD/JPY
There is no news feed for today.

The USD/CAD currency pair

Technical indicators of the currency pair:
  • Prev Open: 1.2107
  • Prev Close: 1.2106
  • % chg. over the last day: -0.01%

The Central Bank of Canada kept its monetary policy unchanged. The USD/CAD currency pair did not react to this report. At the end of the day, the price closed at the same level.

Trading recommendations
  • Support levels: 1.2069, 1.2032, 1.1944
  • Resistance levels: 1.2137, 1.2251, 1.2321, 1.2388, 1.2414, 1.2519

Technically, the trend remains bearish. But the current momentum is strictly bullish. Under such market conditions, traders are better to look for both sell trades from the nearest resistance levels and buy trades from the support levels, but only on intraday timeframes. Though, it should be noted that the price is still inside a wide corridor with the 1.2032-1.2137 range.

Alternative scenario: if the price breaks out through the 1.2137 resistance level and fixes above, a local corrective uptrend is likely to form.

USD/CAD
There is no news feed for today.

by JustForex


This article reflects a personal opinion and should not be interpreted as an investment advice, and/or offer, and/or a persistent request for carrying out financial transactions, and/or a guarantee, and/or a forecast of future events.

Today all investors and traders’ attention is focused on the ECB interest rate report and the US inflation data

by JustForex

Yesterday, the US indices were trading in a narrow price range. This is not surprising as no one wants to take additional risk, and everyone was braced for the consumer price index data, which is an indicator of inflation. The US economists expect inflation to rise 0.4% in monthly terms and up to 4.8% annually. Core inflation is expected to be 3.4%. If the report turns out to be worse than those expectations, the market may react very negatively as investors will start to close their positions with the fears that the Fed will start to cut its stimulus measures earlier.

European indices were slightly lower on Wednesday. Today, the ECB will report on its interest rate. The European Central Bank does not plan to change its program of massive economic stimulation in the near future, so all attention of European investors is focused on inflation data from the US.

Inflation data will also influence gold prices. Rising inflation will push gold higher, while declining inflation may cause sales in precious metals. But investors should not expect a downtrend on gold as the US Treasury yield fell below 1.5%, and the gold has an inverse correlation to that indicator.

Crude oil inventory data showed weaker-than-expected demand for the fuel at the beginning of the peak summer season. Crude oil futures decreased by 0.8% on Wednesday. In India, the world’s third-largest oil consumer, fuel demand fell to its lowest level since last August in May.

Asian stock indices rose slightly on Wednesday but still trade in narrow ranges as investors await the US inflation data. Japan’s Nikkei and Australia’s ASX indices increased by 0.4% each. China’s blue-chip index CSI300 jumped by 0.9%. The Asian market is highly correlated with the US market now.

Main market quotes:

S&P 500 (F) 4,219.55 -7.71 (+0.18%)

Dow Jones 34,447.14 -152.68 (-0.44%)

DAX 15,581.14 -59.46 (-0.38%)

FTSE 100 7,081.01 -14.08 (-0.20%)

USD Index 90.15 +0.07 (+0.08%)

Important events:
  • – Australia MI Inflation Expectations (m/m) at 04:00 (GMT+3);
  • – ECB Interest Rate Decision (m/m) at 14:45 (GMT+3);
  • – ECB Monetary Policy Statement (m/m) at 14:45 (GMT+3);
  • – ECB Press Conference at 15:30 (GMT+3);
  • – US Consumer Price Index (m/m) at 15:30 (GMT+3);
  • – US Core CPI (m/m) at 15:30 (GMT+3);
  • – US Initial Jobless Claims (w/w) at 15:30 (GMT+3);
  • – Natural Gas Storage (w/w) at 17:30 (GMT+3);
  • – US 30-y Bond Auction at 20:01 (GMT+3).

by JustForex


This article reflects a personal opinion and should not be interpreted as an investment advice, and/or offer, and/or a persistent request for carrying out financial transactions, and/or a guarantee, and/or a forecast of future events.

Main Events of the Week!

By Lukman Otunuga Research Analyst, ForexTime

Grab the popcorn everyone and fingers on the mouse! Everyone in the market has been eagerly anticipating today’s risk events with the start of the ECB meeting and the US inflation numbers being released at 12.30GMT. Narrow ranges and quiet markets have been the order of the week so let’s hope there is some excitement later today.

Transitory versus sustained?

Headline and core prices are expected to jump to 4.7% and 3.5% respectively in the US CPI numbers with base effects being the primary reason for the surge higher. This should be the peak for US prices with the trend starting to come down in June, although some economists still believe they will remain elevated and above target through the rest of the year. But the Fed is in no rush to respond as it is happy to look through the spike in rising prices, especially as the latest US job figures provide a further excuse for its patient stance.

We’ve seen bond markets move already with yields falling steadily all week with the widely-watched US 10-year Treasury now trading below 1.5%, the first time since March. A bumper headline number to the topside of estimates is surely needed to arrest this fall, but bond markets are known to generally lead markets so it will be fascinating to see who is right later today.

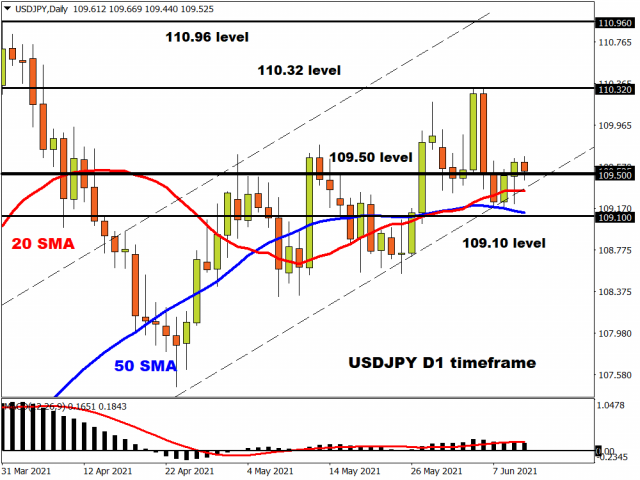
USD/JPY has been tracking sideways this week in a narrow range around 109.50. A bumper CPI print would push the pair higher and challenge last week’s highs at 110.32/33 while support rests at the 50-day SMA at 109.10 near this week’s lows.

ECB meeting and taper talk

ECB officials have recently been talking down any mention of tapering bond buys in the emergency ECB programme but there are some expectations that there may be a small change in guidance. This would come in the statement with a shift from “significantly” to “moderately” higher than at the start of the year and see buying cut to €70bn/month versus the current rate of €80bn/month. If President Lagarde does not repeat this “taper on hold” message or there is a communication error, then the risks are skewed to a higher euro as market expectations are generally currently cautious.

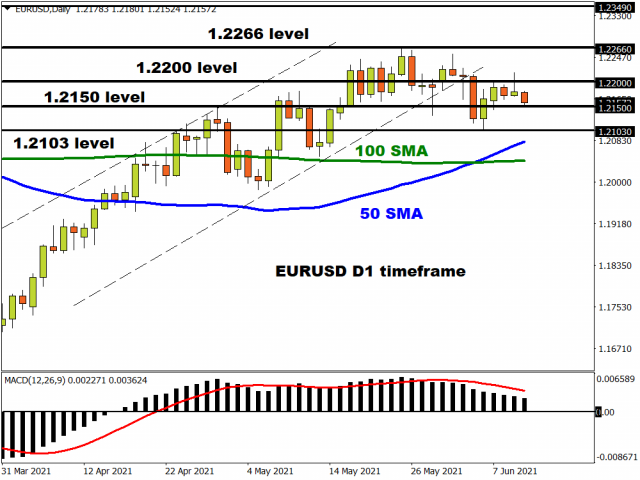
EUR/USD has been treading water this week either side of 1.22. Any bullish talk from Lagarde will see the pair push higher towards end of May highs at 1.2266 with the January peak at 1.2349. Last Friday’s low at 1.2103 is support if the ECB gets out its very patient and vigilant card.

Disclaimer: The content in this article comprises personal opinions and should not be construed as containing personal and/or other investment advice and/or an offer of and/or solicitation for any transactions in financial instruments and/or a guarantee and/or prediction of future performance. ForexTime (FXTM), its affiliates, agents, directors, officers or employees do not guarantee the accuracy, validity, timeliness or completeness, of any information or data made available and assume no liability as to any loss arising from any investment based on the same.


Forex-Time-LogoArticle by ForexTime

ForexTime Ltd (FXTM) is an award winning international online forex broker regulated by CySEC 185/12 www.forextime.com