The US Federal Reserve has a plan in case a temporary rise in inflation suddenly changes to a steady one

by JustForex

The main US stock indices ended Monday’s trading in different directions. Nasdaq became the strongest performer, which jumped by 0.74%. The S&P 500 index also increased by 0.18%, while Dow Jones decreased by 0.25% at the end of the day. The technology sector was the growth leader, but the financial sector, on the contrary, was in the red zone. Investors’ confidence in the further growth of the indices has become stronger, but there are still some worries before the Fed meeting this Wednesday.

On Monday, ECB head Christine Lagarde said that the current monetary policy and stimulus measures in the eurozone should be maintained until a solid economic recovery is established. European indices closed without a single trend on Monday. A lot will depend now on what Jerome Powell will tell at the Fed meeting on Wednesday.

The negotiations to reopen Iranian crude supplies to the market are at a stalemate again, pushing oil prices higher. Last week, OPEC announced that oil reserves are now 25 million barrels less in comparison with the 5-year average. This indicates that oil still has the potential to grow further.

Yesterday, gold fell in the European session, but sharply rebounded in the American session. Silver has a more confident position now. The fundamental picture for the precious metals is still positive, so a significant decline in prices should not be expected.

Asian stock market follows the American one. Japan’s Nikkei index closed Monday’s trading with the increase and continued to rise at the opening of trading on Tuesday. Australia’s ASX200 added 0.92%. The Bank of Japan’s monetary policy decision will be announced on Friday. More than 85% of analysts believe that Japan will not start to roll back the stimulus until 2023, as the economy is still far from pre-pandemic levels. Japan’s GDP decreased by 3.9% in annualized terms. Tokyo will host the Olympic Games next month.

Main market quotes:

S&P 500 (F) 4,255.15 +7.71 (+0.18%)

Dow Jones 34,393.75 -85.85 (-0.25%)

DAX 15,673.64 -19.63 (-0.13%)

FTSE 100 7,146.68 +12.62 (+0.18%)

USD Index 90.51 -0.04 (-0.05%)

Important events:
  • – Australia Monetary Policy Meeting at 04:30 (GMT+3);
  • – UK Unemployment Rate (m/m) at 09:00 (GMT+3);
  • – UK BOE Governor Andrew Bailey Speaks at 15:15 (GMT+3);
  • – US Retail Sales (m/m) at 15:30 (GMT+3);
  • – US Producer Price Index (m/m) at 15:30 (GMT+3);
  • – US Industrial Production (m/m) at 16:15 (GMT+3).

by JustForex


This article reflects a personal opinion and should not be interpreted as an investment advice, and/or offer, and/or a persistent request for carrying out financial transactions, and/or a guarantee, and/or a forecast of future events.

Markets cautious ahead of Fed meeting

By Lukman Otunuga Research Analyst, ForexTime

Asian shares were a mixed bag this morning even after Wall Street closed at record highs overnight.

Caution will most likely remain a key theme as investors wait for this week’s FOMC meeting for clues on future monetary policy. Although the Fed is widely expected to leave interest rates and policy measures unchanged, all eyes will be on the statement language, updated economic projections and Chair Jerome Powell’s post-meeting press conference. The Fed has managed to persuade markets that the current jump in inflation is transitory. The question is for how long will they keep this mantra?

Ahead of the Fed’s highly anticipated policy meeting, investors may direct their attention towards a slew of data from the United States which may provide more clues on how the economy is faring.

Dollar on standby ahead of US retail sales & PPI 

The dollar has struggled for direction on Tuesday morning as market players adopt a defensive approach ahead of the US retail sales report, industrial production and PPI data later in the day.

Given how the greenback remains sensitive to inflation expectations, the pending economic reports could trigger volatility ahead of the Fed meeting on Wednesday. Despite roughly half of the US population receiving at least one dose of the vaccine and the further reopening of the economy, retail sales are expected to soften in May after the flat number in April. According to a Bloomberg News survey, the headline figure is estimated to have contracted by -0.7% last month.

Given how US inflation has jumped to its highest level since 2008, there will be some focus on the Producer Price Index (PPI) for May. It must be kept in mind that the PPI often serves as a leading indicator for inflation and could provide clues on whether to expect further inflationary pressures down the road. Last month’s figure is forecast to remain unchanged at 6.2% year-on-year, but the core is expected to jump from 4.1% to 4.8% according to Bloomberg.

Looking at the technical picture, the Dollar Index is currently trading marginally below the 90.45 level. A daily close below this point could open a path back towards 90.00 ahead of the Fed meeting.

Pound wobbles above 1.4100 

The British Pound entered Tuesday’s session tired and exhausted after UK Prime Minister Boris Johnson delayed lifting the remaining Covid-19 restrictions until Monday 19 July. Sterling has weakened slightly against every single G10 currency excluding the Australian Dollar and Norwegian Krone. With the final step of the Government’s Covid-19 lockdown easing roadmap delayed by four weeks, the question remains whether this will impact the UK’s economic recovery from the pandemic.

Earlier this morning, the UK’s Office for National Statistics (ONS) published data that showed the unemployment rate fell to 4.7% for the three months to April marking the fourth consecutive monthly fall in the jobless rate. Unemployment is expected to rise again once the furlough scheme ends in September.

Looking at the technical picture, GBPUSD is struggling to keep above the 1.4100 level. A breakdown below this point could open a path towards 1.4000 in the near term.

Commodity spotlight – Gold 

Gold prices collapsed like a tower of Jenga yesterday as jitters around the Federal Reserve outlining a path for scaling back emergency stimulus weighed heavily on the precious metal. Although prices later clawed back most of the losses, gold remains under pressure on the daily charts.

Where the metal ends this week is likely to be heavily influenced by the Fed monetary policy meeting. If the central bank remains dovish and continues to preach the “transitory” mantra, this could inject gold bugs with fresh inspiration to challenge the $1900 psychological level.

Alternatively, any hint of tapering discussions or presence of hawks in the meeting could deal a blow to gold prices. Such a development may drag prices back below the $1855 level.

Disclaimer: The content in this article comprises personal opinions and should not be construed as containing personal and/or other investment advice and/or an offer of and/or solicitation for any transactions in financial instruments and/or a guarantee and/or prediction of future performance. ForexTime (FXTM), its affiliates, agents, directors, officers or employees do not guarantee the accuracy, validity, timeliness or completeness, of any information or data made available and assume no liability as to any loss arising from any investment based on the same.


Forex-Time-LogoArticle by ForexTime

ForexTime Ltd (FXTM) is an award winning international online forex broker regulated by CySEC 185/12 www.forextime.com

Quiet start, all-time highs

By Lukman Otunuga Research Analyst, ForexTime

As the transitory inflation narrative was bolstered by the sharp decline in US 10-year yields last week, so the low volatility has also helped stock markets hit new record highs with European bourses including the Dax following suit this morning. Falling rates obviously help interest rate-sensitive stocks which definitely means the Nasdaq has been enjoying the last few sessions.

The tech-laden index posted its fourth straight week of gains last week and futures are pointing up above the 14,000 level, with a record high in sight today. The classic growth sectors have led recent gains as investors rotate out of financials, although positive risk sentiment is buoyant today, if a little quiet, with the Vix hitting pre-pandemic levels on Friday.

EUR/USD trading above 1.21

The dollar enjoyed a short squeeze at the end of the last week and is in the middle the majors pack today. All eyes are on the FOMC meeting, new projections and press conference on Wednesday, with most analysts not expecting the taper talk dial to be moved. The Fed’s forecasts for inflation especially will need to be upgraded so it will be interesting to see how Chair Powell balances this with the recent policymaker chatter about “talking about talking about tapering”.

EUR/USD touched once-month lows Friday and neared that 1.2092 mark today, but the 50-day SMA is proving handy support so far. The 1.21 handle is also where the early June low and a Fib level of this year’s high and low move sit. If dollar bulls get any hint of the Fed reigning in bond buys, the 100-day and 200-day SMA reside above and below 1.20 which will be their first target. A more sanguine outlook by Jay Powell will see more range trading as Summer, football and other sporting events provide potentially more excitement.

Oil kicks on

Brent hit new cycle highs above $73.50 today with the reports last week that the US had lifted sanctions against a former Iranian oil official a distant memory. Sanctions are still in place with last week’s US inflation data providing support to oil and the broader commodities complex as investors turn to the asset class as an inflation hedge.

With Brent edging higher and past this year’s high at $71.28, the next target for bulls is the April 2019 spike high at $75.58. before May 2018 and July 2018 resistance around the $79/80 level. It seems like prices will need to drop below the previous breakout level around $70 for there to be any kind of bearish turnaround.

Disclaimer: The content in this article comprises personal opinions and should not be construed as containing personal and/or other investment advice and/or an offer of and/or solicitation for any transactions in financial instruments and/or a guarantee and/or prediction of future performance. ForexTime (FXTM), its affiliates, agents, directors, officers or employees do not guarantee the accuracy, validity, timeliness or completeness, of any information or data made available and assume no liability as to any loss arising from any investment based on the same.


Forex-Time-LogoArticle by ForexTime

ForexTime Ltd (FXTM) is an award winning international online forex broker regulated by CySEC 185/12 www.forextime.com

US inflation doubts continue to affect the dollar

By Admiral Markets

During the first quarter of the year the trend in the dollar index was positive, but the months of April and May saw it lose 2.11% and 1.40% respectively against the main currencies, reaching quarterly lows at $89.50, starting a lateral movement between these lows and $90.57 in the vicinity of its average of 40 sessions.

Attention in the foreign exchange market remains focused on possible measures and changes that the Federal Reserve may undertake to deal with rising inflation in the United States. This was brought about by the economic recovery and consumption growth, thanks to the advanced vaccination process, as a change in policies and an eventual rise in interest rates could boost the dollar.

At the moment, the month of June is reaching its equator with a rise of 0.51% in the dollar index.

EURUSD Analysis

If at the beginning of the month the market was watching for the unemployment data, last week, the focus was on inflation in the United States. This data was published last Thursday, and we could see that it soared to 5% year-on-year, exceeding market expectations, setting the core CPI at 3.8%.

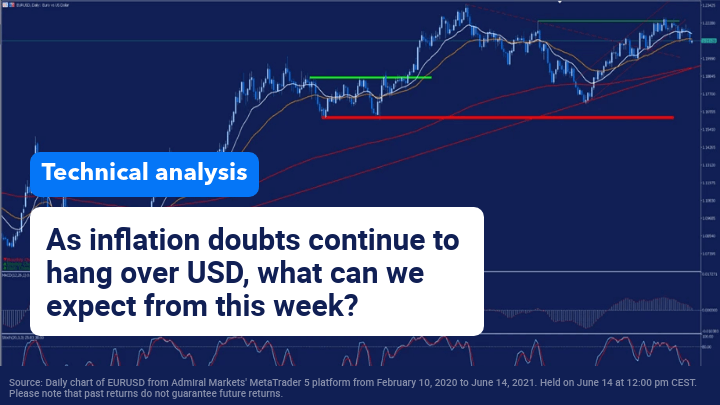
Technically speaking, if we look at the weekly chart, it seems that EURUSD has slowed at the level of 1.2240, forming a double a double ceiling (green) that has caused the price to lose in the final stretch of last week its averages of 18 and 40 sessions. Consequently, this confirms the break of the bullish channel that it has been following over the past few weeks.

Moreover, the loss of these levels can cause a further correction in search of your long-term trend line and your average of 200 sessions.

Source: Daily chart of EURUSD from Admiral Markets’ MetaTrader 5 platform from February 10, 2020 to June 14, 2021. Held on June 14 at 12:00 pm CEST. Please note that past returns do not guarantee future returns.


Evolution of the last 5 years:

  • 2020 = +8,93%
  • 2019 = -2.21%
  • 2018 = -4.47%
  • 2017 = +14.09%
  • 2016 = -3.21%


GBPUSD Analysis

In the case of GBPUSD, we can see that this pair is following a very clear upward trend since it marked lows on March 20, 2020 around the level of 1.14100 to almost reach the level of 1.42400, which has led it to exceed its long-term downtrend line (in red).

As we can see in the weekly chart, after marking highs last February, EURUSD price began a correction that led it to lose the important level of 1.40 in search of its average of 18 sessions where it has found an important point of support to start a new momentum. This has led it to exceed not only the level of 1.40 but to form a double roof in the area of annual highs (in green).

This double-ceiling formation can, in turn, cause a price correction in search of your average of 18 sessions that currently acts as your first support level. As long as the price does not lose its average of 18 the feeling will remain upward. The definitive loss of 1.40 and the average of 18 would open the door to further correction to the previous support/resistance level in the red.

Source: Weekly chart of GBPUSD on Admiral Markets’ MetaTrader 5 platform from November 23, 2014 to June 14, 2021. Held on June 14 at 12:05 pm CEST. Please note that past returns do not guarantee future returns.


Evolution of the last 5 years:

  • 2020 = +3.10%
  • 2019 = +3.95%
  • 2018 = -5.54%
  • 2017 = +9.43%
  • 2016 = -16.26%


USDJPY Analysis

Finally, if we look at USDJPY, we can see how the Japanese yen was one of the big losers from the rises in the dollar, since during the rises in February and March it went from trading at levels close to 102,700 to trading at levels close to 111,000. As we can see from the weekly chart, after facing its important support level for a long time (represented by the red band), the price definitely bounced to above the average of 200 in the red and the long-term downtrend line.

But as we have mentioned before, since April the dollar has again given ground against its competitors, so the pair retreated to its average of 18 weeks where it found a point of support to continue with the rises.

Technically speaking, we will have to be very attentive to the evolution of the quote in the coming weeks, because if the price manages to recover the level of 110,000 it could find a new upward momentum in search of the annual highs. Breaking these highs could open a bullish rally in search of the upper side channel band in green. On the contrary, if the price re-enters lower levels, we could get a greater correction.

Source: Weekly chart of USDJPY on Admiral Markets’ MetaTrader 5 platform from October 12, 2014 to June 14, 2021. Held on June 14 at 12:10 p.m. CEST. Please note that past returns do not guarantee future returns.


Evolution of the last 5 years:

  • 2020 = -4,95%
  • 2019 = -0,88%
  • 2018 = -2,76%
  • 2017 = -3,59%
  • 2016 = -2,85%


With the Admirals Trade.MT5 account, you can trade Contracts for Differences (CFDs) of EURUSD, GBPUSD, USDJPY and more than 3000 stocks! CFDs allow traders to try to profit from the bull and bear markets, as well as the use of leverage. Click on the following banner to open an account today:

Trade With MetaTrader 5

INFORMATION ABOUT ANALYTICAL MATERIALS:

The given data provides additional information regarding all analysis, estimates, prognosis, forecasts, market reviews, weekly outlooks or other similar assessments or information (hereinafter “Analysis”) published on the websites of Admiral Markets investment firms operating under the Admiral Markets trademark (hereinafter “Admiral Markets”) Before making any investment decisions please pay close attention to the following:

  1. This is a marketing communication. The content is published for informative purposes only and is in no way to be construed as investment advice or recommendation. It has not been prepared in accordance with legal requirements designed to promote the independence of investment research, and that it is not subject to any prohibition on dealing ahead of the dissemination of investment research.
  2. Any investment decision is made by each client alone whereas Admiral Markets shall not be responsible for any loss or damage arising from any such decision, whether or not based on the content.
  3. With view to protecting the interests of our clients and the objectivity of the Analysis, Admiral Markets has established relevant internal procedures for prevention and management of conflicts of interest.
  4. The Analysis is prepared by an independent analyst, Roberto Rojas (analyst), (hereinafter “Author”) based on their personal estimations.
  5. Whilst every reasonable effort is taken to ensure that all sources of the content are reliable and that all information is presented, as much as possible, in an understandable, timely, precise and complete manner, Admiral Markets does not guarantee the accuracy or completeness of any information contained within the Analysis.
  6. Any kind of past or modeled performance of financial instruments indicated within the content should not be construed as an express or implied promise, guarantee or implication by Admiral Markets for any future performance. The value of the financial instrument may both increase and decrease and the preservation of the asset value is not guaranteed.
  7. Leveraged products (including contracts for difference) are speculative in nature and may result in losses or profit. Before you start trading, please ensure that you fully understand the risks involved.

By Admiral Markets

How HIGH Can It Fly? Tilray And Cannabis ETF (MJ) Prepare To Rally 25% More To The Upside

By TheTechnicalTraders 

– Over the past few weeks, a unique opportunity continues to unfold in the Cannabis & Marijuana sector.  I highlighted this near the end of May 2021 with a research article showing how a multiple upside price wave setup may start to unfold after a recent momentum base/bottom setup across various cannabis/marijuana sector symbols.  The confluence of price patterns across a number of cannabis sector stocks suggests a bigger price trend may be about to setup.  My team and I believe this new momentum base/bottom may prompt a strong upside price trend throughout the end of 2021 and may prompt a continuation of this trend into 2022.

Sign up for my free trading newsletter so you don’t miss the next opportunity!

Today, I am revisiting these same charts/symbols to see how far things have progresses since our May 31, 2021 research post.  Let’s get started with the charts.

MJ Still Setup For A +14% Rally To Levels Near $24.50 (Or Higher)

This Weekly MJ chart shows the deep momentum base/bottom near $19.90 with moderate upside support above $20 to $21. Using a Fibonacci 100% Measured Move technique, we can identify upside targets near $22.40 and $24.50. Over the past two weeks, MJ actually reached the $22.40 target with recent highs.  Yet, price closed the week lower, near $21.59.

I am also seeing strong trading volume as this new upside price trend extends higher.  This increased volume is a good indication that the upside price trend is starting to build momentum as traders accumulate shares in anticipation of the bullish price rally phase.

My team and I still believe the upside potential in the Cannabis/Marijuana sector is relatively strong.  We believe the recent momentum base that setup across numerous Cannabis sector stocks is presenting a very clear  opportunity for traders to position trades for the pending multi-wave upside price trends.  After the first Fibonacci 100% Measured Move targets are reached, a brief pause in price should be expected, then another upside price trend should prompt an even higher price advance.  This next move will likely conform for the current rally attempt as another Fibonacci 100% Measured Move to the upside.

Tilray Inching Higher – Still Showing A Potential For A +35% Advance

Very similar to the MJ Weekly chart setup, this Weekly TLRY chart shows a fantastic momentum advance after a moderate price pullback from recent highs.  Although recent highs have touched our first Fibonacci target level, near $21.67, there is still ample opportunity for a move to the second target level near $26.70.

We are seeing strong accumulation in the recent trading volume indicated by the series of GREEN candles – suggesting the upside price trend is starting to build real momentum.  We believe the next move higher will target the $23 to $24 level – which will prompt a close above the first target level and setup TLRY on a stronger advance towards the second target level.

From the current price close, the second target level, near $26.70, represents a solid +35% opportunity for traders to profit from this initial wave higher.

GRYN Makes A Big Move – Still Showing Opportunities For Another +22% Advance

In our first research article about this unique setup in the Cannabis/Marijuana sector, we includes GRYN as a potential candidate for an explosive upside trend.  GRYN is not one of the most heavily traded symbols in this sector, yet we feel it is uniquely positioned because it has US FDA approval for its Hemp-based CBD growing and extraction processes.  This US FDA approval means GRYN can produce and sell into almost any medical, consumer, beverage, consumable or other industry as an FDA Approved supplier.

Recently, we saw a big upside in GRYN, rallying over 32% since we first published our May 31 research article.  The next move higher should target levels above $2.21 and setup a new range for the next Fibonacci 100% Measured Move higher.  If GRYN rallies to a high near $2.50 in this current trend, then the next Measured Move upside targets will be $2.79 to $3.45 if the $1.65 to $1.70 price level holds as support.  These approximate (estimated) upside targets represent another +60% to +98% rally phase for GRYN.

Overall, we believe the Cannabis/Marijuana/Alternative Medicine sector has moved away from the downside price trend that has dominated this sector over the past 2 to 3+ years.  Now, after the Reddit group targeted this sector late in 2020, we are seeing renewed focus by traders into this sector.  Once the momentum moves past moderate accumulation and into breakout trending, we may see another big explosive upside trend in a number of Cannabis sector stocks.

The one thing that could deflate this trend is if we start to see a broad US/Global market price correction. If something like a moderate 11% (or greater) US/Global market downtrend sets up, then we will likely see these Cannabis/Marijuana sector stocks attempt to move lower as well – attempting to reset/retest the recent momentum base levels.  This would present a very interesting opportunity for traders to get into positions as these base levels setup and as the accumulation starts to build again.

Want to know how our BAN strategy is ranking the Cannabis/Marijuana sector (and other sectors) for trading opportunities to identify the best opportunities for future profits? Please take a minute to learn about my BAN Trader Pro newsletter service and how it can help you identify and trade better sector setups.  My team and I have built this strategy to help us identify the strongest and best trade setups in any market sector.  Every day, we deliver these setups to our subscribers along with the BAN Trader Pro system trades.  You owe it to yourself to see how simple it is to trade 30% to 40% of the time to generate incredible results.

Have a great Monday!

Chris Vermeulen
Chief Market Strategist

TheTechnicalTraders.com

Genocide Politics: The Zenz-Xinjiang Case

By Dan Steinbock

– The Trump and Biden administrations have initiated an unsubstantiated genocide case against China. It has been opposed by White House’s own legal experts. With its dark roots, genocide politics mocks real genocides.

In July 2020, then-Secretary of State Mike Pompeo blamed the Chinese Communist Party (CCP) for “using forced sterilization, forced abortion, and coercive family planning against Uyghurs and other minorities in Xinjiang.”

In January, Pompeo, on his way out from the White House, charged China of “the systematic attempt to destroy Uyghurs in Xinjiang.” The Biden administration has adopted the same unsubstantiated allegations.

And so has international media, without slightest source criticism.

Stunningly, most based their charges mainly on just one source: a German born-again anti-Communist Christian crusader who has never been in Xinjiang.

How genocide politics trumped legal experts

According to the UN Genocide Convention (1948), genocide is defined as “acts committed with intent to destroy, in whole or in part, a national, ethnic, racial or religious group, as such.”

In contrast, what Zenz claimed was that the fall of Uyghur birth rates and birth control measures in Xinjiang province was a proof of genocide. In the process, genocide was associated with family planning and modernization (which US agencies and foundations have implemented across the world since the postwar era).

Moreover, through the 2019s, Xinjiang actually recorded a positive overall population growth rate, with the Uyghurs growing faster than the non-Uyghur population.

Furthermore, the genocide allegation was made against explicit legal opposition. Prior to Pompeo’s January statement, the State Department’s Office of the Legal Advisor had concluded that there was insufficient evidence to prove such genocide.

Yet, both administrations simply over-ruled their own legal experts.

In April, economist Jeffrey Sachs and William Schabas, a leading international legal scholar of genocide, stressed that “the Xinjiang genocide allegations are unjustified.” As they concluded, “unless the State Department can substantiate the genocide accusation, it should withdraw the charge.”

Who is the primary source of the genocide allegation?

From God to anti-China Aussies and US defense contractors   

Adrian Zenz graduated from the hyper-Christian Columbia International University, headquartered in South Carolina, where teachers can lecture only if they affirm the Second Coming of Jesus. As Wall Street Journal once put it, Zenz feels “led by God” in his struggle against the Chinese communists.

After 2016, the German crusader suddenly became a “Xinjiang expert” with a single Foreign Affairs essay. Co-author James Leibold’s Australian Strategic Policy Institute (ASPI) has been credited as the think-tank behind Australia’s rock bottom ties with China. It is funded by Australia’s Defense Department and US State Department and Pentagon’s big defense contractors.

By 2017, Zenz’s publications were released mainly by one of the flagships journals of the Jamestown Foundation, an ultra-conservative anti-Communist think-tank launched by CIA Director William J. Casey in the ‘80s.

But Zenz’s Xinjiang pieces were published by Journal of Political Risk, led by Anders Corr who has a track-record of fake predictions and who consults Pentagon agencies and defense contractors (on his 2017 fake prediction that the Philippines will default under China’s debt slavery by 2022, see my “Whatever happened to PH debt slavery?” TMT, Oct 7, 2019).

In December 2020, Zenz released his Coercive Labor in Xinjiang in which “the assertion of genocide is concocted through fraudulent statistical manipulation, cherry-picking of source material, and propagandistic misrepresentations,” as critics have put it, rightly.

The “shocking report” was published by the Newlines Institute for Strategy and Policy (NISP), with the Raoul Wallenberg Center for Human Rights (RWCHR).

NISP’s leadership features mainly US State Department officials, military and intelligence analysts who used to work for Stratfor (“Shadow CIA” as Barron’s calls it). The RWCHR positions have converged with those of US State Department and it collaborates with the anti-China cult Falun Gong and its far-right Epoch Times.

NED sponsoring Uyghur separatism 

In the US, the key role in the Zenz-fueled campaign against China belongs to the Worker Rights Consortium (WRC), whose steering committee members seem to be supported by the National Endowment for Democracy (NED). The WCR campaign has forced Uyghur workers out of their jobs, while compelling US apparel company Badger Sport to pay $300,000 to Uyghur exile separatists, not to the jobless workers.

Zenz’s report also features materials of Uyghur separatists, including the World Uyghur Congress (WUC) backed by the U.S. government. The WUC regards Xinjiang as “East Turkestan.” Dedicated to separatist objectives, it seeks to destabilize Xinjiang and ultimately regime change. It is a top-down umbrella for its Washington-based affiliates – including Uyghur American Association (UAA), Uygur Human Rights Project, and Campaign for Uyghurs – reliant on US funding.

The WUC and its affiliates have been supported with millions of dollars since 2004 by the National Endowment for Democracy (NED).  Under its president Kuzzat Altay, the UAA’s anti-China fanaticism has escalated, while the far-right gun club Altay Defense drills combatants with ex-members of U.S. special forces (Figure).

Figure A Separatist Dream Come True

Sources: Screen captures of NED tweet showing “East Turkestan” as separated from mainland China; Altay Defense (Instagram 2020)


Here’s how the pro-democracy/destabilization machine works: NED transfers monies to the WUC, which uses them for its affiliates, public PR and reportedly for not-so-peaceful covert activities, while lobbying the Congress, which in turn funds the NED.

Nazi roots of fervent anti-Communism

Alarmingly, Uyghurs’ Turkey branch has ties with the far-right pan-Turkish Gray Wolves, a designated terrorist organization, which is usually characterized as ultra-nationalist, neo-Fascist and Islamophobic. It has been linked with political violence, death squads, heroin, CIA, and drugs trade, including multiple violent attacks against Chinese targets in Europe, Turkey and Thailand.

The far-right links extend to Zenz and his prestigious new host. After his Xinjiang reports, he was recruited as a senior fellow in China studies by the Washington-based Victims of Communism Memorial Foundation (VOC), a fiercely anti-Communist successor of the National Captive Nations Committee (NCNC), linked with the Ukrainian nationalist and notorious anti-Semite Yaroslav Stetsko.

Ironically, the NCNC originates from the Anti-Bolshevik Bloc of Nations (ABN), founded in 1943, at the instigation of Alfred Rosenberg, Hitler’s chief Nazi race ideologue and Minister of the East. Nazi leaders cooperated and funded Stetsko’s organized militia OUN, which butchered thousands of Jews in pogroms in 1941.

In the mid-1950s, the ABN was linked its Asian equivalent (Asian Peoples’ Anti-Communist League) in which Taiwan’s Generalissimo Chiang Kai-shek played a central role; and the World Anti-Communist League (renamed in the ’90s as the World League for Freedom and Democracy) whose headquarters remains in Taiwan.

It is these dark origins of Zenz and his background forces that cast a long shadow over his allegations today.

Disconcerting lessons of genocide politics

The far-right motivations of these old-new Cold Warriors has potential to unleash a major conflict. Perhaps a new Cold War is their strategic objective, despite the huge costs to global economic prospects, especially to the most vulnerable nations.

The genocide allegations by the Trump and Biden administrations seem hypocritical, even bizarre in the light of US history, starting with the native American Indians, Hiroshima and Nagasaki, and extending to series of postwar atrocities in almost every major world region.

What’s highly distressing is the way the leading international media has allowed itself to be used, with little regard to public trust – as during the Cold War.

Like the “infodemic” in the early days of the COVID-19, misinformation associated with social media trolls and conspiracy theorists blur the distinction between realities and fantasies. With the pandemic, the ensuing divisions and delays cost millions of lives, and so could the erosion of media credibility amid future genocides.

The rejection of the top legal experts of the White House for a far-right ultra-religious crusader sets a frightening precedent and tarnishes American ideals.

When the word “genocide” is exploited without a solid legal basis, the very designation is politicized and diluted. That is an insult against the real victims and legacies of the Holocaust and other genocides around the world.

About the Author:

Dr Dan Steinbock is the founder of Difference Group and has served as research director at the India, China and America Institute (USA) and visiting fellow at the Shanghai Institutes for International Studies (China) and the EU Center (Singapore). For more, see https://www.differencegroup.net/   

This short commentary is based on a part of the fully-referenced 4,600+-word analysis, published by The European Financial Review on June 11, 2021. https://www.europeanfinancialreview.com/playing-genocide-politics-the-zenz-xinjiang-case/ The print version will ensue later in June.


UK ILO Unemployment: Pound Set To Decline?

By Orbex

Heading into the G7 meeting over the weekend, analysts were expecting some kind of breakthrough on the Northern Ireland issue.

The venue in the UK and the presence of the major players, plus President Biden’s public pressure on Johnson, were seen as a potential catalyst for a deal.

But, it appears that it was all talk, and the rhetoric from both sides remains largely the same after the meeting. Moreover, the UK has had a series of setbacks over the last couple of days.

And that might be weighing on sentiment on the island nation.

What’s driving the mood

While the UK was beset on the Brexit front, two other pending deals suffered through the weekend.

The Australian Prime Minister acknowledged the importance of “patience” in reaching a deal on a free trade agreement with the UK. This is particularly true as agriculture remained the largest sticking point.

Meanwhile, negotiations for a trade agreement with Canada continue slowly, with parties agreeing to “redouble” their pace.

With the issue of Northern Ireland taking center stage, there is an increased strain on the special relationship between the US and the UK, and their potential free trade agreement.

Being able to sign faster trade agreements was one of the selling points of Brexit. And the latest news hasn’t been the best on that front.

On top of that, there were rumors that the UK would delay full reopening by a month over fears of the new covid variant. The government is reported to hold a special meeting later today to make a definitive decision on that front.

What could give some optimism

While there are reasons for concern, the FTSE 100 has continued to rise, with expectations to continue in that direction.

Bad news on trade doesn’t necessarily mean bad news for stocks. In fact, it could keep the BOE in an easing stance, especially if covid restrictions are kept in place. There is a general idea that if there is a delay in reopening the economy, then it’s reasonable to expect a similar delay in the BOE’s policy “normalization”.

The expectation of lower interest rates could keep the pound under pressure. As a matter of a fact, the data that could change the outlook this week is the employment data. This is because that is the key metric that the BOE uses to see whether the economy has stabilized and can move to a less accommodative policy.

What we are looking for

We can expect the ILO Unemployment rate to tick down to 4.7% compared to 4.8% in the prior reading.

Remember, that this is a rolling 3-month average. So, we need to take into consideration that the average now includes April, and January is rolling off.

In other words, a drop of a percentage point might not so much reflect that April saw a drop in the unemployment rate, but rather that it stayed steady. And the change in the number will reflect that.

January saw an increase in hiring after the uncertainty over what would happen on the Brexit deadline was over. The pivotal figure here might be the claimant count. And there isn’t a clear consensus among the expectations.

A negative result is likely to support the pound since it means that the net number of people seeking unemployment benefits has dropped.

By Orbex

Fibonacci Retracements Analysis 14.06.2021 (GOLD, USDCHF)

Article By RoboForex.com

XAUUSD, “Gold vs US Dollar”

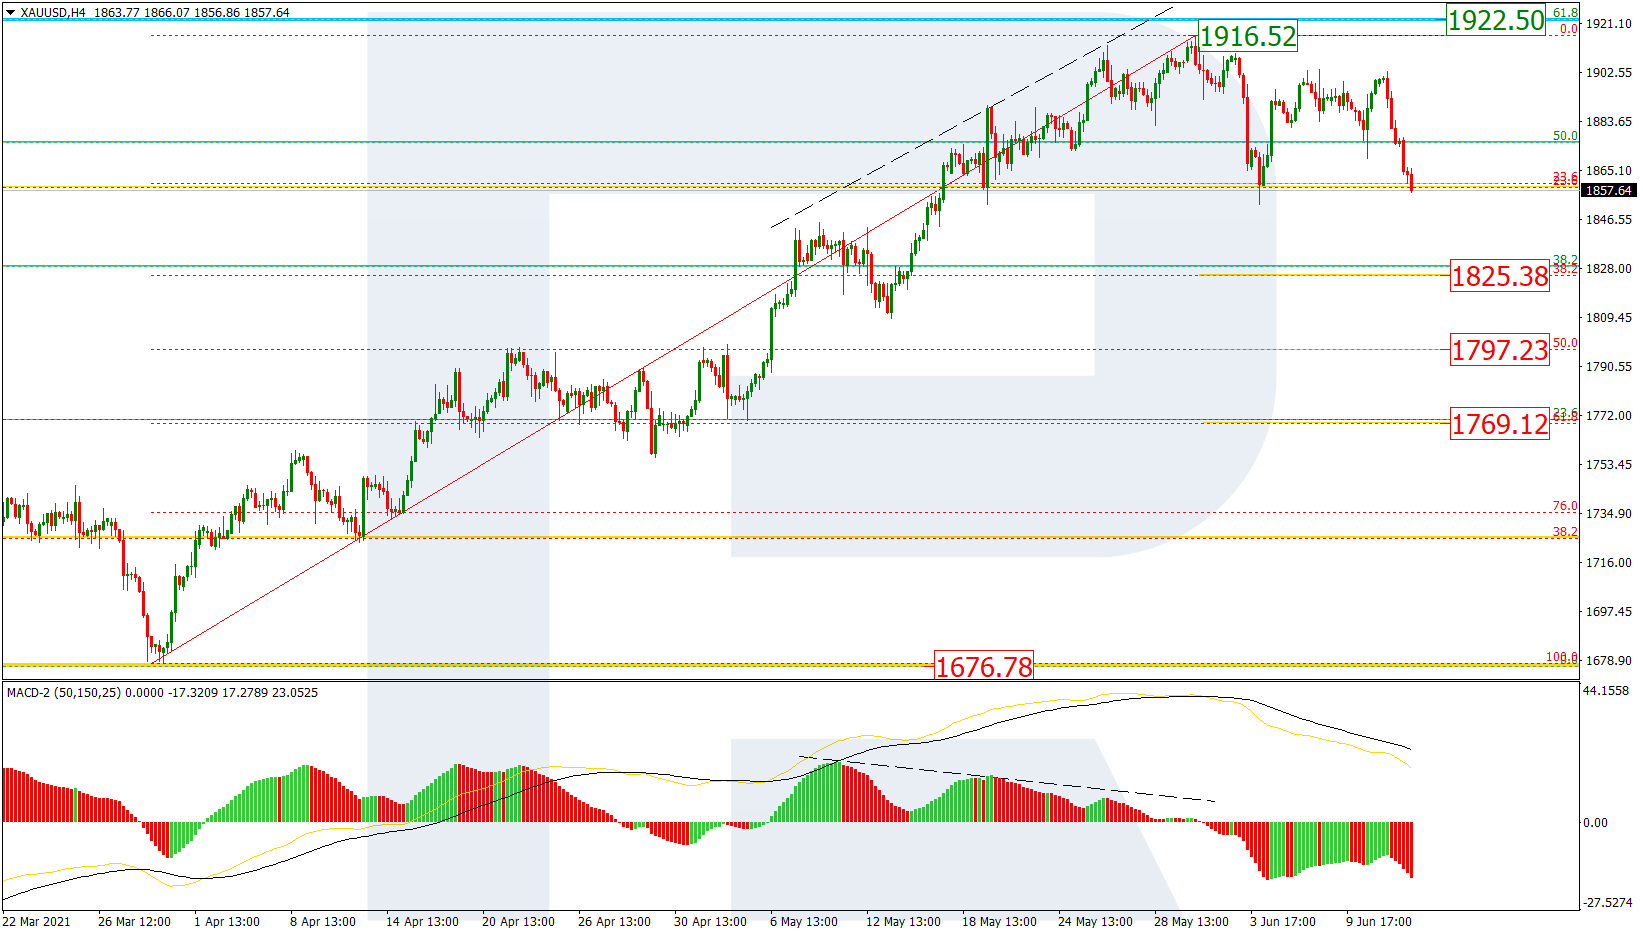
As we can see in the H4 chart, XAUUSD is forming another correctional wave to the downside after a divergence on MACD. Possibly, after completing a short-term growth, the pair may form another descending impulse. At the moment, the asset is re-testing 23.6% fibo and trying to break it. The next downside targets will be 38.2%, 50.0%, and 61.8% fibo at 1825.38, 1797.23, and 1769.12 respectively. At the same time, a breakout of the resistance at 1916.52 may lead to a further rising movement towards the mid-term target, which is 61.8% fibo at 1922.50.

GOLD_H4
Risk Warning: the result of previous trading operations do not guarantee the same results in the future

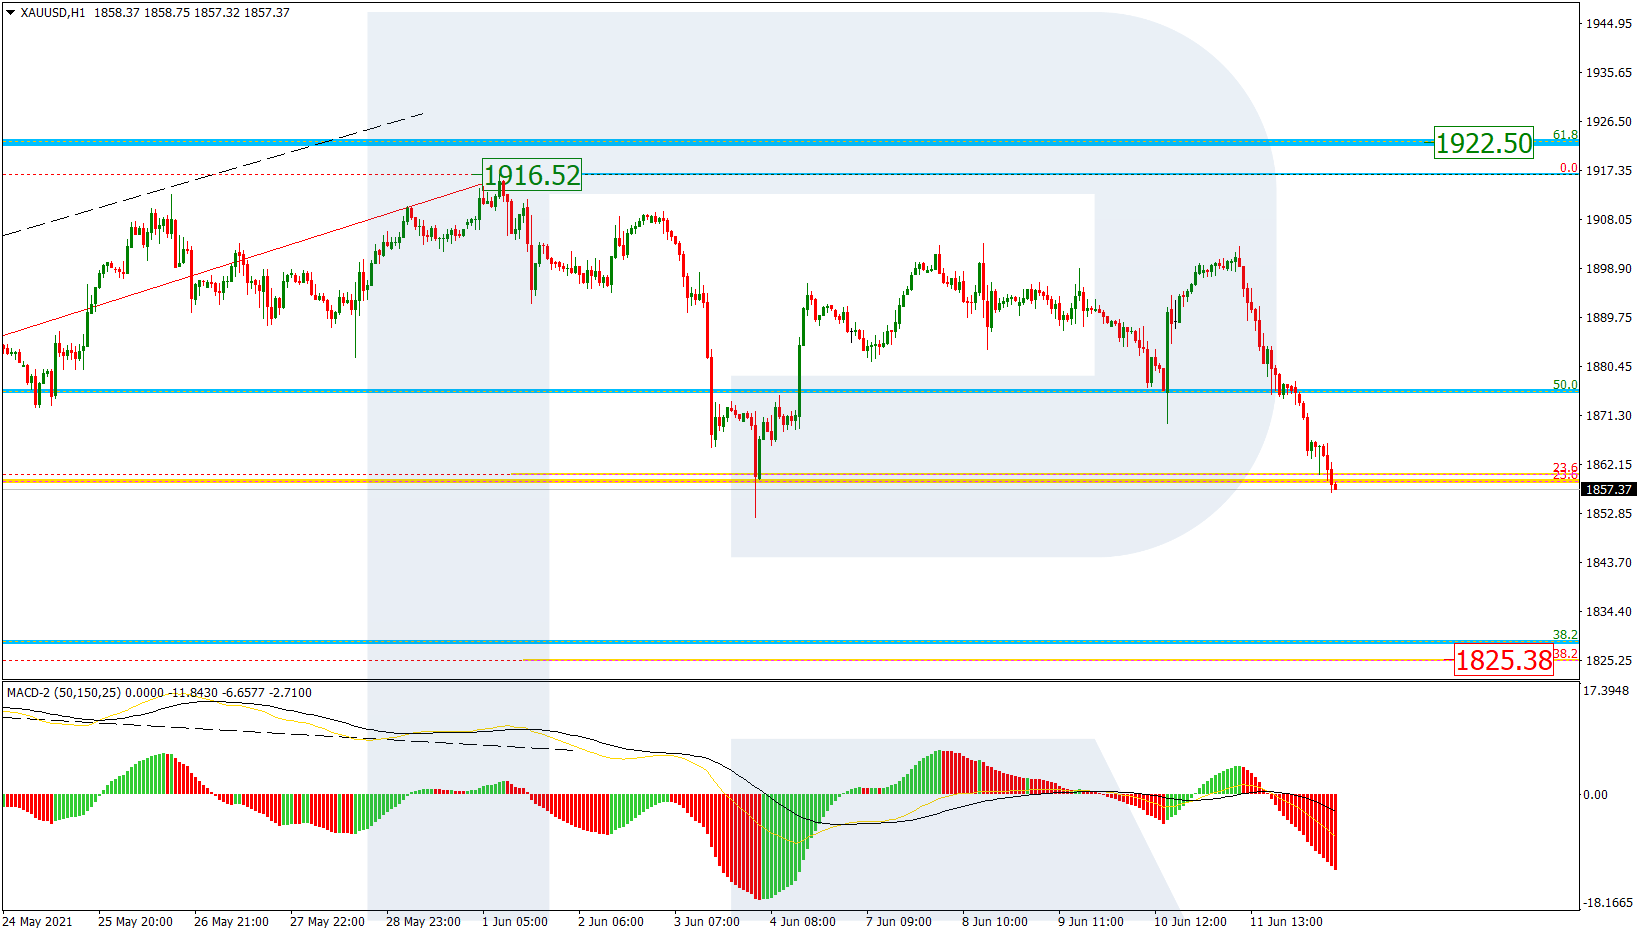
The H1 chart shows a steady descending impulse that is testing 23.6% fibo. Possibly, the price may form a short-term pullback here, which may be later followed by a further downtrend to reach 38.2% fibo at 1825.38.

GOLD_H1
Risk Warning: the result of previous trading operations do not guarantee the same results in the future

USDCHF, “US Dollar vs Swiss Franc”

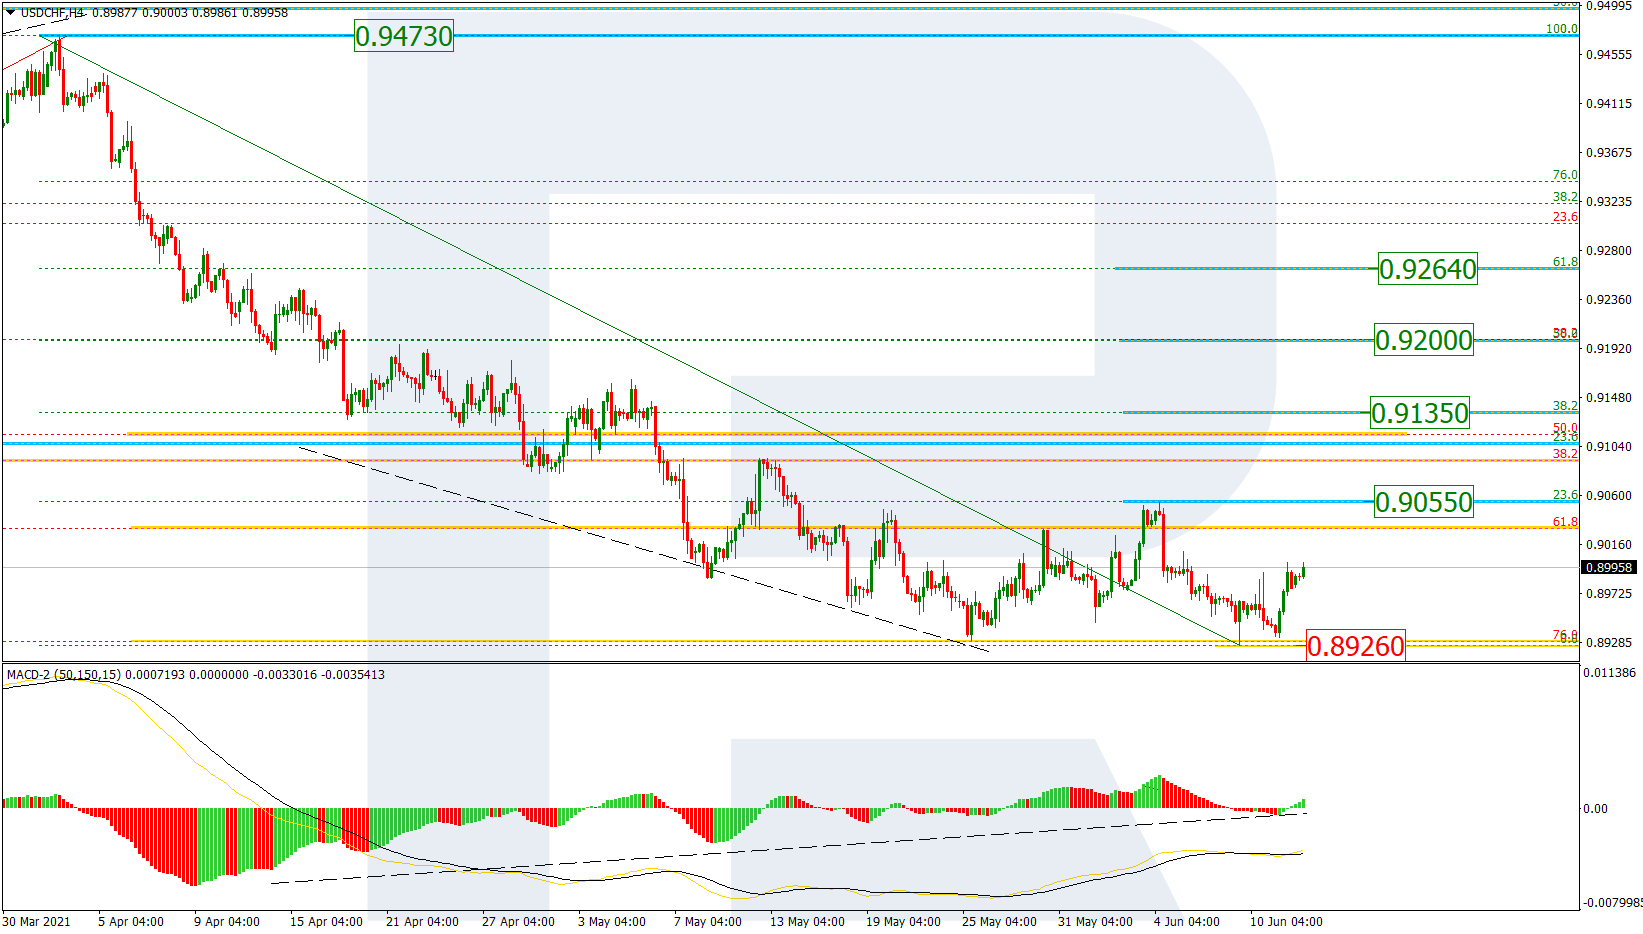
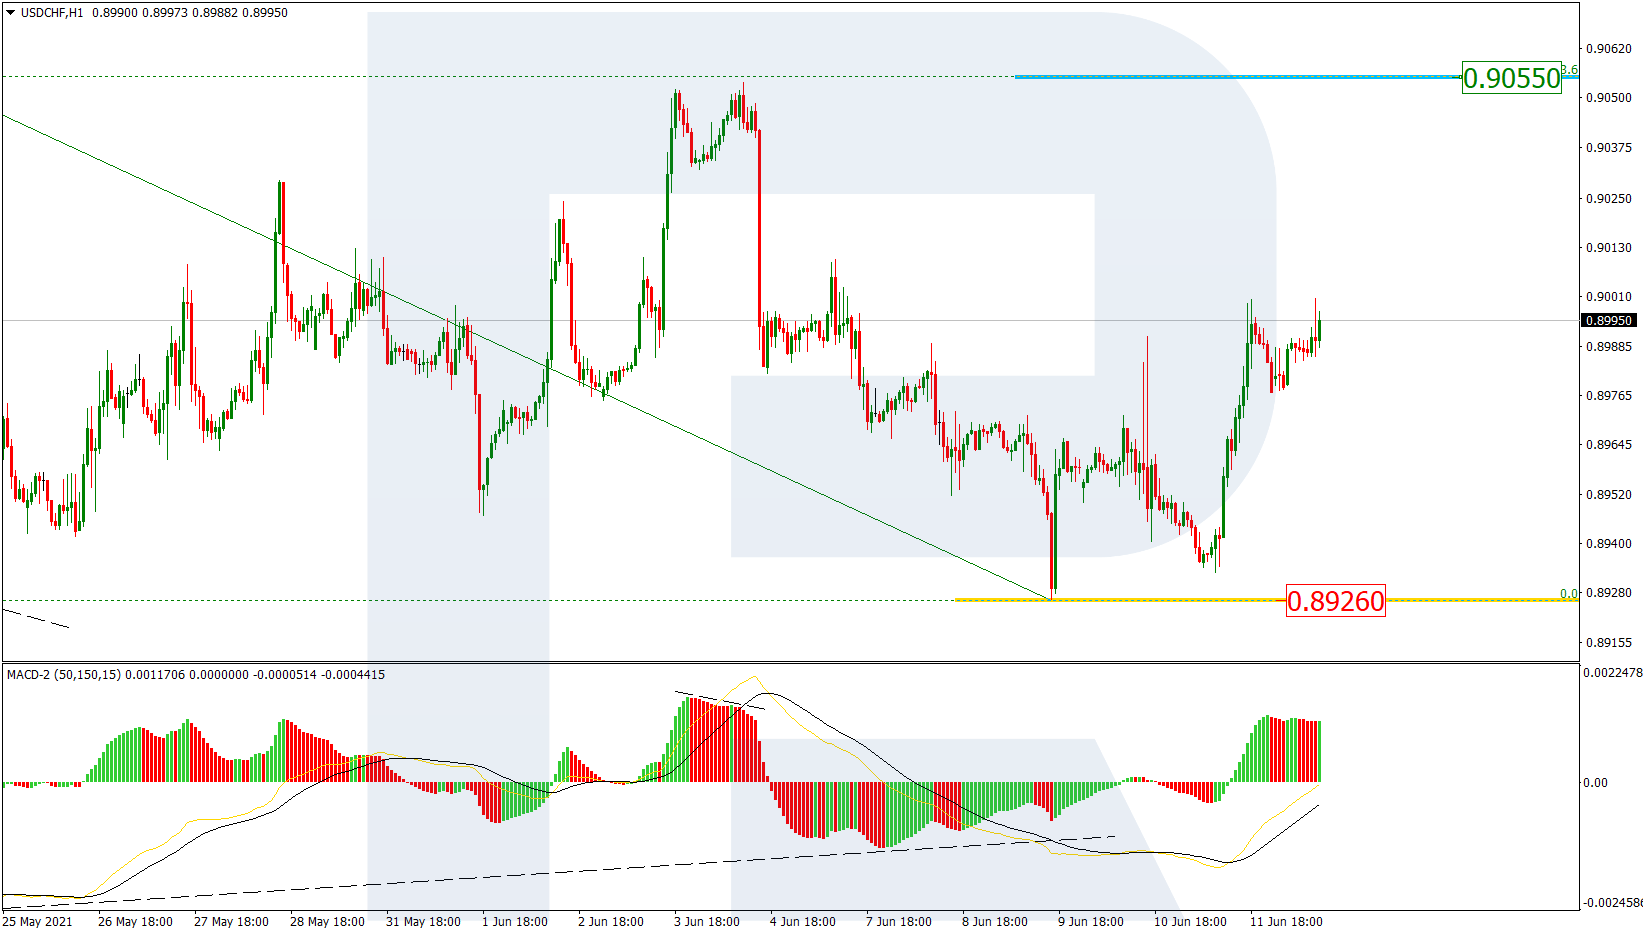
As we can see in the H4 chart, after updating its previous low and rebounding from it, USDCHF may start a new correction towards 23.6%, 38.2%, 50.0%, and 61.8% fibo at 0.9055, 0.9135, 0.9200, and 0.9264 respectively. The support is the low at 0.8926.

USDCHF_H4
Risk Warning: the result of previous trading operations do not guarantee the same results in the future

The H1 chart shows the first rising wave towards 23.6% fibo.

USDCHF_H1

Article By RoboForex.com

Attention!
Forecasts presented in this section only reflect the author’s private opinion and should not be considered as guidance for trading. RoboForex LP bears no responsibility for trading results based on trading recommendations described in these analytical reviews.

Historic change: Arab political parties are now legitimate partners in Israel’s politics and government

By Morad Elsana, American University

The next government is not going to be a typical one for the citizens of the state of Israel, and especially for members of the Palestinian Arab minority, who are 20% of Israel’s population. This is the first time the Zionist political parties forming the government are including an Arab party.

It is ironic that the prime minister of this government would be Naftali Bennett. Bennett is the leader of the radical right-wing political party Yamina, whose ideologies and interests contradict the Arab party’s interests, and which has opposed Arab participation in the coalition or government. His national-religious political movement, which represents many Jewish settlers, signed the coalition agreement with Ra’am, the Islamic Arab party.

In the 73-year history of Israel, it was an unwritten rule that any government coalition would be formed only by the Jewish Zionist parties. There was only one exception, when the late Prime Minister Yitzhak Rabin relied on the support of an Arab party in the wake of the Oslo Peace Accords in the 1990s. The agreement, however, did not formalize that party’s entry into the ruling coalition.

The chain of events Rabin triggered was considered an unforgivable sin by the Israeli right, which depicted Rabin as a traitor – as they do now with Bennett – and which ultimately led to Rabin’s assassination.

Changing Israeli politics

What drove the first Arab party into a ruling coalition now was not the desire for a peace agreement. It was the poor state of Israeli politics after four election rounds in two years without a clear winner, combined with the strong desire of the opposition, called the “Change Bloc,” to oust longtime Prime Minister Benjamin Netanyahu.

The Arabs did not forget Netanyahu’s hostile remarks during the previous elections. That’s when he urged the settlers to cast their votes against the Arabs who “are voting in droves.”

After failing in the latest election to both discourage the Arab vote and ensure a majority of his own, it was Netanyahu who first understood the potential need to cooperate with the Arab parties. After all other efforts to form a ruling coalition failed, he tried to lure Ra’am leader Mansour Abbas to his side even before Bennett did, but to no avail.

For his part, Abbas proposed to change the way Arab parties deal with the Jewish parties and politics in Israel.

“I say here clearly and frankly: When the very establishment of this government is based on our support … we will be able to influence it and accomplish great things for our Arab society,” Abbas said.

For decades, Palestinian Arab political parties would not join Israeli governments that continued to support the occupation of their Palestinian brothers, oppressed them and denied their basic rights. And they were kept out of leadership coalitions by the Jewish parties’ fear of cooperating with them.

Abbas’ call for pragmatism means that he will support political coalitions committed to meeting the immediate and urgent demands of the Arab minority in Israel. Chief among those demands is addressing the issues of violence, house demolitions, planning in new Arab villages and towns, education and equality.

Significant promises made

Abbas’ approach was rejected by the rest of the Palestinian political parties, and thus split up the Joint List, which was a political alliance of four of the Arab political parties in Israel: Balad, Hadash, Ta’al and Ra’am, that they had formed for the previous elections.

The February 2021 election results meant Ra’am entered Israel’s parliament, the Knesset, with four members. Those four can prove decisive in this politically fractured situation.

For now, it appears that Abbas achieved what he wanted. Despite the serious disagreement among the Arabs over his approach, he is convinced that his party’s governing responsibilities will change the face of Israeli politics in all matters related to the Arab minority and will show positive results for the rights and status of Arab citizens in Israel.

“We have reached a critical mass of agreements in various fields that serves the interest of Arab society and that provide solutions for the burning issues in Arab society – planning, the housing crisis, and of course, fighting violence and organized crime,” Abbas said.

To help the Arab sector, among the promises he got from his new partners in the incoming government are the adoption of a five-year economic development plan for the Arab community with a budget of 30 billion shekels, or $US9.3 billion, as well as plans to combat crime and violence in the Arab community, to improve infrastructure, to advance Arab local authorities, and to reconsider the Kaminitz Law, which has led to increased demolitions of, and evictions from, Palestinian property.

The agreement also includes recognition of several Bedouin villages in the Negev, the southern district of Israel where a majority of the country’s Bedouins live.

Historic achievement

Many in the Arab community, and especially among the Bedouins, see Abbas emerging from this election as a victorious leader. He has recorded for himself and the Islamic movement several historical achievements on many important levels.

On the material level, he has secured programs, budgets and decisions that support needs of the Arab minority.

But the most important achievement is the fundamental change signaled by the acceptance of Arab parties into Israeli politics and the recognition of Arab political parties as legitimate partners in the politics and power-sharing in Israel.

This is a paramount goal the Arab parties have failed to achieve since the establishment of the state of Israel in 1948. After two years with four elections, it’s not certain that this government will last either, but, regardless of what happens, this is a historic change.

About the Author:

Morad Elsana, Adjunct Professorial Lecturer Critical Race, Gender, and Culture Studies (CRGC)., American University

This article is republished from The Conversation under a Creative Commons license. Read the original article.

Ichimoku Cloud Analysis 14.06.2021 (EURUSD, NZDUSD, USDCAD)

Article By RoboForex.com

EURUSD, “Euro vs US Dollar”

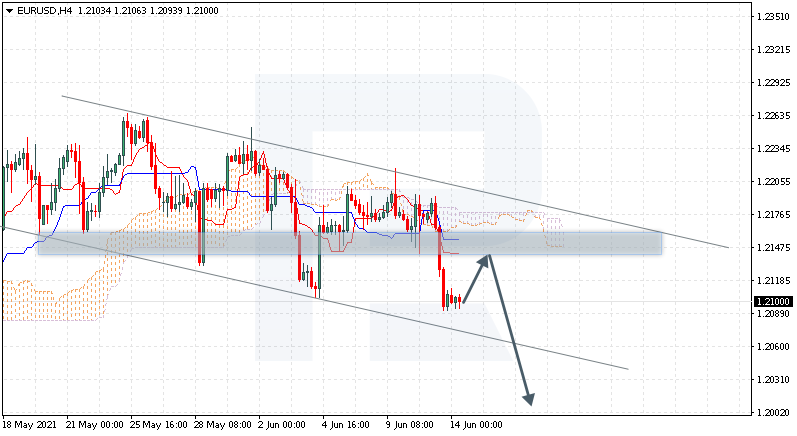
EURUSD is trading at 1.2100; the instrument is moving below Ichimoku Cloud, thus indicating a descending tendency. The markets could indicate that the price may test Tenkan-Sen and Kijun-Sen at 1.2135 and then resume moving downwards to reach 1.2005. Another signal in favor of a further downtrend will be a rebound from the resistance level. However, the bearish scenario may be canceled if the price breaks the cloud’s upside border and fixes above 1.2215. In this case, the pair may continue growing towards 1.2305. To confirm further decline, the asset must break the bearish channel’s downside border and fix below 1.2050.

EURUSD
Risk Warning: the result of previous trading operations do not guarantee the same results in the future

NZDUSD, “New Zealand Dollar vs US Dollar”

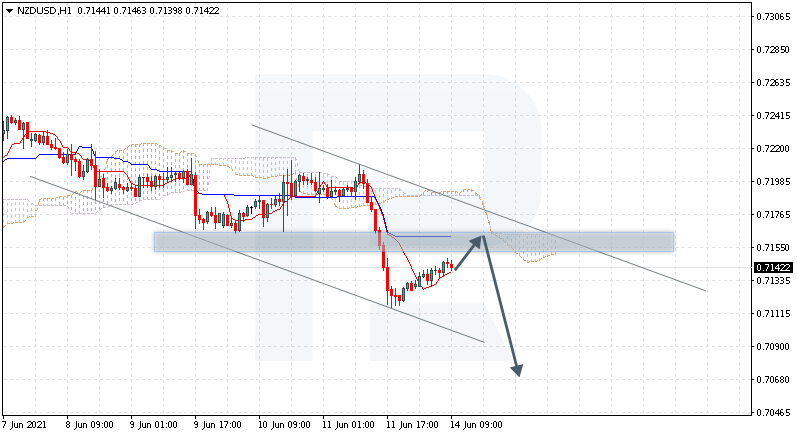
NZDUSD is trading at 0.7142; the instrument is moving below Ichimoku Cloud, thus indicating a descending tendency. The markets could indicate that the price may test the cloud’s downside border at 0.7160 and then resume moving downwards to reach 0.7070. Another signal in favor of a further downtrend will be a rebound from the descending channel’s upside border. However, the bearish scenario may be canceled if the price breaks the cloud’s upside border and fixes above 0.7195. In this case, the pair may continue growing towards 0.7305.

NZDUSD
Risk Warning: the result of previous trading operations do not guarantee the same results in the future

USDCAD, “US Dollar vs Canadian Dollar”

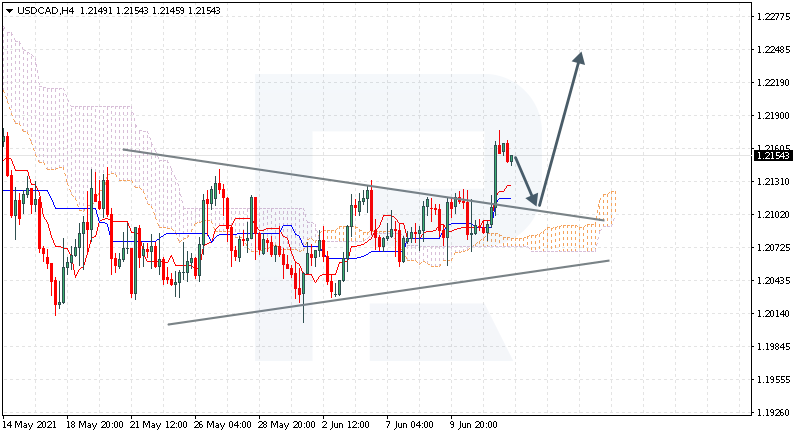
USDCAD is trading at 1.2154; the instrument is moving above Ichimoku Cloud, thus indicating an ascending tendency. The markets could indicate that the price may test Tenkan-Sen and Kijun-Sen at 1.2105 and then resume moving upwards to reach 1.2250. Another signal in favor of a further uptrend will be a rebound from the upside border of the Triangle pattern. However, the bullish scenario may no longer be valid if the price breaks the cloud’s downside border and fixes below 1.2035. In this case, the pair may continue falling towards 1.1945.

USDCAD

Article By RoboForex.com

Attention!
Forecasts presented in this section only reflect the author’s private opinion and should not be considered as guidance for trading. RoboForex LP bears no responsibility for trading results based on trading recommendations described in these analytical reviews.