Uruguay’s central bank raised its key interest rate to ensure inflation expectations are in line with its target range and said future changes in the monetary policy stance would depend on how inflation expectations react to this change move along with the country’s economy and the population’s health.
The Central Bank of Uruguay raised its monetary policy rate by 50 basis points to 5.0 percent, the first change in its rate since September last year when it adopted a policy rate and abandoned targeting money supply to control inflation that has plagued the country for decades.
Uruguay becomes the 22nd central bank that has raised its key interest rates this year in response to growing inflationary pressures and the fourth central bank in Latin America after Brazil, Chile and Mexico.
The rate hike follows months of warnings by the central bank about the need to raise rates to control inflation once the economy begins to recover from the COVID-19 pandemic, which led to a 5.9 percent contraction in the country’s gross domestic product last year.
At its previous meeting on July 6, for example, the bank’s monetary policy committee (Copom) said it was still waiting for more signs on a recovery of economic activity but once this starts, interest rates will be raised gradually to affect inflation expectations.
Today, Copom said the health situation in Uruguay had improved “substantially,” and economic activity is showing signs of recovery, with progress in various sectors and unemployment is falling.
“Within this framework, the Committee understands it is necessary for monetary policy to begin to leave its most expansive phase in order to follow a gradual path of adjustment of the interest rate and, therefore, to increase the monetary policy rate to 5%,” the central bank said.
As long as there are no setbacks in the health situation, the priority of monetary policy will be to drive inflation expectations to the center of the target range of 3.0 to 6.0 percent, the bank added.
Inflation in Uruguay has been declining steadily in recent months to 7.3 percent in June and July from over 9 percent in February but remains above the central bank’s target range.
In its second quarter monetary policy report from last month, the central bank forecast inflation would average over 7 percent this year due to higher fuel costs and commodities but then return to its target in the second quarter of 2022.
After last year’s economic contraction, the central bank expects the economy to expand 3.5 percent on average the year, with growth slowing somewhat in 2022.
In the first quarter of this year Uruguay’s GDP shrank 2.8 percent year-on-year, the sixth consecutive quarter of contraction on an annual basis.
Hundreds of scientists from around the world just released a new report assessing the state of the global climate. It’s a big deal. The report is used by governments and industries everywhere to understand the threats ahead.
So who are these scientists, and what goes into this important assessment?
Get ready for some acronyms. We’re going to take a closer look at how the IPCC report is made and some of the terms you’re hearing with the report’s release on Aug. 9, 2021.
What is the IPCC?
IPCC stands for Intergovernmental Panel on Climate Change. It’s the United Nations’ climate-science-focused organization. It’s been around since 1988, and it has 195 member countries.
Every seven years or so, the IPCC releases a report – essentially a “state of the climate” – summarizing the most up-to-date, peer-reviewed research on the science of climate change, its effects and ways to adapt to and mitigate it.
The purpose of these reports is to provide everyone, particularly governing bodies, with the information they need to make important decisions regarding climate change. The IPCC essentially provides governments with a CliffsNotes version of thousands of papers published regarding the science, risks, and social and economic components of climate change.
There are two important things to understand:
The IPCC reports are nonpartisan. Every IPCC country can nominate scientists to participate in the report-writing process, and there is an intense and transparent review process.
The IPCC doesn’t tell governments what to do. Its goal is to provide the latest knowledge on climate change, its future risks and options for reducing the rate of warming.
Not only has computer speed and climate modeling greatly improved, but each year scientists understand more and more about Earth’s climate system and the ways specific regions and people around the globe are changing and vulnerable to climate change.
Where does the research come from?
The IPCC doesn’t conduct its own climate-science research. Instead, it summarizes everyone else’s. Think: ridiculously impressive research paper.
The upcoming report was authored by 234 scientists nominated by IPCC member governments around the world. These scientists are leading Earth and climate science experts.
This report – the first of four that make up the IPCC’s Sixth Assessment Report – looks at the physical science behind climate change and its impacts. It alone will contain over 14,000 citations to existing research. The scientists looked at all of the climate-science-related research published through Jan. 31, 2021.
These scientists, who are not compensated for their time and effort, volunteered to read those 14,000-plus papers so you don’t have to. Instead, you can read their shorter chapters on the scientific consensus on topics like extreme weather or regional changes in sea-level rise.
The IPCC is also transparent about its review process, and that process is extensive. Drafts of the report are shared with other scientists, as well as with governments, for comments. Before publication, the 234 authors will have had to address over 75,000 comments on their work.
Government input to these bigger reports, like the one being released on Aug. 9, 2021, is solely limited to commenting on report drafts. However, governments do have a much stronger say in the shorter summary for policymakers that accompanies these reports, as they have to agree by consensus and typically get into detailed negotiations on the wording.
RCPs, SSPs – what does it all mean?
One thing just about everyone wants to understand is what the future might look like as the climate changes.
To get a glimpse of that future, scientists run experiments using computer models that simulate Earth’s climate. With these models, scientists can ask: If the globe heats up by a specific amount, what might happen in terms of sea-level rise, droughts and the ice sheets? What if the globe heats up by less than that – or more? What are the outcomes then?
The IPCC uses a set of scenarios to try to understand what the future might look like. This is where some of those acronyms come in.
All climate models work a little differently and create different results. But if 20 different climate models are run using the same assumptions about the amount of warming and produce similar results, people can be fairly confident in the results.
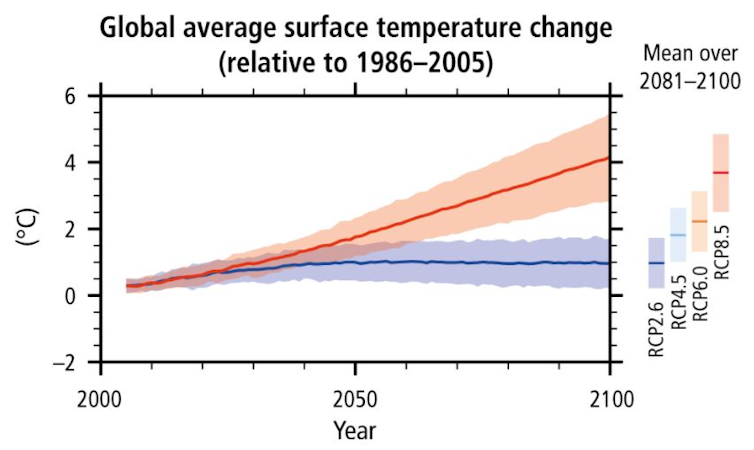
Four RCPs were the focus of the future-looking climate modeling studies incorporated into the 2013 report. They ranged from RCP 2.6, where there is a drastic reduction in global fossil fuel emissions and the world only heats up a little, to RCP 8.5, a world in which fossil fuel emissions are unfettered and the world heats up a lot.
The IPCC’s Fifth Climate Assessment, in 2013, focused on representative concentration pathways, or RCPs. IPCC
This time around, climate modelers are using SSPs. Unlike the RCPs, which focus solely on greenhouse gas emissions trajectories, the SSPs consider socioeconomic factors and are concerned with how difficult it will be to adapt to or mitigate climate change, which in turn affects greenhouse gas emissions. The five SSPs differ in what the world might look like in terms of global demographics, equity, education, access to health, consumption, diet, fossil fuel use and geopolitics.
Why should you care?
Look around. Thus far, 2021 has brought deadly extreme weather events around the globe, from extensive wildfires to extreme heat, excessive rainfall and flash flooding. Events like these become more common in a warming world.
Don’t expect an optimistic picture to emerge from the IPCC report. Climate change is a threat-multiplier that compounds other global, national and regional environmental and social issues.
So, read the report and recognize the major sources of greenhouse gases that are driving climate change. Individuals can take steps to reduce their emissions, including driving less, using energy-efficient lightbulbs and rethinking their food choices. But also understand that 20 fossil fuel companies are responsible for about one-third of all greenhouse gas emissions. That requires governments taking action now.
This article was updated Aug. 9, 2021, with the report release.
On Monday, many traders came to their desks to find an unwelcome surprise.
Commodity prices had dropped precipitously. Gold, in particular, was remarkably lower. As investors searched for an explanation, stocks fell.
Of course, the markets eventually regained their footing, and things normalized later in the day. But it was a stark reminder that there are still underlying issues in the market.
Analysts advanced several technical theories to explain the move, but all of them fit into a general theme: reflation trading.
Are we heading for a correction?
The S&P 500 has hit a new record high 64 times so far since the pandemic crash.
But then the logic of “what goes up must come down” starts to apply. And there is increasing chatter that a correction might be in the works.
The latest warning came from the co-heads of Stiefel Bank. Specifically, they stated that US stocks could face a 10% correction in the second half of the year.
Currently, easy money from central banks around the world largely fueled the record run-up in stocks after the pandemic crash. Not only has leverage for trading become easier, but a lot of people had the extra cash and extra time to try their hands at the market.
As the market normalizes though, the expectation is that some of the key factors pushing stocks up might be about to fade out.
The data came out after the Asian close, so the Far East did not have time to react to them before the weekend. Then there was less liquidity in the markets because of holidays, so there was a much stronger reaction.
The improved employment data suggested that the Fed might be closer to starting its taper than expected. This strengthened the dollar and generally kept commodity prices under pressure.
But in the context of uncertainty for the third quarter because of the delta variant, there might be something of a “perfect storm” of “temporary” negative data.
It’s not just one thing
Economists expect inflation to slow by the end of the year. However, inflation is still high right now and will likely remain high for the rest of the quarter.
At the same time, they anticipate the Fed to announce either later this month or at their September meeting that they will begin tapering in the future. Bond yields may rise in response, pushing the dollar higher and weighing on the stock market.
While the uncertainty would ordinarily help gold, a correction in the stock market is actually a good opportunity for people to invest. Especially if they are looking for value stocks to offset the expectation of inflation while the economy continues to grow.
Last year’s uncertainty about the pandemic drove gold up, and since the vaccines’ announcement, it has been trending downwards.
The flash crash suggests that there are still people holding on to gold, waiting for the right moment to move into more volatile assets.
That implies that gold still has more room to fall and there is pent-up demand to push stocks if there is a correction in the next couple of months.
Precious Metals – in particular Gold and Silver – have recently hit their respective Fibonacci 100% measured moves to the downside. At the same time, both also reached critical support levels where they may remain close to for a while.
Host Craig Hemke of Sprott Precious Metals Projections sits down with Chris Vermeulen of The Technical Traders to break down all the charts you need to prepare for the month ahead.
In this edition of the Precious Metals Projections, you’ll hear:
Predictions for the USD, Precious Metals, and US Stock Market.
What the flash crash of Gold and Silver earlier this week may mean.
Is there any validity to the cup-and-handle chart pattern?
An introduction to an online entrepreneurship program to help kids get an URLYstart on business.
TO VIEW CHRIS’S FULL THOUGHTS ON THIS MONTH’S CHARTS, CLICK BELOW TO WATCH THE INTERVIEW
GET YOUR VIDEO MARKET UPDATE AND HOTLIST OF THE BEST ASSETS TO TRADE DELIVERED TO YOUR INBOX EVERY MORNING WITH BAN TRADER PRO!
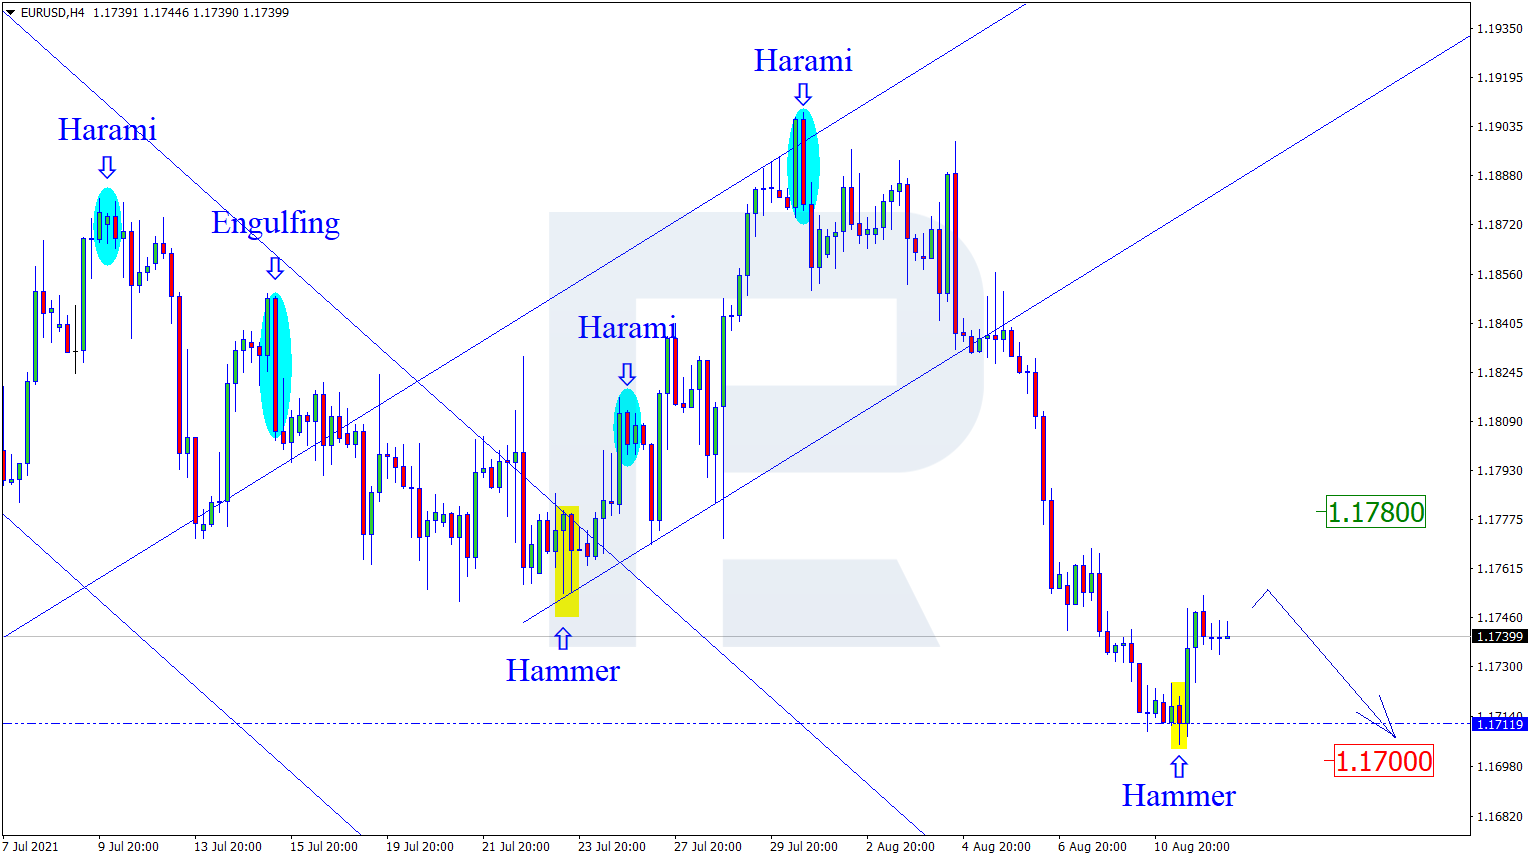
On H4, at the support level, the pair has formed several reversal patterns, including a Hammer and an Inverted Hammer. Going by the patterns, the price might start growing with the aim of 1.1780. After a bounce off the resistance level, the quotations might continue declining. However, the quotations might continue falling to 1.1700 without pulling back to the resistance level.
USDJPY, “US Dollar vs Japanese Yen”
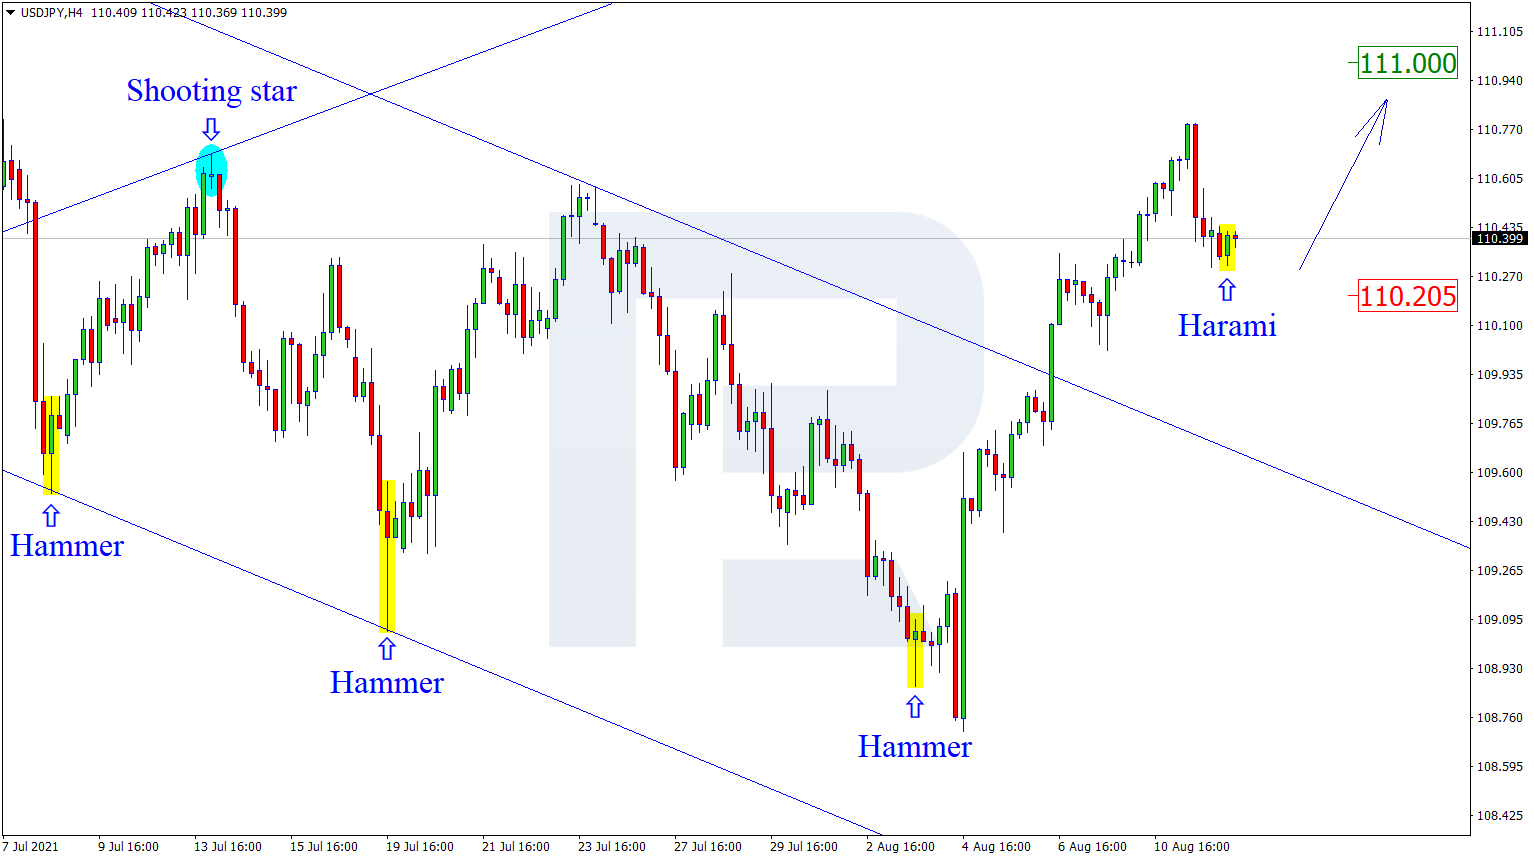
On H4, pulling back at the support level, the pair has formed several reversal patterns, including a Harami. Going by the patterns, the pair may keep on developing an uptrend. The aim of growth is 111.00. However, the pair may equally go on correcting to 110.20, skipping the signals altogether.
EURGBP, “Euro vs Great Britain Pound”
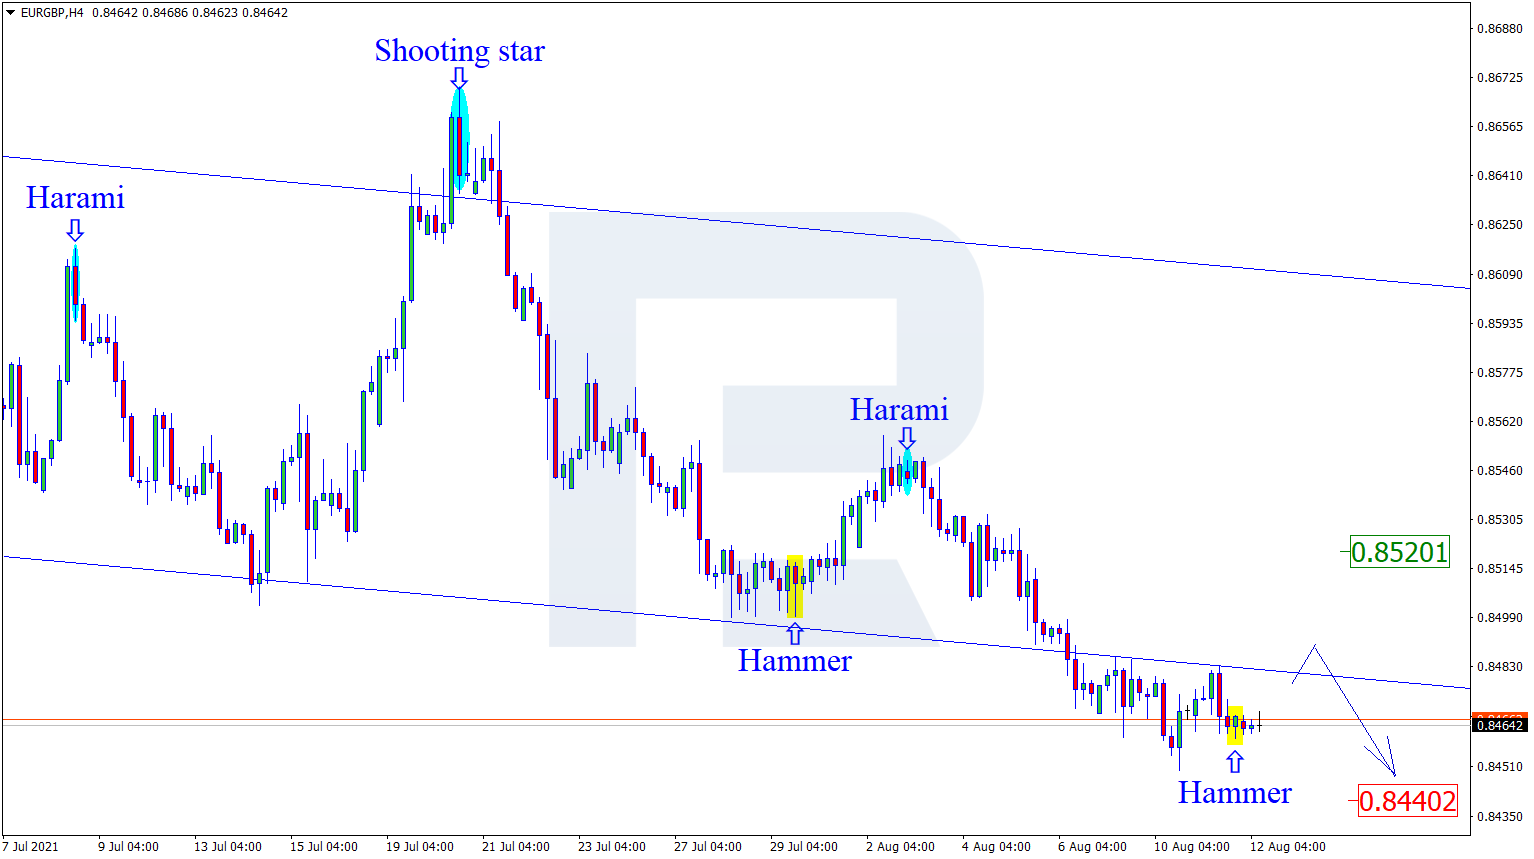
On H4, at the support level, the pair has formed several reversal patterns, including a Dodji and a Hammer. Going by the signal right now might end up in a correctional impulse. The aim of the pullback is 0.8520. Testing the resistance level and bouncing off it, the quotations might return to the downtrend. However, the price may just go down to 0.8440 skipping the patterns.
Attention! Forecasts presented in this section only reflect the author’s private opinion and should not be considered as guidance for trading. RoboForex LP bears no responsibility for trading results based on trading recommendations described in these analytical reviews.
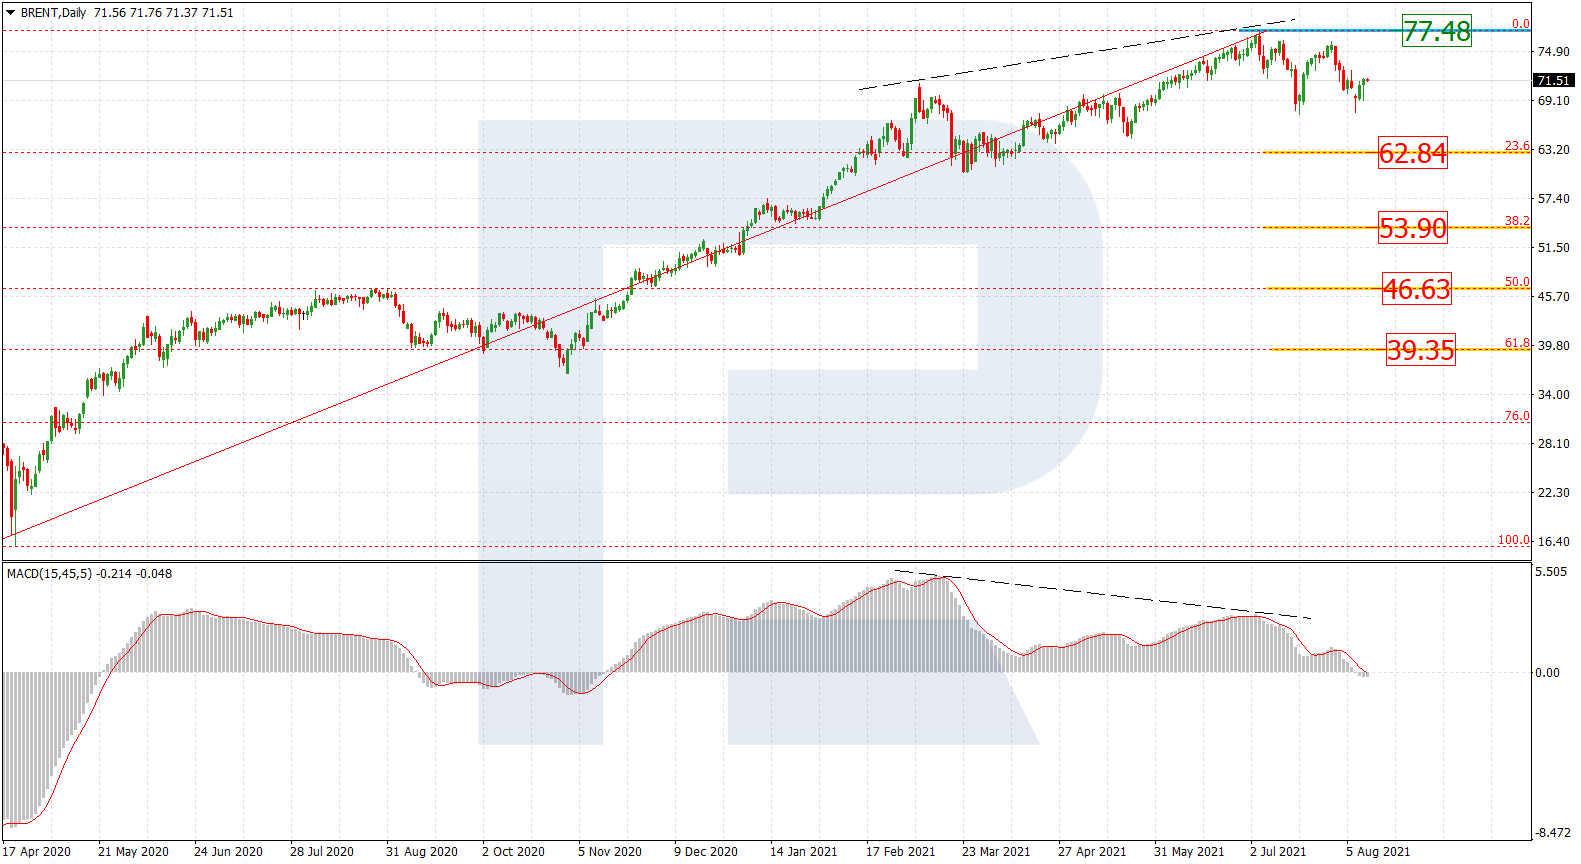
On D1, the market has tried to develop a downtrend twice after a divergence, yet every such movement turns into a flat. If the market does overcome the support level at the last fractal lows, the bearish dynamics will head for 23.6% (62.84), 38.2% (53.90), 50.0% (57.00), and 61.8% (39.35) Fibo. The resistance level is still the high of 77.47.
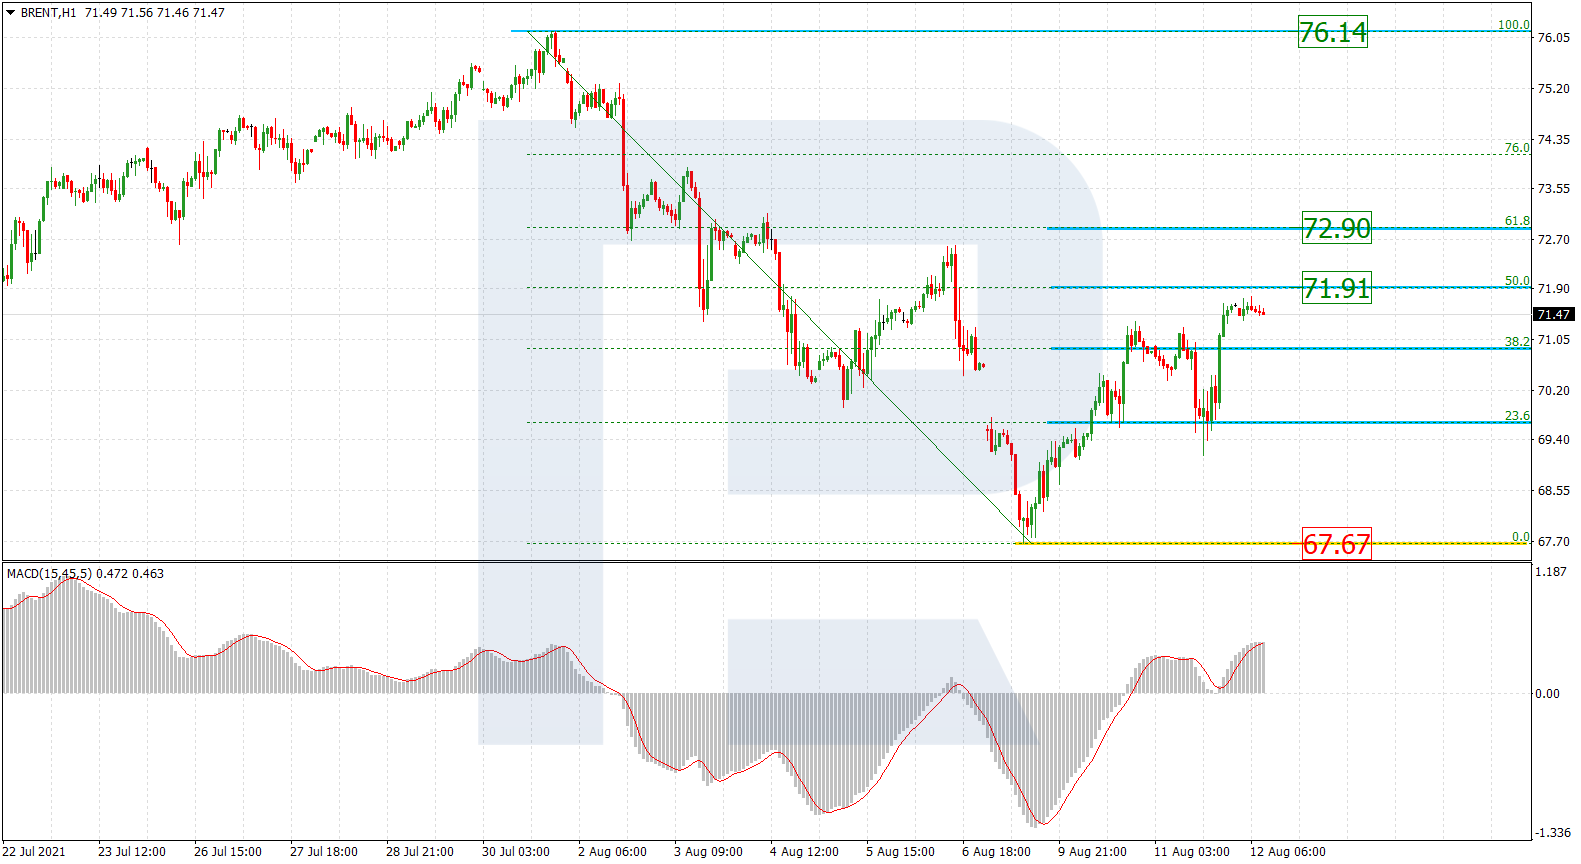
On H1, there is a correctional increase after a downtrend. The quotations are nearing 50.0% (71.91), and upon breaking through this level, they might even grow to 61.8% (72.90) Fibo. After this level is tested, we may expect another wave of decline to the current low of 67.67. If the quotations come over the current resistance level of 76.14, this will mean the long-term uptrend will continue.
Индекс Dow Jones
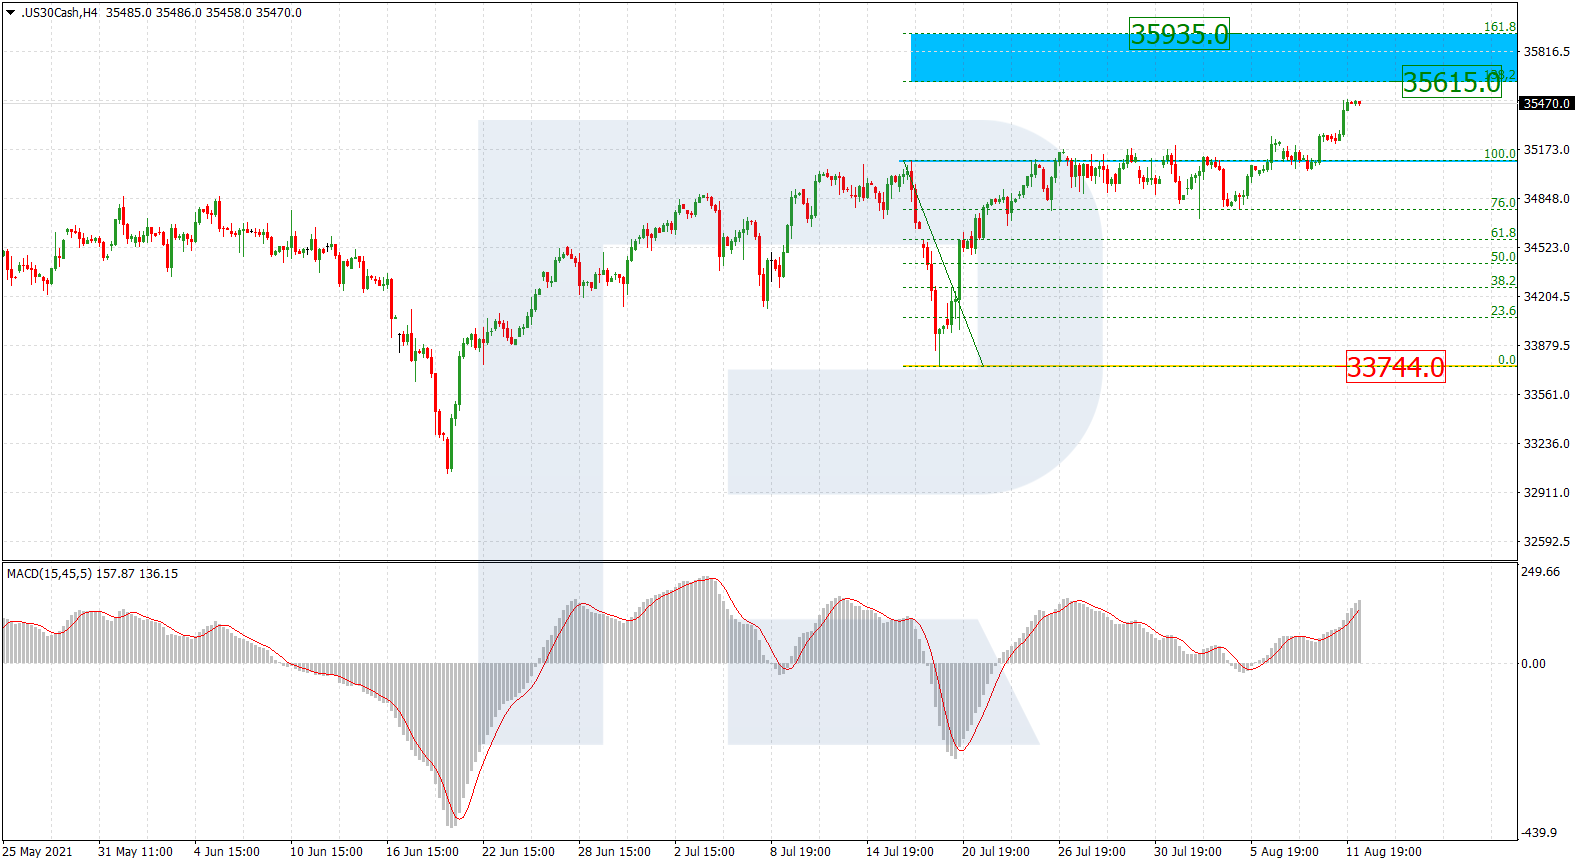
On H4, there is another impulse of growth developing after lengthy tests of the last high. This growth is aimed at the post-correctional extension area of 138.2-161.8% (35615.0-35935.0) Fibo. The support level is the low of 33744.0.
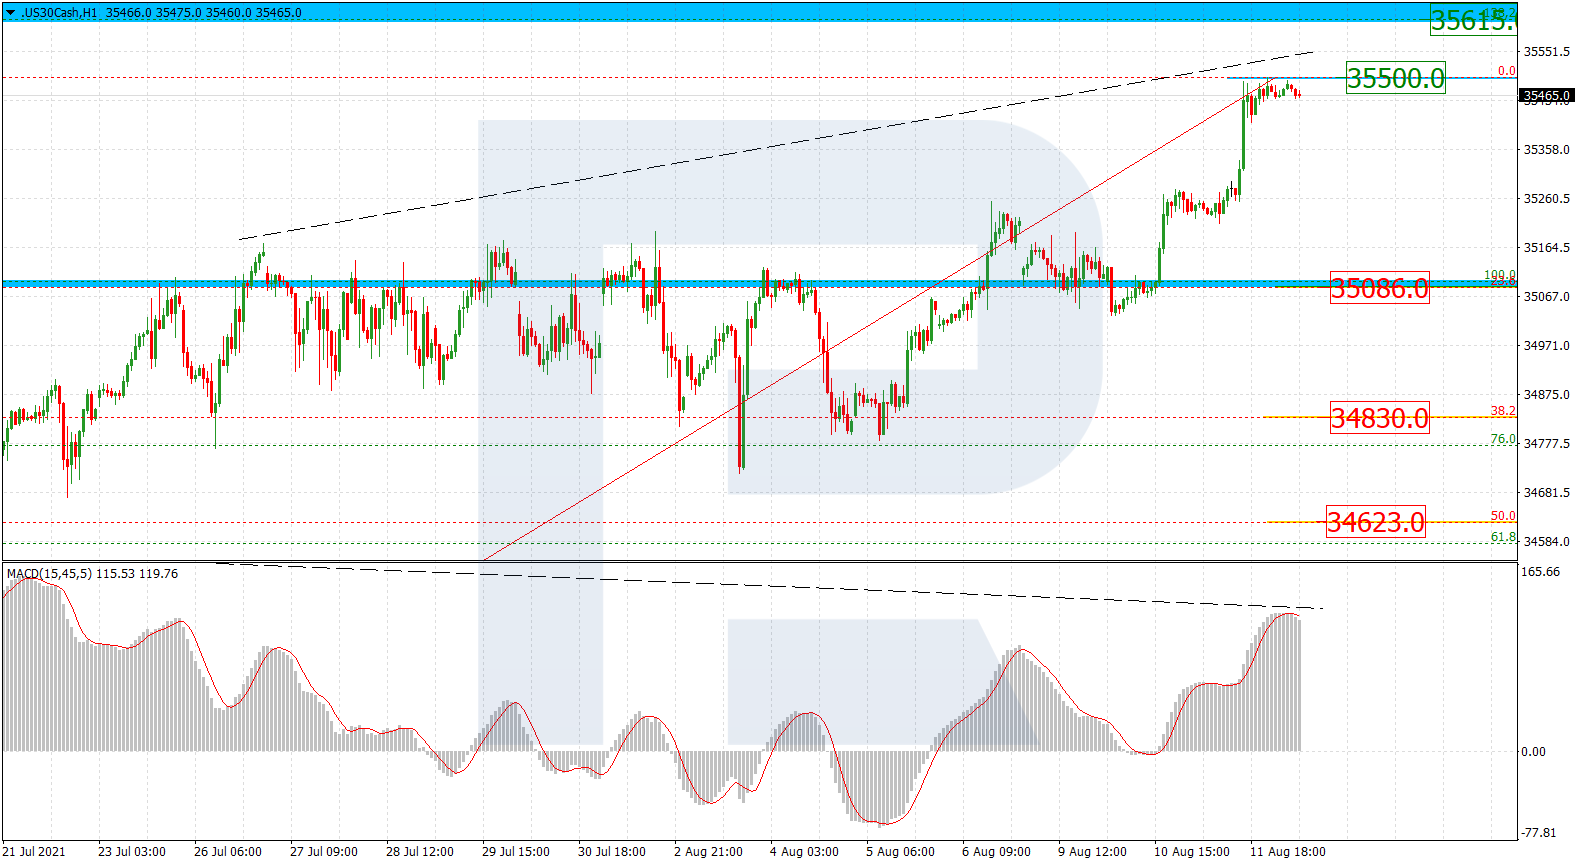
On H1, the quotations have reached the psychologically important resistance level of 35500.0 and might start pulling back after a divergence. The aims of the correction might be 23.6% (35086.0), 38.2% (34830.0), and 50.0% (34623.0) Fibo.
Attention! Forecasts presented in this section only reflect the author’s private opinion and should not be considered as guidance for trading. RoboForex LP bears no responsibility for trading results based on trading recommendations described in these analytical reviews.
SPX500 seems to be forming a large bullish impulse, which consists of primary sub-waves.
The primary wave ③ is currently under development, which is an impulse with intermediate sub-waves (1)-(2)-(3)-(4)-(5).
In the near future, the price could fall slightly in the minor wave 4, then the bulls can send the market to 4620.94. At that level, intermediate wave (5) will be at 123.6% of wave (3).
An alternative scenario suggests that the construction of the impulse wave ③ has already come to an end. Thus, in the short term, the market may begin to fall within the primary correction ④.
Therefore, in the near future, we could expect the formation of a bearish zigzag of the intermediate degree to the 3445.02 area.
At that level, primary wave ④ will be at 38.2% of impulse wave ③.
During the news release about the dollar index decline, the European currency, which has an inverse correlation with the US dollar, increased by 0.17% yesterday. But European inflation data is still weak. Germany annual inflation rate increased from 2.3% to 3.8% in July, which is in line with economists’ forecasts, but inflation is still rising.
From a technical point of view, the general trend on the EUR/USD currency pair is bearish. But the price showed a bullish initiative from the daily support level yesterday. Under such market conditions, it is best to look for the sell trades from the resistance levels near the moving average. Buy trades can only be considered throughout the day from the zone where the buyers showed initiative.
Alternative scenario: if the price breaks through the 1.1854 resistance level and fixes above, the mid-term uptrend will likely resume.
News feed for 2021.08.12:
– Eurozone Industrial Production (m/m) at 12:00 (GMT+3);
– US Producer Price Index (m/m) at 15:30 (GMT+3);
– US Initial Jobless Claims (w/w) at 15:30 (GMT+3).
The GBP/USD currency pair
Technical indicators of the currency pair:
Prev Open: 1.3835
Prev Close: 1.3864
% chg. over the last day: +0.21%
Yesterday, the British currency added 0.21% amid the temporary weakness of the dollar index. There will be a lot of important macroeconomic statistics in the UK today. Good data may lead to the growth of the GBP/USD quotes.
Trading recommendations
Support levels: 1.3825, 1.3772, 1.3714, 1.3676 ,1.3641, 1.3614, 1.3525
The trend of the GBP/USD currency pair is bullish on the hourly time frame. The price rebounded from the support level and broke through the local descending channel. The MACD indicator has become positive. Under such market conditions, traders are better to look for the buy trades from the zone where the buyers showed initiative. Sell positions can be considered from the resistance levels and only on intraday timeframes.
Alternative scenario: if the price breaks through the 1.3714 support level and consolidates below, the bearish scenario is likely to resume.
News feed for 2021.08.12:
– UK Industrial Production (m/m) at 09:00 (GMT+3);
– UK Manufacturing Production (m/m) at 09:00 (GMT+3).
The USD/JPY currency pair
Technical indicators of the currency pair:
Prev Open: 110.54
Prev Close: 110.43
% chg. over the last day: -0.10%
The USD/JPY currency pair decreased by 0.1% due to a drop in the dollar index. Japan’s industrial production index increased from 5.0% to 5.6% on a year-on-year basis. It’s better than economists’ forecasts, but the overall Q3 fundamental forecast for Japan remains weak.
Trading recommendations
Support levels: 110.34, 109.88, 109.43, 109.19, 108.65
Resistance levels: 110.66, 110.95, 111.48
The main trend on the USD/JPY currency pair is bullish. The MACD indicator went below zero. Under such market conditions, it is better to look for the buy positions from the support level near the moving average. Sell positions should be considered only on the lower time frames from the zone where the sellers showed initiative.
Alternative scenario: if the price falls below 109.19, the uptrend is likely to be broken.
News feed for 2021.08.12:
– Japan Industrial Production (m/m) at 07:30 (GMT+3).
The USD/CAD currency pair
Technical indicators of the currency pair:
Prev Open: 1.2519
Prev Close: 1.2503
% chg. over the last day: -0.13%
The Canadian dollar is highly dependent on the performance of the dollar index and oil price performance. Yesterday, the decrease in the dollar index and the rise in oil prices caused a strengthening of the Canadian dollar and a decrease in the USD/CAD quotes.
Considering technical analysis, the USD/CAD trend is bearish. The price went below the moving average, and the MACD indicator shows signs of divergence. Under such market conditions, it is better to look for the sell positions from the resistance levels. Traders should consider the buy positions from the support levels and only on intraday time frames.
Alternative scenario: if the price breaks through the 1.2671 resistance level and fixes above, the uptrend is likely to be resumed.
This article reflects a personal opinion and should not be interpreted as an investment advice, and/or offer, and/or a persistent request for carrying out financial transactions, and/or a guarantee, and/or a forecast of future events.
A drop in July’s core CPI in the US has put the greenback on the defense.
The rebound had gained traction after the pair closed above 110.50, a major resistance on the daily chart. This is a strong sign that the rally may have resumed after a five-week-long consolidation.
Though a repeatedly overbought RSI showed overextension in the short-term, and the current pullback would test the psychological level of 110.00.
Then 111.20 would be the next stop if the bullish momentum picks up again.
AUDUSD tests key resistance
The Australian dollar hit resistance after worse-than-expected consumer inflation expectations.
The pair is still under pressure after it met stiff selling pressure at the 20-day moving average (0.7400).
The drop below the key support at 0.7330 may have threatened the chance of a sustainable rebound. Only a bullish close above 0.7400 would bring back confidence to the bulls.
Otherwise, past 0.7320 the bears would challenge the floor at 0.7290. A breakout could trigger an extended sell-off as those who bought the dip switch side.
US OIL attempts rebound
WTI crude recouped losses after the US inventory showed a deficit last week.
Strong buying interest on the daily support line at 65.30 has initiated a rebound. However, a bearish MA cross on the daily chart may have tempered the bullish mood.
The bulls will need to lift the psychological level of 70.00 as a show of strength. Then they may have a chance to grind past 74 and preserve the rally.
Failing that, a break below the said support may trigger a bearish reversal towards last May’s low at 61.50.
After yesterday’s slightly disappointing US inflation data release, markets are in wait-and-see mode about how the Fed addresses rising price pressures. Inflation expectations are moving higher which means the world’s most important central bank may struggle to continue arguing that they are well anchored.
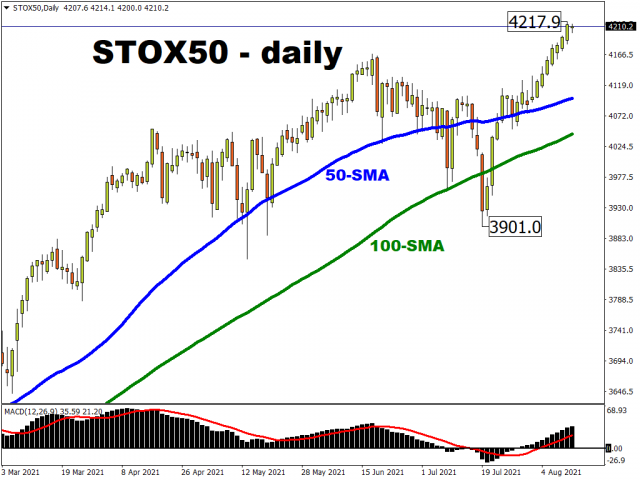
The dollar is consolidating yesterday’s selloff while stock markets and bond markets have breathed a collective sigh of relief that inflation didn’t accelerate even further. Value sensitive sectors like materials, industrials and financials outperformed on the day pushing the Dow and S&P500 to fresh record high closes. European bourses had hit multi-year highs yesterday but have opened up mixed so far.
Oil rebounds
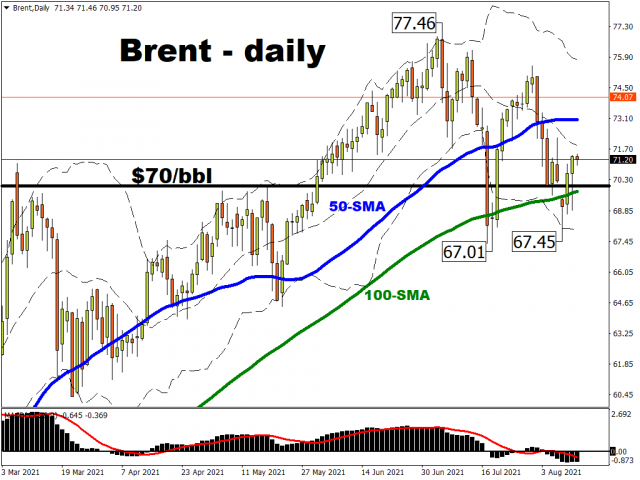
It was a volatile day in oil markets with prices moving down towards $69 and then up above $71 on various headlines. The US administration heaped pressure on OPEC and its allies to boost supply to tackle rising gasoline prices. The Biden Presidency wants to see Americans “have access to affordable and reliable energy…at the pump”. Of course interestingly, concerns over rising commodity prices are also being voiced by the Chinese authorities.
The current increase by OPEC+ agreed recently of 400k barrels per day is seemingly not enough. But given the uncertainty around the spread of the Delta variant, it seems unlikely that the Saudis and the oil-producing group will want to increase production just yet. The contradictory nature of Biden policies is also being questioned as it urges greener energy while asking foreign producers to open the taps to lower pump prices.
UK Q2 GDP in line
Hot off the press, second quarter UK GDP has just been released in line with the consensus at 4.8% q/q. Growth is expected to slow again this quarter due to the Delta variant putting the brakes on the economy. But economists hope that the UK should still return to pre-pandemic levels by the end of this year.
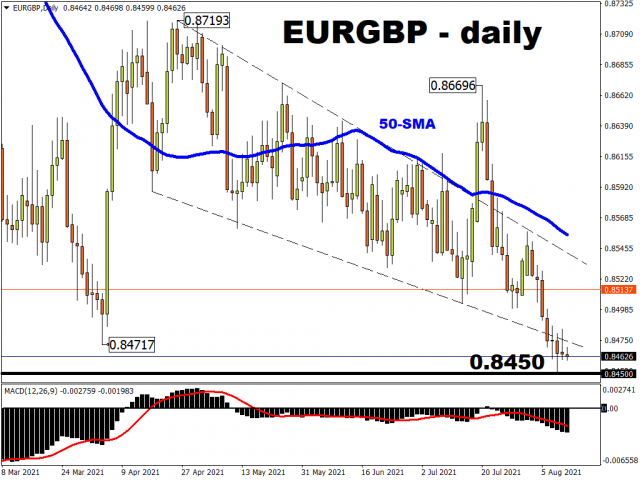
With the hawkish noises from the Bank of England last week contrasting heavily with the continued dovish stance of the ECB, EUR/GBP has pushed to new 18-month lows. Prices are now consolidating just below the 0.8471 level and bears expect to see more downside, especially as the ECB engineers a weaker currency. A soft weekly close may start to challenge the 2019 and 2020 lows at 0.8281 and below.
Disclaimer: The content in this article comprises personal opinions and should not be construed as containing personal and/or other investment advice and/or an offer of and/or solicitation for any transactions in financial instruments and/or a guarantee and/or prediction of future performance. ForexTime (FXTM), its affiliates, agents, directors, officers or employees do not guarantee the accuracy, validity, timeliness or completeness, of any information or data made available and assume no liability as to any loss arising from any investment based on the same.














 Article by