Prepare Now for a Brutal Austerity — Here’s Why

Here’s what’s holding together a “global house of cards”

By Elliott Wave International

When financial times get tough, you hear the phrases “tightening our belts,” “cutting back” or “making do with less.”

Those are common phrases to describe the word “austerity.”

If spending and borrowing had been done with moderation when times were good, then the tough times would not be as tough — or austere.

Instead of “moderation,” the best word to describe what’s going on in the U.S. now is “excessive,” as these headlines attest:

  • Consumers boost spending in June (Marketwatch, July 30)
  • … Corporate Debt Is Ballooning (Forbes, August 4)
  • A blowout in government borrowing … (Bloomberg, August 19)

Individuals, corporations and governments find it difficult to be financially frugal when interest rates are exceptionally low.

Here’s what the August Global Market Perspective, a monthly Elliott Wave International publication which covers 50+ worldwide financial markets, has to say:

We have little doubt that it will take a long period of austerity to correct the world’s multigenerational debt binge. …

The chart illustrates the interest-rate environment that holds together this global house of cards. In July, the average interest rate across 20 [advanced] economies fell to 0.5%, a new low (by far) dating back at least a century.

Indeed, according to at least one source, rates are as low as they’ve been in 50 centuries.

Let’s return to the August Global Market Perspective:

This chart is a version of one published by Sidney Homer and Richard Sylla in their 2005 book: A History of Interest Rates. Astoundingly, it shows a potential 5,000-year low in both short-term interest rates and long-term interest rates.

When interest rates start to rise, and it becomes difficult to service debt, a brutal austerity will be the order of the day.

As you might imagine, the best course of action — especially at this juncture — is to refrain from assuming debt and to save as much cash as possible. When austerity reigns, cash will be king.

Another course of action is to learn what the Elliott wave model suggests is next for interest rates (or bond yields).

If you need to brush up on your knowledge of the Elliott wave model, or are new to the subject, you are encouraged to read the Wall Street classic, Elliott Wave Principle: Key to Market Behavior, by Frost & Prechter. Here’s an excerpt from the book:

What the Wave Principle provides is a means of first limiting the possibilities and then ordering the relative probabilities of possible future market paths. Elliott’s highly specific rules reduce the number of valid alternatives to a minimum. Among those, the best interpretation, sometimes called the “preferred count,” is the one that satisfies the largest number of guidelines. Other interpretations are ordered accordingly. As a result, competent analysts applying the rules and guidelines of the Wave Principle objectively should usually agree on both the list of possibilities and the order of probabilities for various possible outcomes at any particular time. That order can usually be stated with certainty. Do not assume, however, that certainty about the order of probabilities is the same as certainty about one specific outcome. Under only the rarest of circumstances do you ever know exactly what the market is going to do. You must understand and accept that even an approach that can identify high odds for a fairly specific event must be wrong some of the time.

You can prepare yourself psychologically for such outcomes through the continual updating of the second best interpretation, sometimes called the “alternate count.” Because applying the Wave Principle is an exercise in probability, the ongoing maintenance of alternative wave counts is an essential part of using it correctly. In the event that the market violates the expected scenario, the alternate count puts the unexpected market action into perspective and immediately becomes your new preferred count. If you’re thrown by your horse, it’s useful to land right atop another.

Here’s the good news: You can access the online version of the book for free when you join Club EWI — the world’s largest Elliott wave educational community (approximately 350,000 worldwide members and rapidly growing).

You can join Club EWI for free and enjoy access to a wealth of Elliott wave resources on financial markets, trading and investing. All the while, you are under no obligations as a Club EWI member.

You can have the book on your computer screen in just a few minutes by following this link: Elliott Wave Principle: Key to Market Behavior — unlimited and free access.

This article was syndicated by Elliott Wave International and was originally published under the headline Prepare Now for a Brutal Austerity — Here’s Why. EWI is the world’s largest market forecasting firm. Its staff of full-time analysts led by Chartered Market Technician Robert Prechter provides 24-hour-a-day market analysis to institutional and private investors around the world.

Intraday Market Analysis – Dow Jones Tests All-Time High

By Orbex

US 30 challenges peak

US30

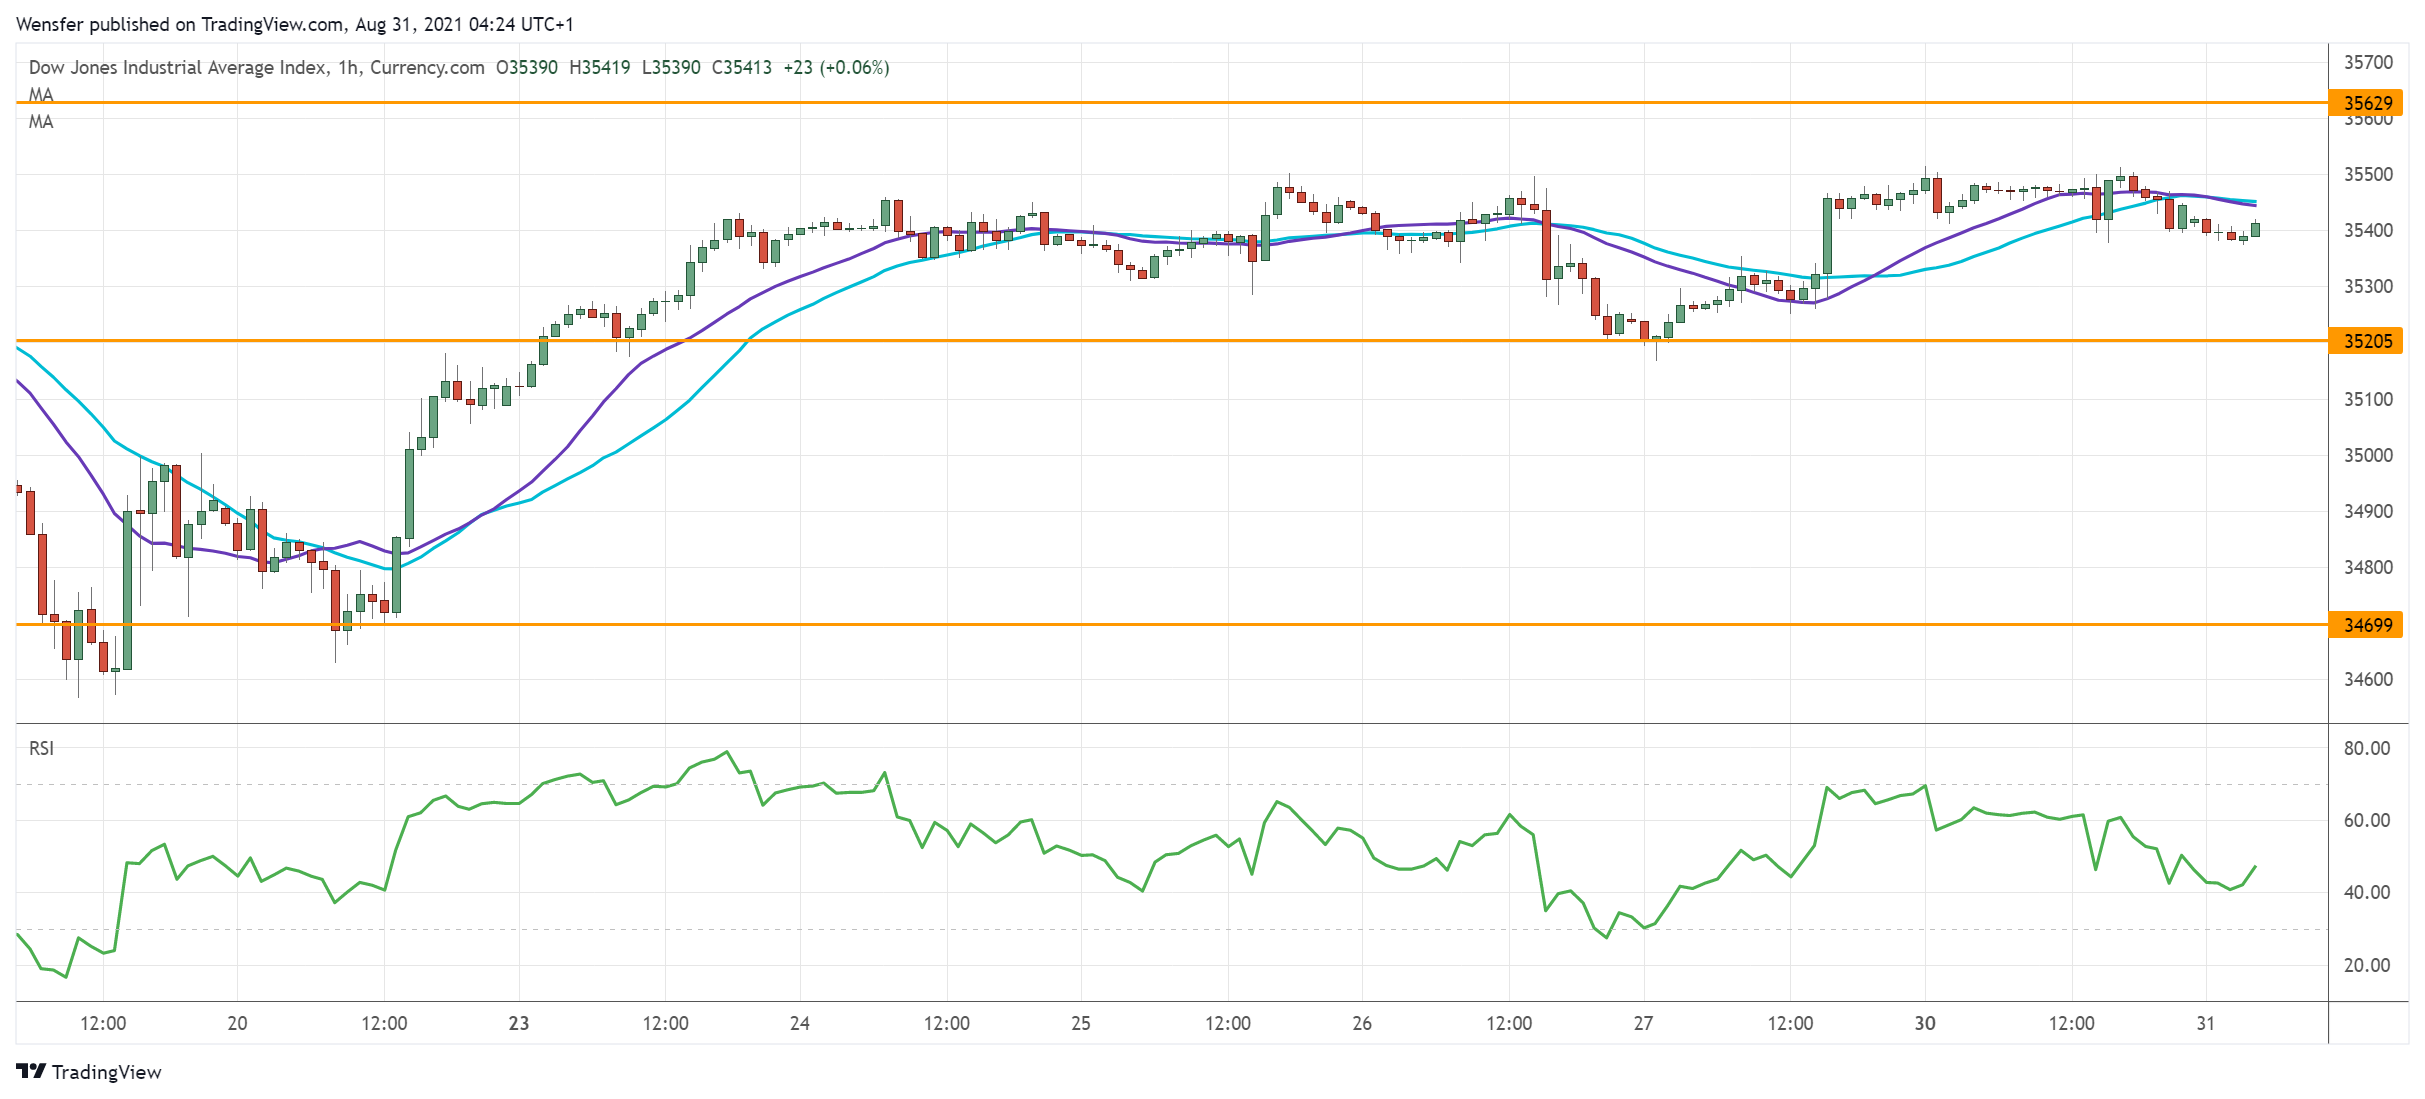
The Dow Jones 30 index holds near its historic high on upbeat investor sentiment.

The break above 35330 has signaled the bulls’ commitment to maintain the upward bias, while 35200 is fresh support.

An oversold RSI has attracted the buying-the-dips mentality.

Price action has recouped the most recent losses and is now testing the peak at 35630. A bullish breakout may extend the rally towards the milestone at 36000. A deeper pullback would lead to the critical floor at 34700.

USDJPY awaits breakout

USDJPY

The Japanese yen inched higher after a drop in July’s unemployment rate. The pair is in a narrowing trading range following its bounce off the demand zone at 109.10.

Sentiment remains optimistic as long as price action stays above this critical level.

However, the bulls may encounter selling pressure at 110.50 from the August sell-off. A bullish breakout would attract momentum buyers and extend the rally to above 111.00.

On the downside, a break below 109.50 would lead to a retest of buyers’ resolve.

NZDUSD tests major resistance

NZDUSD

The US dollar continues to weaken across the board from the post-Jackson Hole hangover. The Kiwi is at a crossroads as it climbs back to the daily resistance at 0.7050, the origin of the previous sell-off.

A bullish breakout would prompt sellers to cover their bets and lay the groundwork for a reversal.

0.7100 would be the next target. However, the RSI’s multiple ventures into the overbought territory may temper the bullish fever.

The base of the momentum at 0.6940 is the key to keeping the recovery valid.

By Orbex

USDCHF Zigzag Could Print Fresh Highs

By Orbex

The current USDCHF formation hints at a double zigzag Ⓦ-Ⓧ-Ⓨ in cycle wave y. Currently, the last primary wave Ⓨ is under development.

Due to its complex internal structure, it will most likely take the form of a double combination (W)-(X)-(Y). If waves (W) and (X) have been completed already, then wave (Y) could provide a bullish opportunity.

Analysts expect the end of wave (Y) near 0.947. At that level, cycle wave y will be at 76.4% of wave w.

USDCHF

However, the primary wave Ⓧ may not be fully completed yet. In that case, probabilities suggest that it could take the formation of a double three (W)-(X)-(Y) pattern.

With two-thirds of the structure in wave (Y) completed, we could see prices move in wave C towards the 0.901 area. At that level, primary wave Ⓧ will be at 76.4% of wave Ⓦ.

By Orbex

Chris Vermeulen’s Trader Tip Of The Week – August 31, 2021

By TheTechnicalTraders 

PBJ does not always mean peanut butter and jam!

Join Chris today for his Trader Tip of the Week. He walks us through the moves in the ETF PBJ since the onset of Covid. After a series of rallies and consolidations, it seems PBJ is showing signs of an upward trend.

Watch the video as Chris explains:

  • How to place a Fibonacci Extension.
  • What does ‘putting in a bottom’ mean in the market?
  • How does a bull flag form?

Subscribers to any service at The Technical Traders: Please let us know via a member ticket what you would like to learn about and we will do our best to make sure this happens.

Non-subscribers: Please enjoy these micro-lessons as a way to further your education and understanding of how a technical trader…well…trades!

CLICK ON THE IMAGE BELOW TO WATCH THE VIDEO

TO EXPLORE THE DIFFERENT TRADING STRATEGIES CHRIS OFFERS, PLEASE VISIT US AT THE TECHNICAL TRADERS. YOU’VE GOT MORE TO GAIN THAN TO LOSE WHEN SEEKING INFORMATION!

TheTechnicalTraders.com

American Express: A Compelling Buy

By Ino.com

American Express (AXP) blurs the line between a traditional credit card company and effecting traditional banking services such as personal and business loans and savings accounts. This business model blend makes American Express a dual-threat as it can ride the wave of improved consumer spending coming out of the pandemic as witnessed by its blow-out second-quarter earnings and rising interest rates as the Federal Reserve steps off its accommodative easing policies. American Express has recently dropped over 10% from its 52-week high after target price hikes and upgrades across a broad range of analysts. Couple this with inexpensive valuation metrics, and the fundamental and technical investment case comes together nicely. American Express sits in the sweet spot of an improved consumer and a potential rising interest rate environment.

Latest Earnings and Growth

The recent earnings report by American Express demonstrated its strength and potential growth moving forward as the pandemic continues to subside. Analysts across the board upgraded the stock and increased the price targets because of these stellar earnings. Earnings blew past analysts’ estimates, driven by a recovery in global consumer spending, specifically on travel. Consumer spending logged double-digit growth in the second quarter. The U.S. consumer has “rocketed ahead on travel,” per CFO Jeff Campbell, with spending related to travel and entertainment on its cards within the United States reaching 98% of pre-pandemic levels. On global travel and entertainment spending, he said it had recovered to nearly 70% of 2019 levels, two quarters earlier than previously expected. Strong demand for premium, fee-based products helped drive the addition of U.S. Platinum card members to record levels, per CEO Stephen Squeri. The company sold 2.4 million new proprietary cards in the quarter, while spending on goods and services on its cards grew 16% on a currency-adjusted basis. Net income rose to $2.28 billion, or $2.80 per share, for the quarter ended June 30 from $257 million, or 29 cents per share, a year earlier. Analysts had expected $1.67 per share, according to Refinitiv IBES data. Excluding interest expense, American Express’ total revenue rose 33% to around $10.24 billion.

Financial Cohort Financial Linkage

The confluence of rising rates, post-pandemic economic rebound, financially strong balance sheet, and a robust housing market will be tailwinds for American Express, just like it will be for the big banks. Recent CPI readings have spooked the markets as these serve as a harbinger for the inevitable rise in interest rates which translates into higher margins for lenders. As investors grapple with the prospect of downstream rate increases, pockets of vulnerabilities throughout the market have been exposed and may introduce some systemic risk; however, those that are in the lending business will benefit from higher rates and expanded margins within those business segments. American offers personal and business loans and offers savings account as well, which will all bode well in a rising interest rate environment.

Inexpensive Stock

American Express currently boasts a P/E of 18.5 and a PEG of only 0.45 after a nosedive from its 52-week high of $180 to $160 or an 11% haircut out of nowhere and unrelated to earnings. During this nosedive, AXP sits at its most oversold condition over the past year. Technically, the Relative Strength Index (RSI) and Bollinger bands were both in agreement that this move down has been overdone.

Some of the more noteworthy analysts across the board have recently upgraded price targets on American Express. Morgan Stanley has a price target of $200, Goldman Sachs has a price target of $219, Deutsche Bank has a price target of $190, and JPMorgan has a price target of $197. The vast majority of these analysts have an overweight or outperform rating on the stock.

Conclusion

American Express’ business model blend makes the company a dual-threat as it can ride the wave of improved consumer spending coming out of the pandemic as witnessed by its blow-out second-quarter earnings and rising interest rates as the Federal Reserve steps off its accommodative easing policies. American Express has recently dropped over 10% from its 52-week high after target price hikes and upgrades across a broad range of analysts labeling the stock as a buy or overweight. American Express boasts an inexpensive valuation relative to its credit card peers Visa (V) and Mastercard (MA). The recent earnings report by American Express demonstrated its strength and potential growth moving forward as the pandemic continues to subside. Earnings blew past analysts’ estimates, driven by a recovery in global consumer spending, specifically on travel. American Express (AXP) is a compelling buy after this double-digit sell-off due to exogenous market events unrelated to the fundamental and technical combination.

Noah Kiedrowski
INO.com Contributor

Disclosure: The author holds shares in AAPL, AMZN, DIA, GOOGL, JPM, MSFT, QQQ, SPY and USO. He may engage in options trading in any of the underlying securities. The author has no business relationship with any companies mentioned in this article. He is not a professional financial advisor or tax professional. This article reflects his own opinions. This article is not intended to be a recommendation to buy or sell any stock or ETF mentioned. Kiedrowski is an individual investor who analyzes investment strategies and disseminates analyses. Kiedrowski encourages all investors to conduct their own research and due diligence prior to investing. Please feel free to comment and provide feedback, the author values all responses. The author is the founder of www.stockoptionsdad.com where options are a bet on where stocks won’t go, not where they will. Where high probability options trading for consistent income and risk mitigation thrives in both bull and bear markets. For more engaging, short duration options based content, visit stockoptionsdad’s YouTube channel.

By Ino.com – See our Trader Blog, INO TV Free & Market Analysis Alerts

Source: American Express: A Compelling Buy


As the Fed preps for tapering, expect more volatility in Asia

By Dan Steinbock

– Economic recovery has proved elusive in Asia, thanks to the West’s pandemic mismanagement and vaccine inequality. The Fed’s impending tapering will add to the woes.

On Friday, Jay Powell suggested that the US central bank had met one of the two goals it had sought to achieve before reducing its monthly $120 billion asset purchase program.

In the closely-watched speech at the Jackson Hole conference, the Fed chair said that ‘substantial further progress’ test has been met for inflation. There has also been clear progress toward maximum employment.”

The majority of the Fed officials believe it is appropriate to start “tapering” the bond-buying program in the fall.

In effect, the Fed cannot avoid tapering.

Why the Fed needs to taper   

Instead of responding to the WHO’s coronavirus warnings in January 2020, the Fed, like the Trump White House, took its time. It awoke only after the WHO’s declaration of the global pandemic two months later.

On March 20, 2020, the Fed slashed its short-term benchmark interest rate to near zero. To provide additional stimulus, it began purchasing $120 billion monthly in Treasury and mortgage securities.

While US headline and core inflation are currently above 5%, significantly higher than the Fed’s 2% inflation target, recent jobs report suggests the recovery is broadening. Yet, the big picture is mixed.

While Powell was speaking, the White House more than doubled its forecast for annual inflation in new projections, as supply-chain disruptions continue to put upward pressure on prices, due to the pandemic and the Delta variant.

The consumer-price index is now expected to steady at 2.5% in fall 2022. Yet, critics believe the Fed is stoking still another real estate price bubble that threatens to wipe out home equity.

The cold reality is that the longer the Fed maintains its excessively loose monetary policy, the more it is generating excess liquidity, which is fostering inflation. That is likely to prove costly in the future. Over a decade of ultra-loose fiscal and monetary policies have put the global economy on track for a slow-motion train wreck.

Officially, the Fed’s dual mandate is to focus on price stability and full employment. International implications remain a secondary consideration.

PBOC cautious, BOJ limited, BOK hiking   

What is the strategy of the People’s Bank of China (PBOC) toward the Fed’s tapering? The simple answer: In the short-term, cautiously accommodative. In the medium-term, cautiously neutral. If warranted, PBOC is likely to inject liquidity to avoid tightening of monetary conditions.

Unlike the major economies in the West, China has largely contained the novel coronavirus and is rebounding ahead of other major economies.

In contrast, Japan faces extraordinary challenges. Ex-premier Shinzo Abe’s structural reforms proved inadequate, despite huge fiscal stimulus packages, ultra-low rates and rounds of quantitative easing. Secular challenges have been coupled with the COVID-19 surge.

Amid the rising political discontent, Premier Suga is battling for his political future. Inflation remains close to 0%, with interest rate at -0.1%. The maneuverability of the Bank of Japan’s is limited. Sovereign debt is close to 270% of GDP and rising.

Two days before Powell’s speech, the Bank of Korea raised its interest to 0.75%, as the first developed economy to do so in the pandemic era. It was necessitated by financial risks pressuring the economy, including heated house prices and rising household debt.

The move is not likely to be followed by Asia’s other central banks.

Central banks uneasy in Southeast Asia

Instead of the much-anticipated recovery, Southeast Asia is struggling with the Delta variant and vaccine inequality, which have resulted in slower vaccination rollouts. Hence, the lowered GDP forecasts across the region.

With policy rates at a historical low, Southeast Asia will soon have to cope with the Fed’s impending rate hikes. Since early spring 2020, all regional economies have been busy cutting their rates.

While the rates have almost halved in both Vietnam (interest rate 4.00) and Indonesia (3.50), their central banks continue to have adequate policy space. In turn, the central banks of the Philippines (2.00) and Malaysia (1.75) still have significant space available. By contrast, Thailand’s (0.25) options are now more limited.

Foreign-exchange fluctuations reflect the new realities. Before the pandemic, the Thai baht was still the strongest-performing regional currency. But it has plunged more than -10 against the US dollar.

Malaysian ringgit and the Philippine peso (about -4%) remain somewhat exposed, whereas Singapore dollar and Indonesian rupiah (about -2%) are better positioned. Vietnamese dong has actually appreciated (+1%) relative to the US dollar, thanks to foreign-exchange truce with Washington.

The coming economic storm

Even today, the US economy, central bank and dollar serve as the yardsticks for international performance. Yet, the Biden administration’s multi-trillion-dollar infrastructure investment initiatives ignore the country’s dire fundamentals.

US sovereign debt is close to 135% of GDP and climbing ever faster. Persistent budget deficits will cause the federal debt to double in size over the next three decades.

In the past four decades, the strength of the greenback, as measured by the US dollar index (DXY) has progressively weakened, despite the Fed’s hikes. After Paul Volcker’s massive rate hikes in the early 1980s, the index peaked at 160. In the early 2000s, it was barely 120. In the past year, it has lingered around 89 to 95 (Figure).

Figure      US Dollar and US Rates, 1970-2020

Unsurprisingly, Powell’s comments on Friday penalized the dollar index by 0.4%. It was down 0.9% for the week; the sharpest decline since early May. As global growth prospects are fueled by large emerging economies, the global economy is being held hostage by a graying, excessively indebted single currency.

For some time, data by the International Monetary Fund (IMF) has suggested that the dollar may be losing its draw as a reserve currency. The longstanding debate on the US dollar as the world’s reserve currency will intensify in the coming months. Perhaps it made sense in 1945, when the US economy still accounted for half of the global economy. But today those days of wine and roses are way gone.

We are navigating in unchartered waters with few life boats, all of which are leaking.

About the Author:

Dr. Dan Steinbock is an internationally recognized strategist of the multipolar world and the founder of Difference Group. He has served at the India, China and America Institute (USA), Shanghai Institutes for International Studies (China) and the EU Center (Singapore). For more, see https://www.differencegroup.net  

Based on global briefing of August 27, 2021

Ichimoku Cloud Analysis 31.08.2021 (EURUSD, AUDUSD, USDCAD)

Article By RoboForex.com

EURUSD, “Euro vs US Dollar”

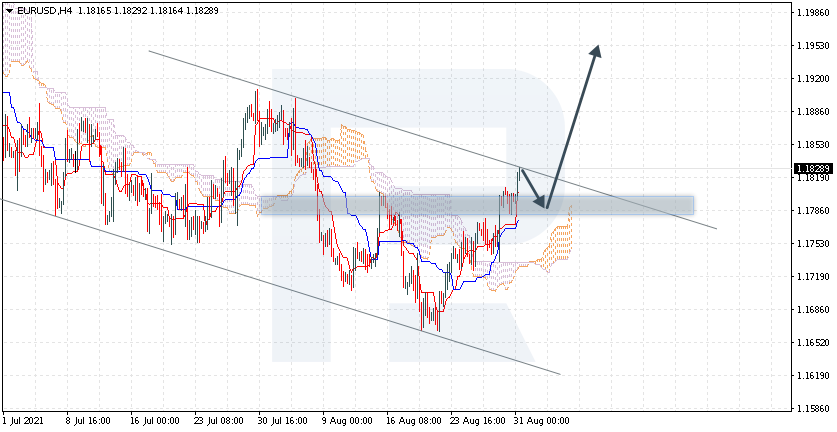
EURUSD is trading at 1.1828; the instrument is moving above Ichimoku Cloud, thus indicating an ascending tendency. The markets could indicate that the price may test Tenkan-Sen and Kijun-Sen at 1.1790 and then resume moving upwards to reach 1.1955. Another signal in favor of a further uptrend will be a rebound from the support level. However, the bullish scenario may be cancelled if the price breaks the cloud’s downside border and fixes below 1.1680. In this case, the pair may continue falling towards 1.1585. To confirm further growth, the asset must break the descending channel’s upside border and fix above 1.1845.

EURUSD
Risk Warning: the result of previous trading operations do not guarantee the same results in the future

AUDUSD, “Australian Dollar vs US Dollar”

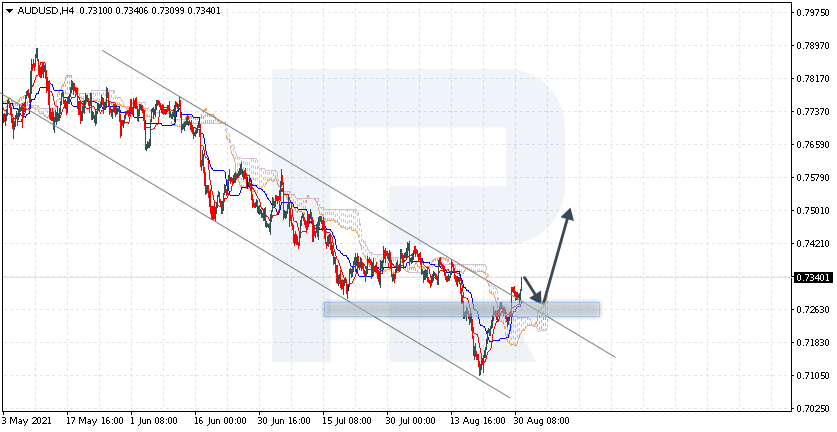
AUDUSD is trading at 0.7340; the instrument is moving above Ichimoku Cloud, thus indicating an ascending tendency. The markets could indicate that the price may test the cloud’s upside border at 0.7265 and then resume moving upwards to reach 0.7505. Another signal in favor of a further uptrend will be a rebound from the support level. However, the bullish scenario may no longer be valid if the price breaks the cloud’s downside border and fixes below 0.7175. In this case, the pair may continue falling towards 0.7085.

AUDUSD
Risk Warning: the result of previous trading operations do not guarantee the same results in the future

USDCAD, “US Dollar vs Canadian Dollar”

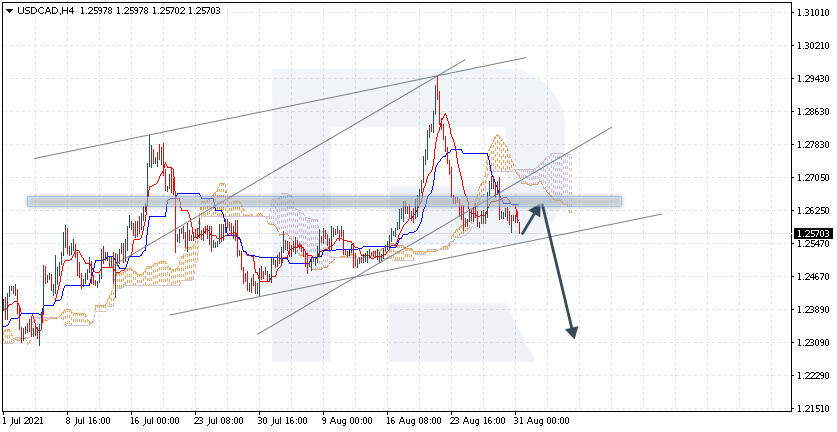
USDCAD is trading at 1.2570; the instrument is moving below Ichimoku Cloud, thus indicating a descending tendency. The markets could indicate that the price may test Tenkan-Sen and Kijun-Sen at 1.2625 and then resume moving downwards to reach 1.2310. Another signal in favor of a further downtrend will be a rebound from the resistance level. However, the bearish scenario may no longer be valid if the price breaks the cloud’s upside border and fixes above 1.2805. In this case, the pair may continue growing towards 1.2905. To confirm further decline, the asset must break the rising channel’s downside border and fix below 1.2525.

USDCAD

Article By RoboForex.com

Attention!
Forecasts presented in this section only reflect the author’s private opinion and should not be considered as guidance for trading. RoboForex LP bears no responsibility for trading results based on trading recommendations described in these analytical reviews.

Fed Statements Drive New Rally Momentum In The Stock Markets

By TheTechnicalTraders 

– Last week, the US Federal Reserve reiterated statements in support of continued easy money policies and support for a recovering US economy.  Additionally, Jerome Powell made a statement suggesting tightening too early could be much more damaging than waiting until sufficient headwinds are behind us.  I interpret this as stating the current inflationary concerns are less important than the current global market expectations.  We can likely weather moderate inflationary concerns if the economy continues to strengthen – whereas tightening right now may not reduce inflationary concerns and may prompt a broad market slowdown within the US and globally.

Sign up for my free trading newsletter so you don’t miss the next opportunity to learn more!

In short, traders and investors perceived these comments as “Here we go – off to the races again” and the US markets rallied sharply on Friday and in early trading on Monday, August 30, 2021.

NASDAQ/Technology Leading The Rally Charge

This Daily QLD, ProShares Ultra QQQ ETF, chart highlights the extended rally phase of the NASDAQ/QQQ.  With the current Fed statements, we expect $80 to be broken as this new rally phase attempts to target $82 to $84 – another 5% higher (or more).

IWM Breaks Above Dual-Pennant/Flag Formations.

This IWM Daily, Ishares Russell 2000 ETF, and the chart clearly illustrate a very strong Dual-Pennant/Flag breakout that has taken place with Friday’s rally attempt.  The move above $222.50 is very clearly an attempt to break above the Dual-Pennant/Flag channels and to break into a new Bullish price trend.

Once resistance near $227.50 is broken, the Russell 2000 ETF, IWM, should attempt a bigger rally attempt targeting $233 to $235.

We need to see this momentum carry forward through the end of September as the end of Q3:2021 should continue to trend higher with the US Federal Reserve’s recent statements.  Additionally, traders should be positioning capital ahead of the end of Q3:2021 expecting another round of strong earnings and profits in October/November – pushing the Christmas Rally into high gear.

Don’t miss these incredible opportunities and be sure to take advantage of the strongest performing market sectors – that’s where the real opportunity lies for traders.

Please take a minute to learn about my BAN Trader Pro newsletter service and how it can help you identify and trade better sector setups.  My team and I have built this strategy to help us identify the strongest and best trade setups in any market sector.  Every day, we deliver these setups to our subscribers along with the BAN Trader Pro system trades.  You owe it to yourself to see how simple it is to trade 30% to 40% of the time to generate incredible results.

As something entirely new, check out my initiative URLYstart to learn more about the youth entrepreneurship program I am developing. This is an online program of gamified entrepreneurship designed to introduce and inspire youth to start their own businesses. Click-by-click, each student will be guided from their initial idea, through the startup process all the way to their first sale and beyond. Along the way, our students will learn life lessons such as communication, perseverance, goal setting, teamwork, and more. My team and I are passionate about this project and want to reach as many people as possible!

Have a great day!

Chris Vermeulen
Chief Market Strategist

TheTechnicalTraders.com

Forex Technical Analysis & Forecast 31.08.2021

Article By RoboForex.com

EURUSD, “Euro vs US Dollar”

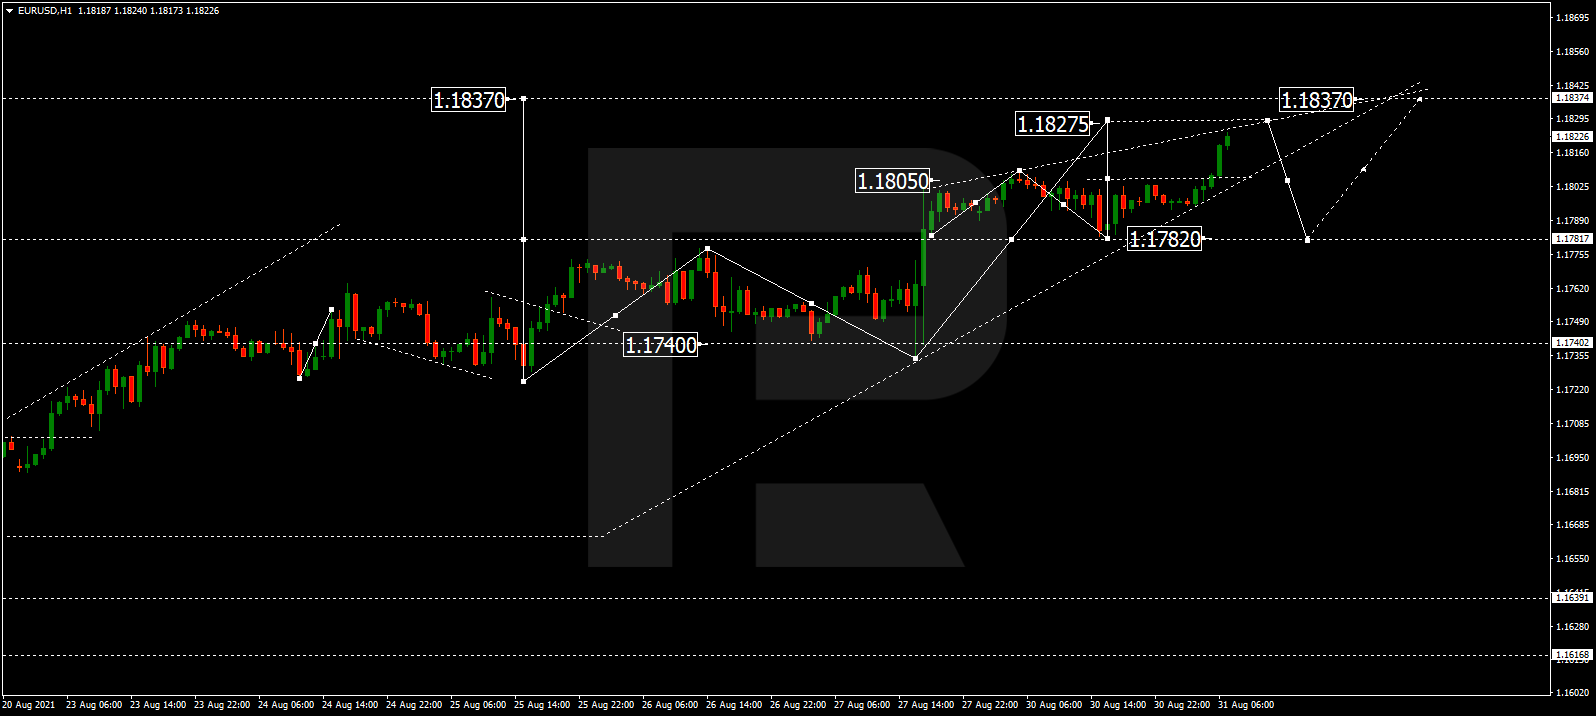
After forming a new consolidation range below 1.1805 and breaking it to the upside, EURUSD continues trading upwards. Possibly, today the pair may reach 1.1827 or even extend this structure up to 1.1837. Later, the market may form one more consolidation range. If the price breaks this range to the downside, the instrument may start a new correction with the target at 1.1750.

EURUSD
Risk Warning: the result of previous trading operations do not guarantee the same results in the future

GBPUSD, “Great Britain Pound vs US Dollar”

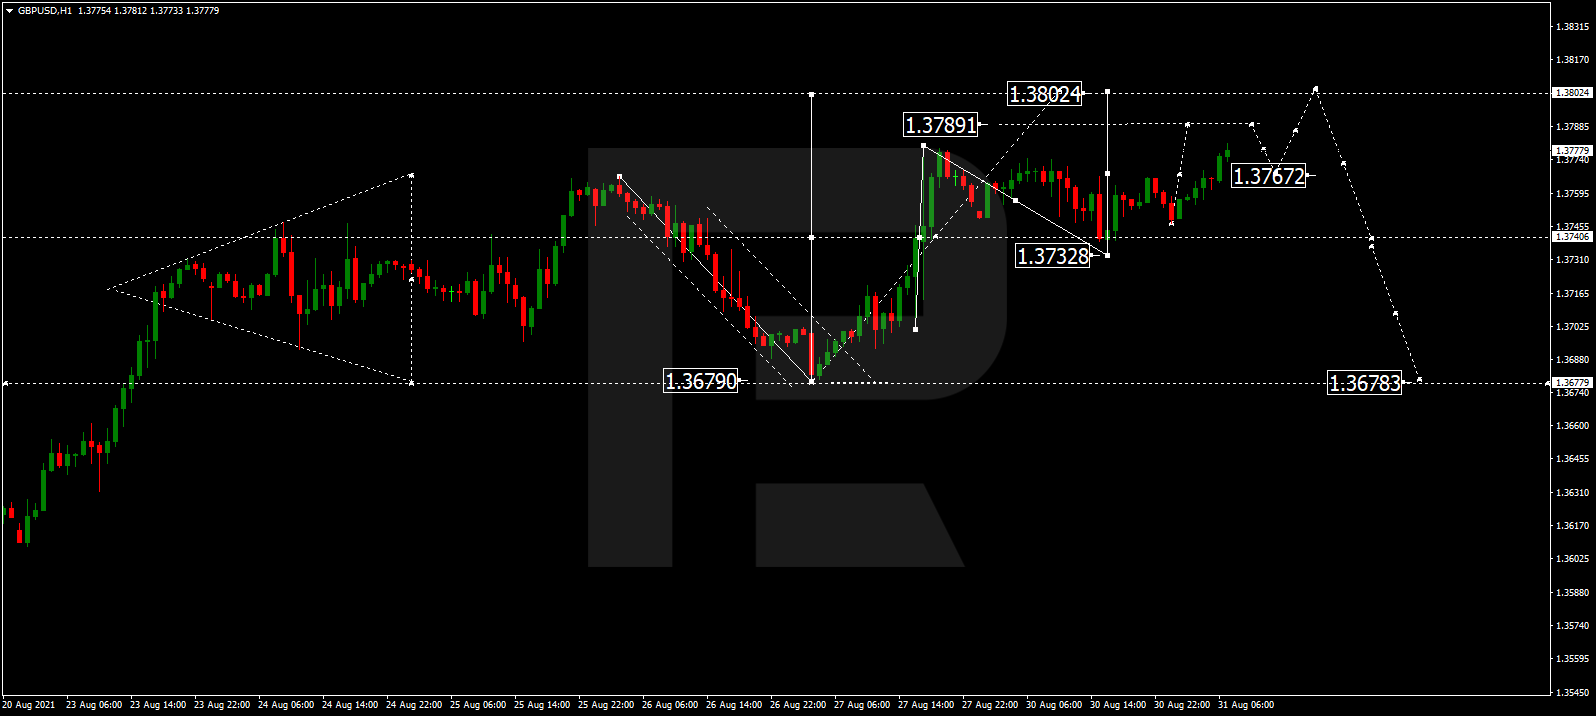
After rebounding from 1.3733 and breaking 1.3760, GBPUSD is expected to expand the consolidation range up to 1.3802. After that, the instrument may start another decline to break 1.3733 and then continue trading downwards with the target at 1.3678.

GBPUSD
Risk Warning: the result of previous trading operations do not guarantee the same results in the future

USDRUB, “US Dollar vs Russian Ruble”

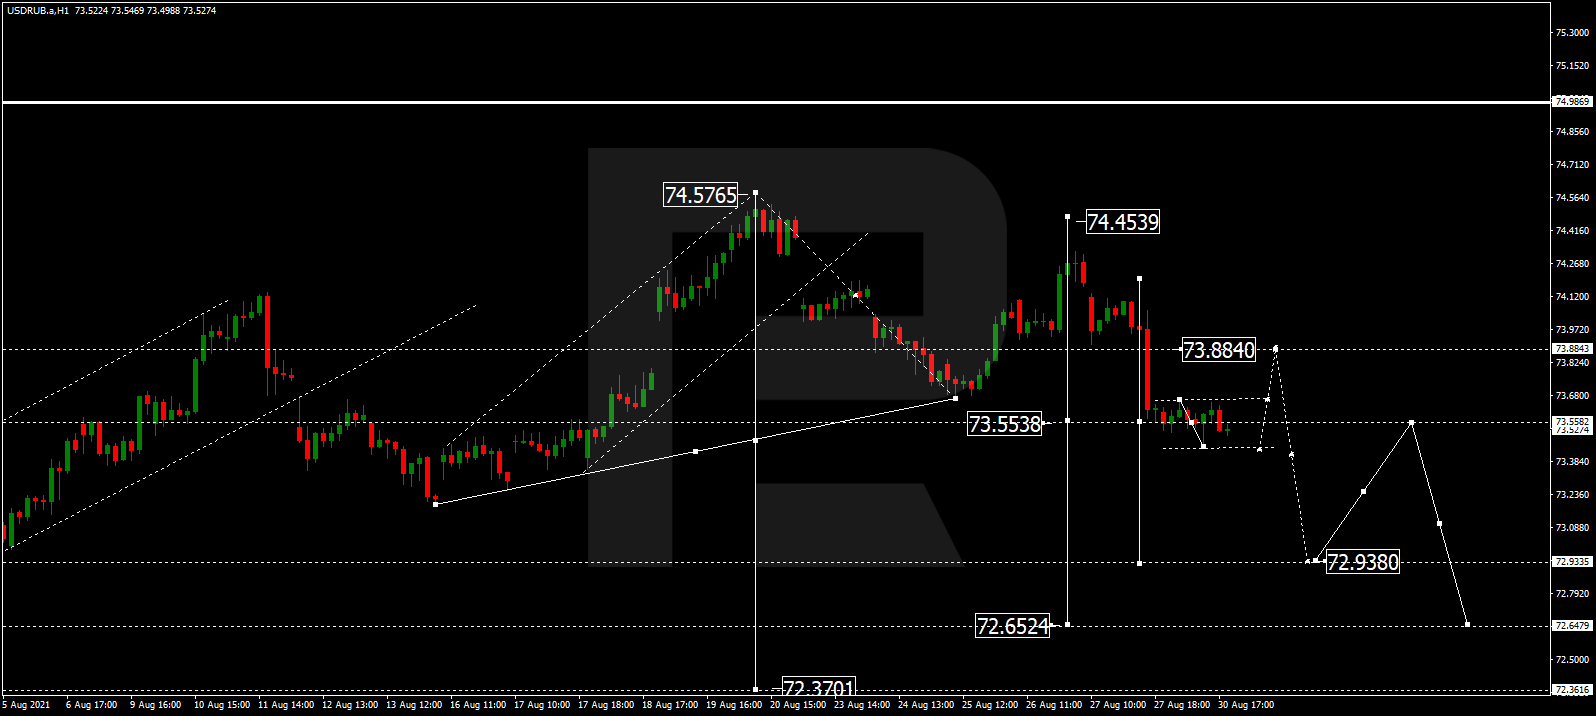
USDRUB has formed a new consolidation range around 73.55. Today, the pair may fall to break 73.33 and then continue trading downwards with the short-term target at 72.93.

USDRUB
Risk Warning: the result of previous trading operations do not guarantee the same results in the future

USDJPY, “US Dollar vs Japanese Yen”

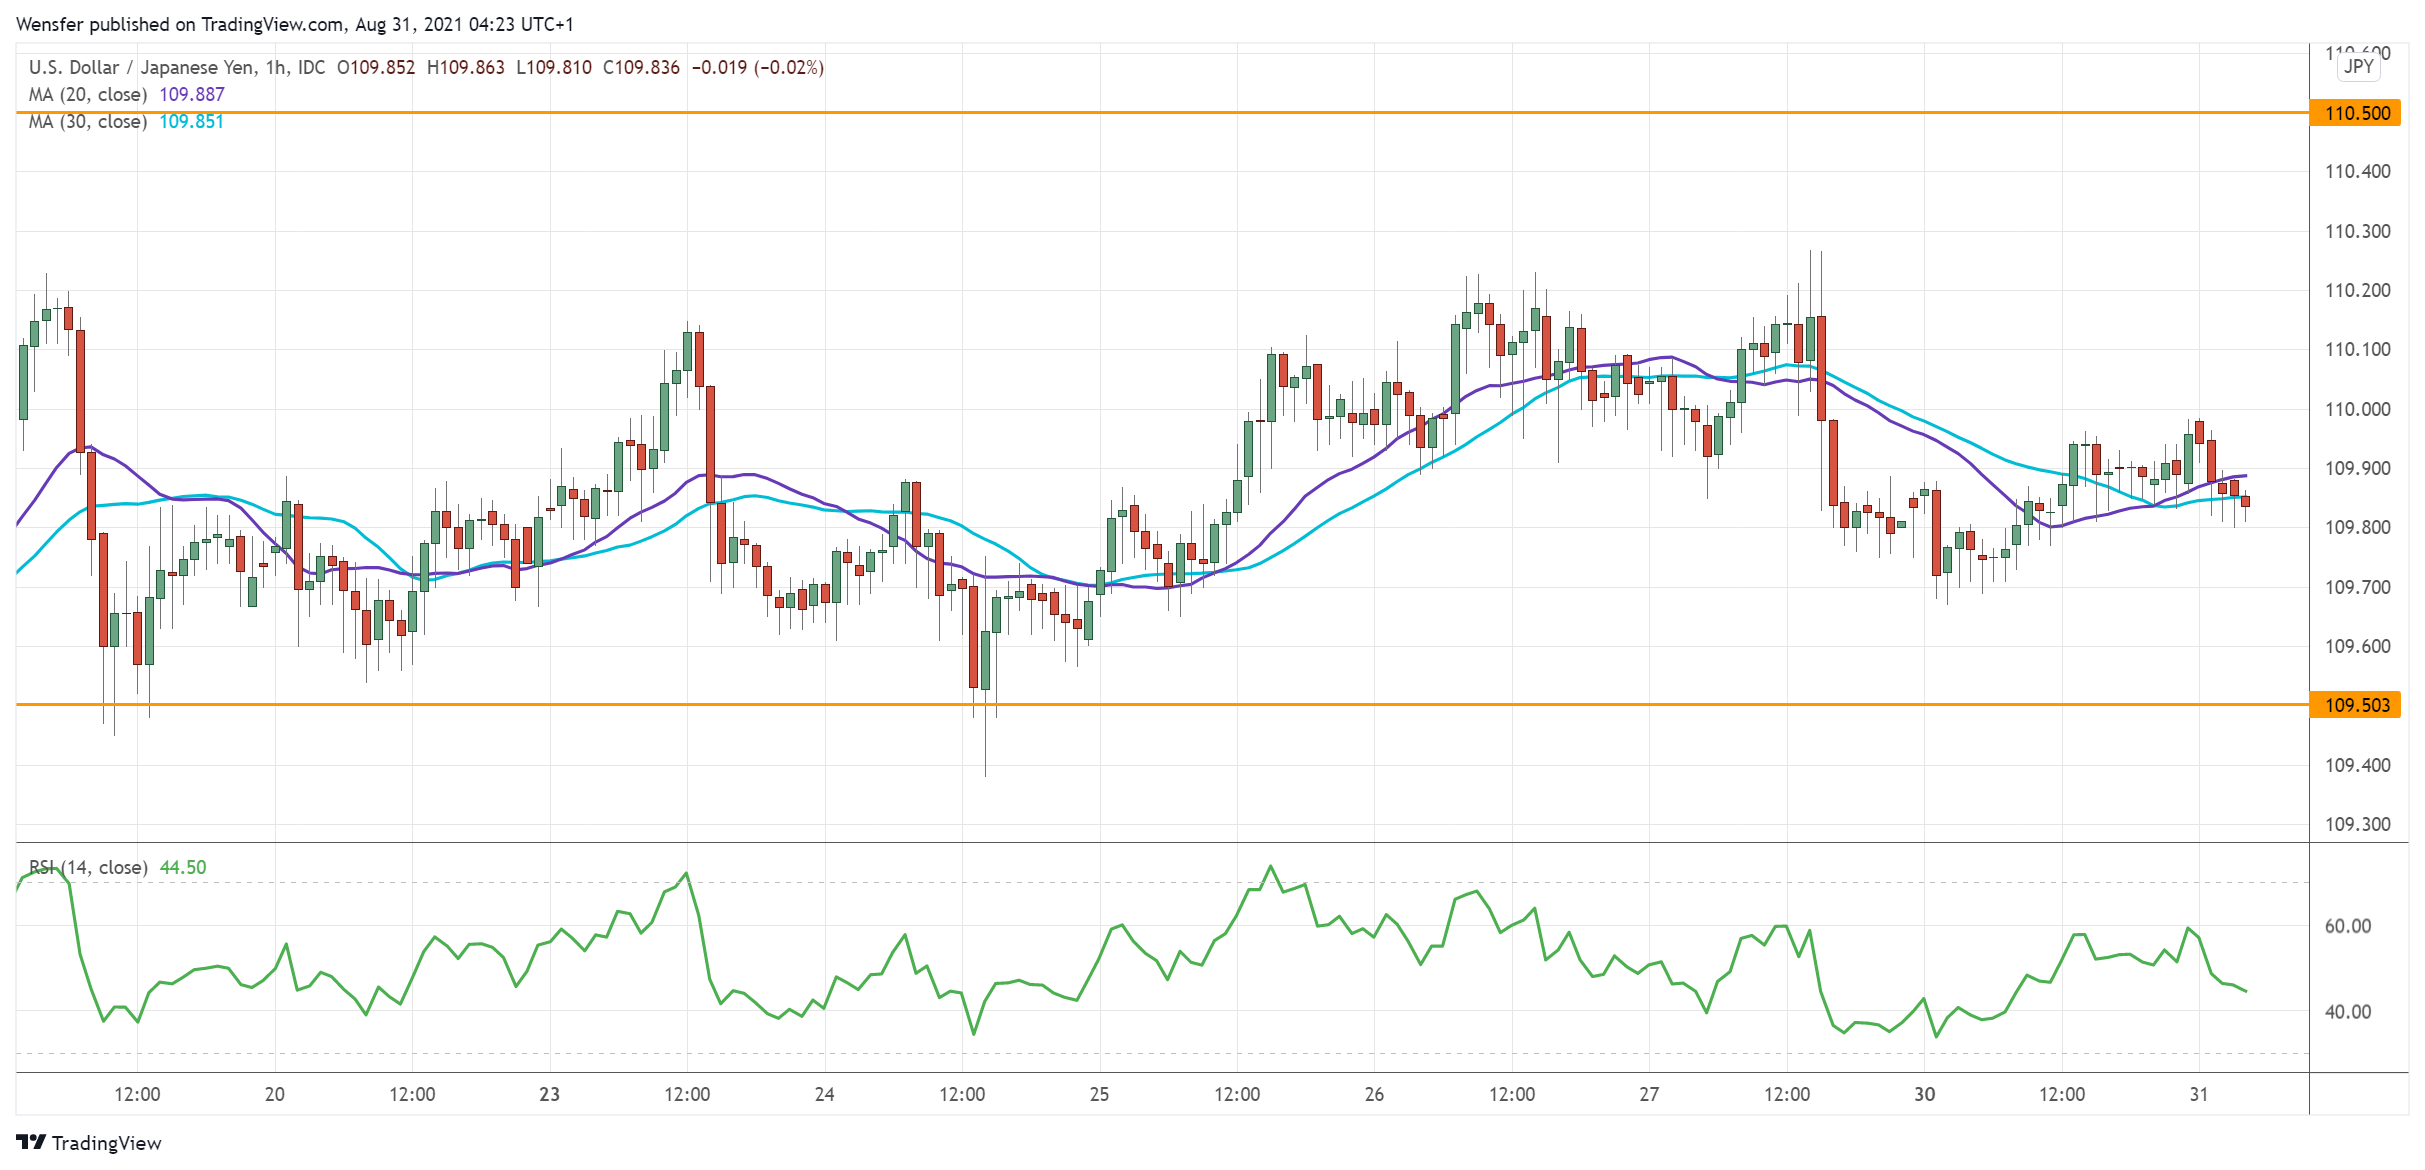
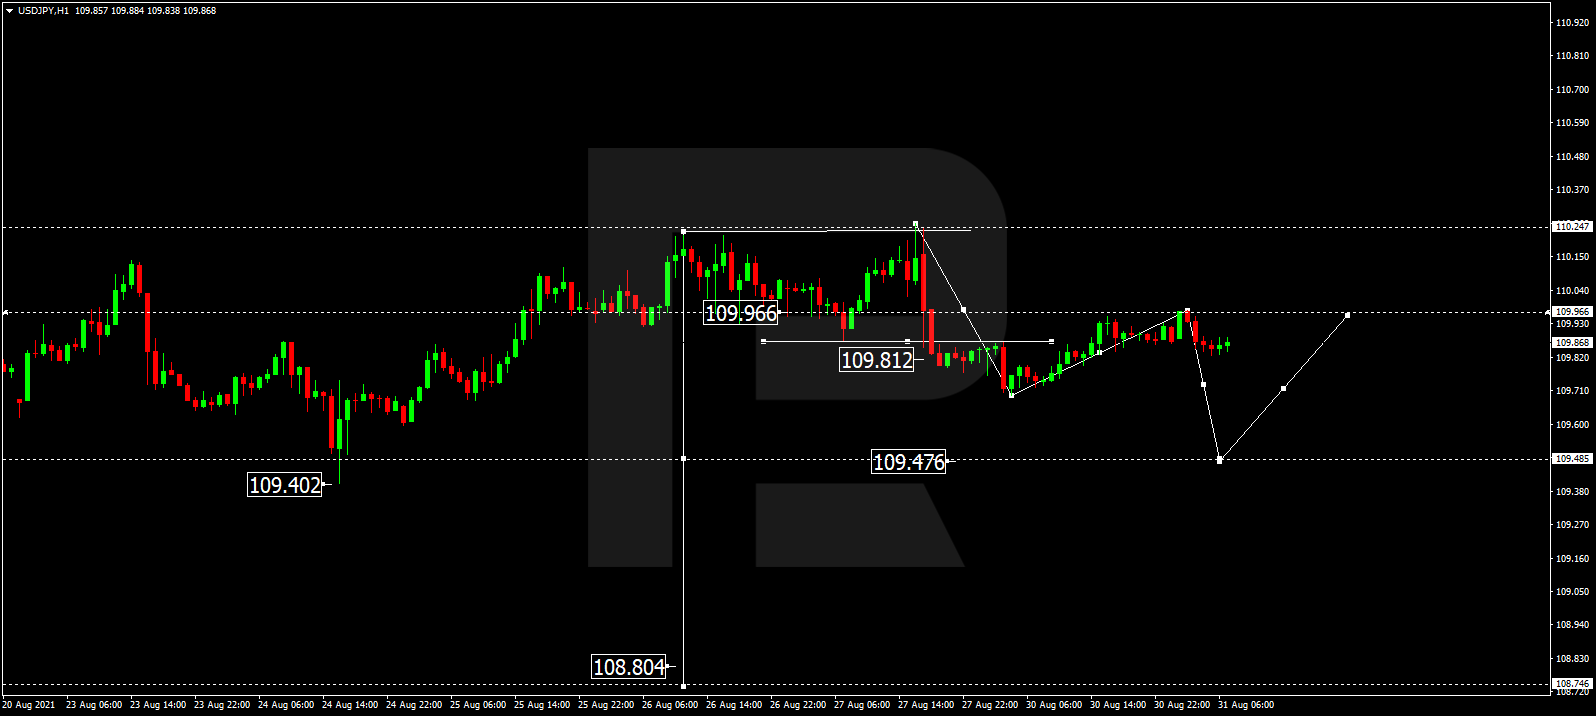
USDJPY is still consolidating around 109.80. Possibly, today the pair may form a new descending structure to break 109.47 and then continue moving within the downtrend with the short-term target at 108.80.

USDJPY
Risk Warning: the result of previous trading operations do not guarantee the same results in the future

USDCHF, “US Dollar vs Swiss Franc”

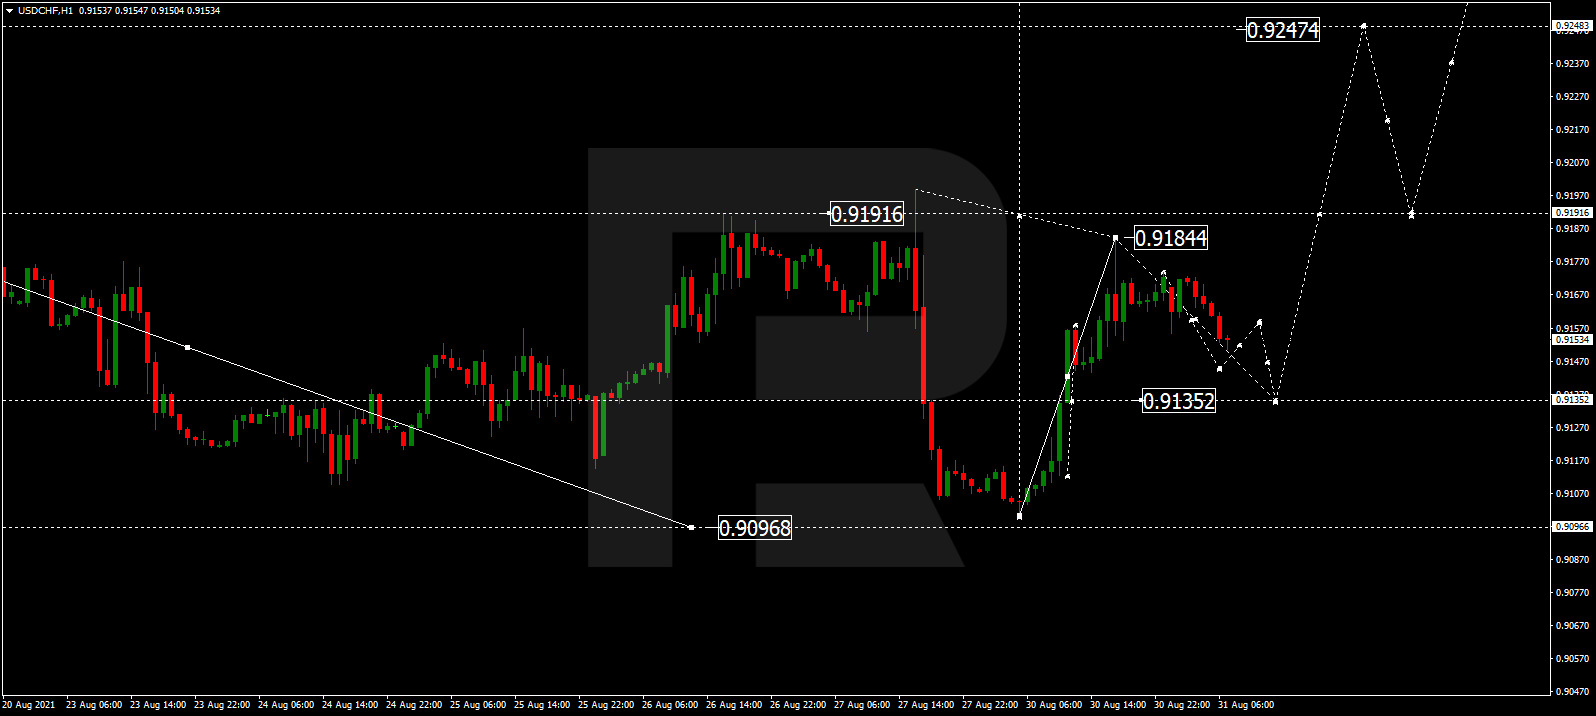
After finishing the ascending impulse at 0.9184, USDCHF is correcting towards 0.9135. After that, the instrument may form one more ascending structure to break 0.9200 and then continue trading upwards with the target at 0.9250.

USDCHF
Risk Warning: the result of previous trading operations do not guarantee the same results in the future

AUDUSD, “Australian Dollar vs US Dollar”

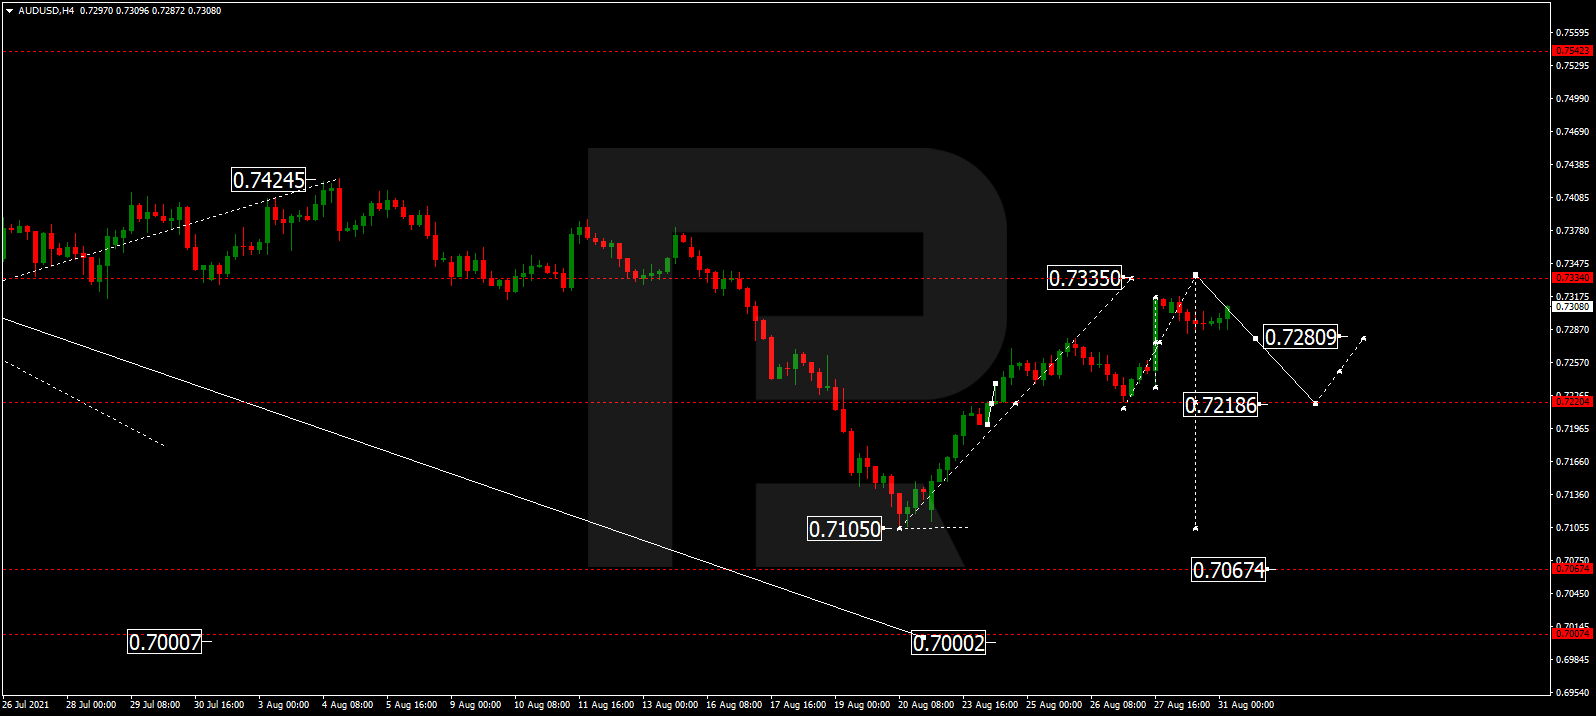
AUDUSD is growing towards 0.7335 and may later start a new decline to reach 0.7218. After that, the instrument may grow towards 0.7280 and consolidate there. If the price breaks this range to the downside, the market may resume trading within the downtrend with the target at 0.7070.

AUDUSD
Risk Warning: the result of previous trading operations do not guarantee the same results in the future

BRENT

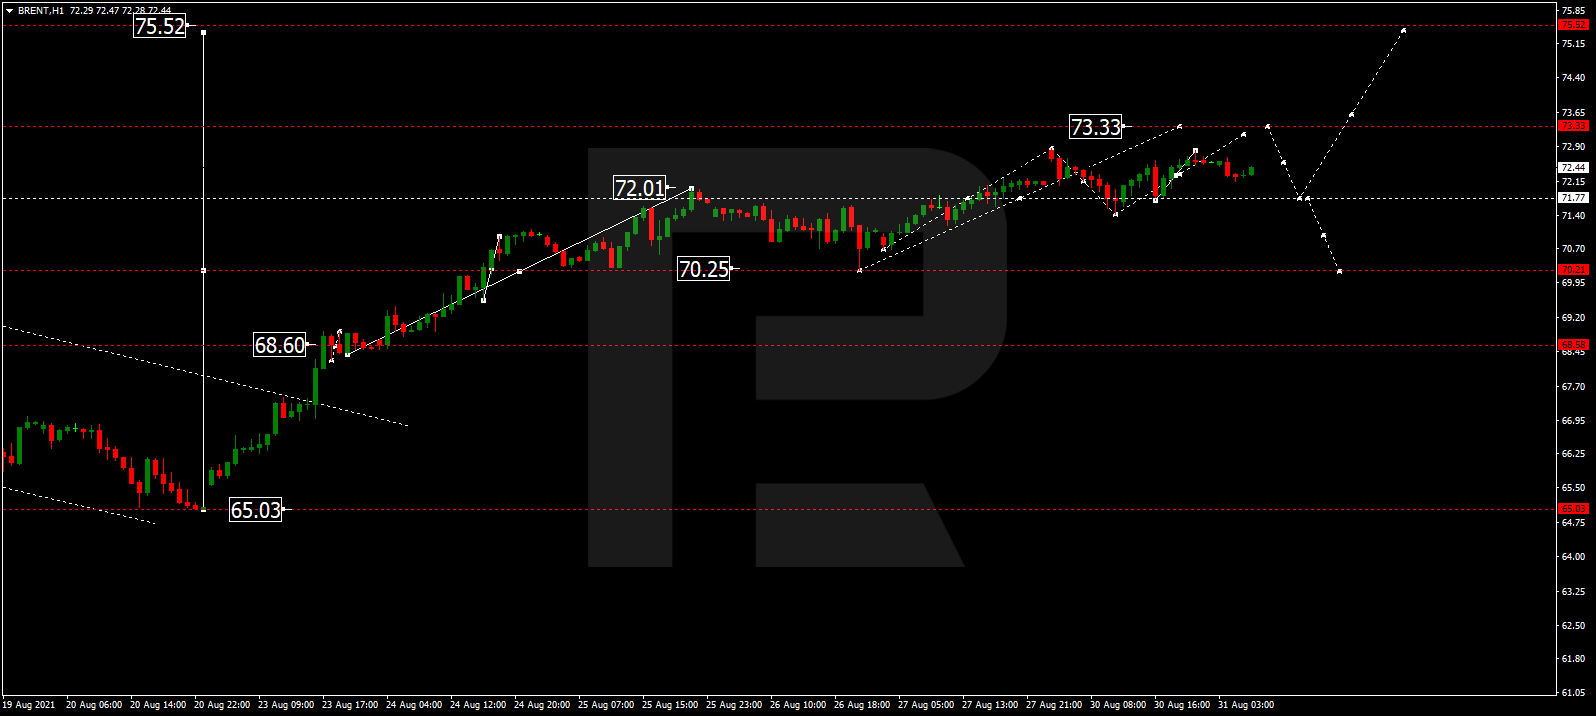
After rebounding from 72.00, Brent is growing towards 73.33. Later, the market may form a new descending structure to break 72.00 and then correct with the target at 70.25. After that, the instrument may start another growth to reach 75.55.

BRENT
Risk Warning: the result of previous trading operations do not guarantee the same results in the future

XAUUSD, “Gold vs US Dollar”

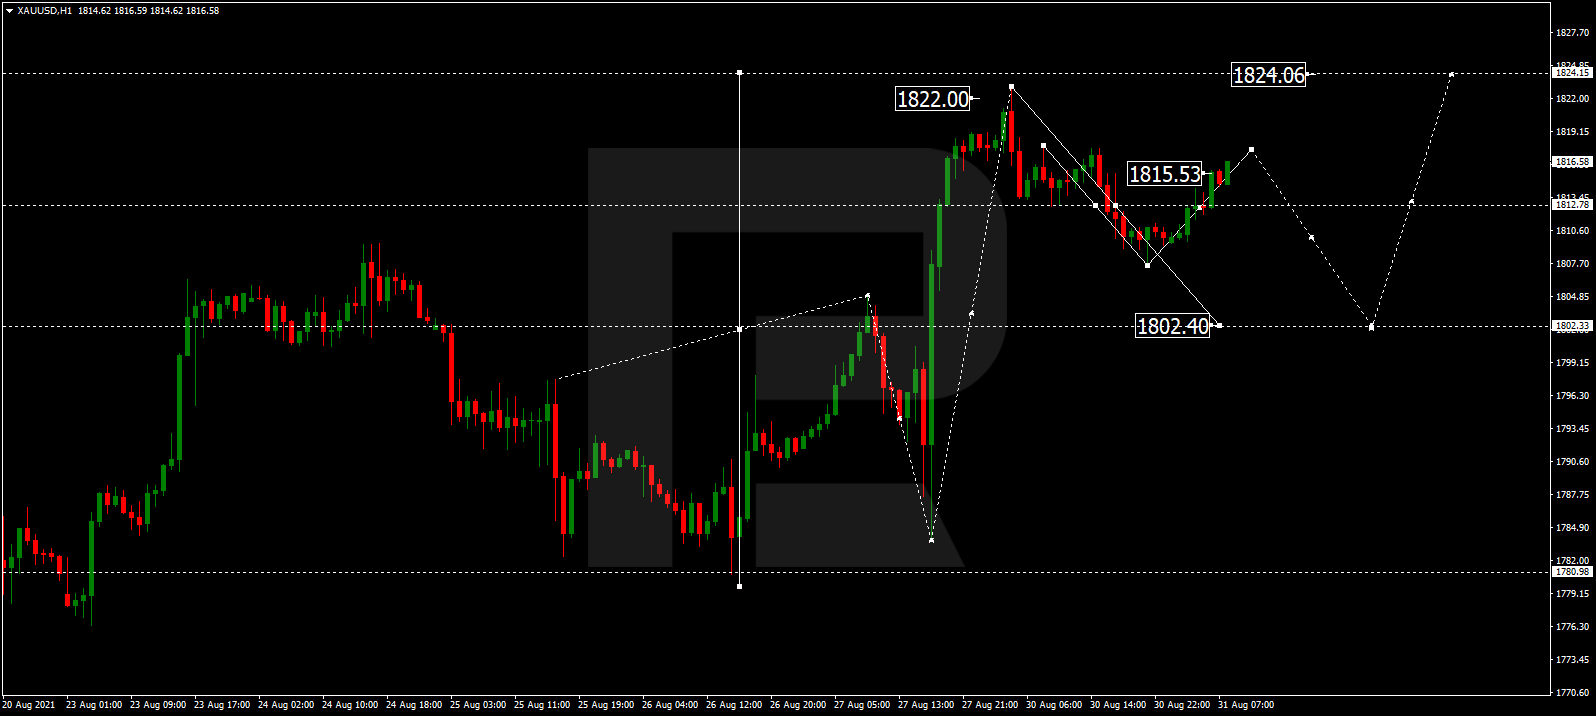
Gold is consolidating around 1812.66. Possibly, today the metal may correct to test 1802.40 from above and then resume trading upwards with the target at 1824.00.

GOLD
Risk Warning: the result of previous trading operations do not guarantee the same results in the future

S&P 500

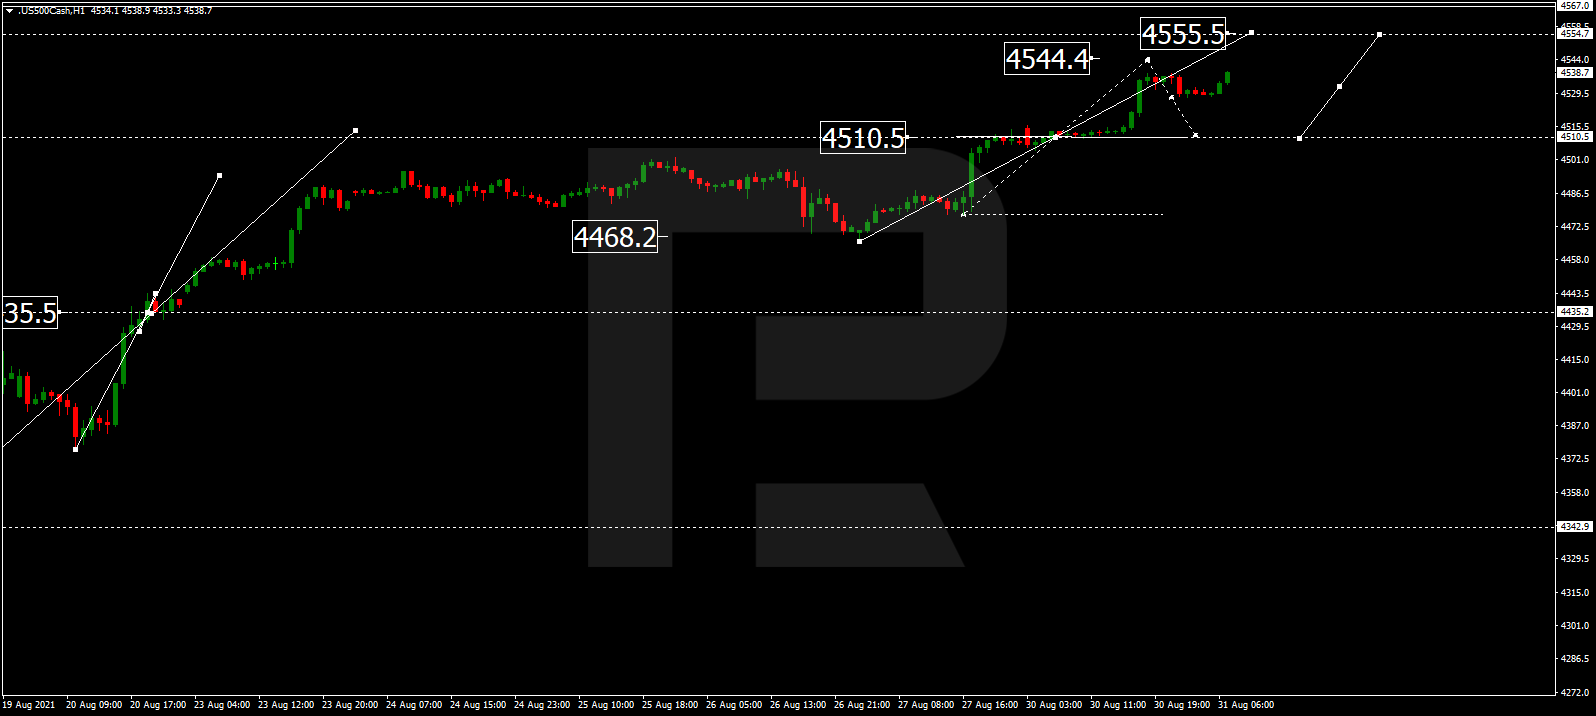
The S&P index is growing towards 4544.4 and may later start a new correction to reach 4510.5. After that, the instrument may form one more ascending structure towards 4555.5 and consolidate there. If the price breaks this range to the downside, the asset may start another correction with the target at 4435.0.

S&P500

Article By RoboForex.com

Attention!
Forecasts presented in this section only reflect the author’s private opinion and should not be considered as guidance for trading. RoboForex LP bears no responsibility for trading results based on trading recommendations described in these analytical reviews.

The Analytical Overview of the Main Currency Pairs on 2021.08.31

by JustForex

The EUR/USD currency pair

Technical indicators of the currency pair:
  • Prev Open: 1.1792
  • Prev Close: 1.1796
  • % chg. over the last day: +0.03%

In Germany, inflation jumped to a 13-year high of 3.4%. Companies are struggling with supply shortages, which is putting pressure on prices. Other European countries will also report on the level of inflation today. Economists expect consumer prices to reach 2.7% on a year-on-year basis in Europe, which is significantly higher than the 2% target of the ECB.

Trading recommendations
  • Support levels: 1.1799, 1.1759, 1.1704, 1.1620
  • Resistance levels: 1.1817, 1.1854, 1.1894, 1.1934, 1.1969

From a technical point of view, the general trend of the EUR/USD currency pair is bearish. But the price is trading above the moving average and has approached the priority change level. The MACD is signaling a divergence in the opposite direction. Under such market conditions, it is best to look for sell trades from the resistance levels, where sellers show initiative. Buy trades can be considered only after a pullback or after a breakthrough of the priority change level.

Alternative scenario: if the price breaks through the 1.1817 resistance level and fixes above, the mid-term uptrend will likely resume.

EUR/USD
News feed for 2021.08.31:
  • – Germany Unemployment Rate (m/m) at 10:55 (GMT+3);
  • – Eurozone Consumer Price Index (m/m) at 12:00 (GMT+3);
  • – US CB Consumer Confidence (m/m) at 17:00 (GMT+3).

The GBP/USD currency pair

Technical indicators of the currency pair:
  • Prev Open: 1.3755
  • Prev Close: 1.3756
  • % chg. over the last day: +0.01%

There was a bank holiday in the UK yesterday, so the pound sterling maintained its position amid the stabilization of the dollar index. Today, at the opening of trading, the dollar index is slightly decreasing, which plays in favor of the British currency strengthening. But the divergence on the technical indicators shows that there is a possibility of a temporary decline.

Trading recommendations
  • Support levels: 1.3741, 1.3692, 1.3632, 1.3614, 1.3525
  • Resistance levels: 1.3793, 1.3772, 1.3886, 1.3935, 1.4002

On the hourly time frame, the GBP/USD trend is bearish but the price is trading above the moving average; the local trend is upward. The MACD indicator became positive, but there is a divergence on the higher timeframe, which indicates an impending downward movement. Under such market conditions, it is better to look for sell trades from the resistance level, where sellers show initiative. Buy positions can be considered only with short targets throughout the day.

Alternative scenario: if the price breaks through the 1.3885 resistance level and consolidates above, the bullish scenario will likely resume.

GBP/USD
There is no news feed for today.

The USD/JPY currency pair

Technical indicators of the currency pair:
  • Prev Open: 109.80
  • Prev Close: 109.91
  • % chg. over the last day: +0.10%

Japan’s unemployment rate fell to 2.8% (previous – 2.9%). But industrial production decreased in July, which is not surprising since the surge of the Delta strain made the government introduce restrictions that caused interruptions in supply chains, especially semiconductor products and components for automakers.

Trading recommendations
  • Support levels: 109.43, 109.19, 108.65
  • Resistance levels: 110.11, 110.34, 110.66, 110.95, 111.48

The main trend of the USD/JPY currency pair is bullish. The price is now trading in a wide corridor with the range of 109.43-110.11, inside which other smaller fled structures are formed. The MACD indicator has become inactive again. Under such market conditions, traders should look for buy trades from the support level, where the buyers show initiative. Sell positions should be considered only on lower timeframes from the resistance levels with short targets.

Alternative scenario: if the price falls below 109.18, the uptrend is likely to be broken.

USD/JPY
News feed for 2021.08.31:
  • – Japan Unemployment Rate (m/m) at 02:30 (GMT+3);
  • – Japan Industrial Production (m/m) at 02:50 (GMT+3).

The USD/CAD currency pair

Technical indicators of the currency pair:
  • Prev Open: 1.2615
  • Prev Close: 1.2604
  • % chg. over the last day: -0.09%

The Canadian dollar is a commodity currency, so the USD/CAD currency pair is highly dependent on the dynamics of the dollar index and oil prices. The dollar index is slowly decreasing, while oil is increasing. As a result, the USD/CAD currency pair is declining, which increases the probability of priority change. Canada will report its GDP for the quarter today.

Trading recommendations
  • Support levels: 1.2602, 1.2554
  • Resistance levels: 1.2656, 1.2713, 1.2812, 1.2891, 1.2951

In terms of technical analysis, the USD/CAD trend is still bullish but the price returned to the priority change level. The probability of a breakthrough of the support level is increasing. It is better to look for buy positions from the priority change level but after buyers show initiative. Sell positions can be considered from the resistance levels, or after the breakthrough of the 1.2602 support level.

Alternative scenario: if the price breaks through the 1.2602 support level and fixes below, the uptrend will likely be broken.

USD/CAD
There is no news feed for today.

by JustForex


This article reflects a personal opinion and should not be interpreted as an investment advice, and/or offer, and/or a persistent request for carrying out financial transactions, and/or a guarantee, and/or a forecast of future events.