Join Chris as he talks about the energy sector coming to life recently. Energy stocks are starting on a verge of a break out to the upside this week.
Subscribers to any service at The Technical Traders: Please let us know via a member ticket what you would like to learn about and we will do our best to make sure this happens.
Non-subscribers: Please enjoy these micro-lessons as a way to further your education and understanding of how a technical trader…well…trades!
CLICK ON THE IMAGE BELOW TO WATCH THE VIDEO
TO EXPLORE THE DIFFERENT TRADING STRATEGIES CHRIS OFFERS, PLEASE VISIT US AT THE TECHNICAL TRADERS. YOU’VE GOT MORE TO GAIN THAN TO LOSE WHEN SEEKING INFORMATION!
– Disney (DIS) has been the sweet spot of capitalizing on the pent-up post-pandemic consumer wave of travel and spending while being the new and preferred stay-at-home content provider via Disney Plus. Over the past couple of years, Disney has rolled out and refined its wildly successful array of streaming initiatives that catered to the stay-at-home economy during the pandemic. These streaming efforts have transformed Disney’s business model, which its legacy businesses will further bolster as the world economy prospects continue to improve and reopen. Taken together, Disney has set itself up to benefit across the board with its streaming initiatives firing on all cylinders and theme parks coming back online. The company has been posting phenomenal streaming numbers that have negated the negative pandemic impact on its theme parks. This streaming-specific narrative will change as the theme park revenue comes back online and flows into the company’s earnings. Due to the tremendous success of Disney Plus, the company is now flexing its pricing power muscle and put through pricing increases on its streaming platform. This pricing power speaks to the value of Disney Plus as a standalone streaming platform while expanding its margins on this new business vertical. Disney presents a compelling buy for long-term investors as its legacy business segments get back online in conjunction with its wildly successful streaming initiatives, all of which have more pricing power down the road.
Pricing Power Flexing
Disney recently pushed through another price increase on its monthly subscription tier for its Hulu offerings. This is on top of price increases that it pushed through on its Disney Plus subscription earlier this year. Clearly, the Disney streaming platforms possess pricing power as the adoption of these steaming properties by consumers becomes more widespread. Part and parcel with these price increases is margin expansion and increased revenue. Disney has forecasted that its Disney Plus streaming platform will have up to 260 million subscribers by 2040. Thus, even marginal price increases will translate into meaningful revenue windfalls for the years to come.
Streaming and Theme Park Synergy
The company continues to exceed all expectations in the streaming space accelerated by the stay-at-home pandemic backdrop. Disney’s streaming initiatives have been major growth catalysts for the company. Disney+ growth in its subscriber base has shifted the conversation from pandemic impact on its theme parks to a durable and sustainable recurring revenue model. This streaming bright spot in conjunction with its park and resorts coming back online has been a perfect combination as of late, especially with widespread vaccinations. Disney+ has racked up 94.9 million paid subscribers, Hulu has 39.4 million paid subscribers, and ESPN+ has 12.1 million paid subscribers. Collectively, Disney (DIS) now has over 146 million paid streaming subscribers across its platforms. Disney+ has been wildly successful via unleashing all its Marvel, Star Wars, Disney, and Pixar libraries in what has become a formidable competitor in the ever-expanding streaming wars domestically and internationally. Hence Disney’s stock performance during the pandemic as its theme parks was shuttered.
Post-Pandemic and Box Office
Disney’s business segments are coming back online as the pandemic subsides worldwide with widespread vaccinations. Even the Box Office is showing life with Disney’s successful post-pandemic releases of Black Window and Shang-Chi. Disney’s theme parks are reopening, as seen with phased reopening efforts and mask mandates being lifted. Inevitably, movie productions will resume, movie theaters and theme parks will reopen to full capacity, and sports will return to pre-pandemic formats. The resumption of these activities will feed into Disney’s legacy businesses in conjunction with its massive streaming successes. Disney continues to dominate the box office year after year with a long pipeline of blockbusters in the queue. Its parks and resorts continue to be a growth avenue with tremendous pricing power. In addition, Disney is going all-in on the streaming front and acquired full ownership of Hulu, and the company has launched its Disney+ streaming service with tremendous success.
Conclusion
Disney (DIS) has successfully shifted its business model to a subscription-based service that produces a durable, sustainable, and predictable revenue stream via its streaming initiatives. These streaming properties possess tremendous pricing power over the years to come. As a result, the company has shifted the narrative from pandemic challenges to a focus on becoming a streaming juggernaut with over 146 million paid subscribers across its various platforms. Against the backdrop, its legacy business segments are ready to regain their footing as the pandemic subsides via widespread vaccinations. We have already seen the box office come alive with Disney’s Black Widow and Chung-Chi successes. All the initiatives that Disney has taken over the previous few years to remediate its business and restore growth appear to be coming to fruition via its Fox acquisition and its streaming initiatives. Disney continues to invest heavily into its streaming services (Hulu, ESPN Plus, and Disney+) to propel its growth and dominance in the streaming space. The company is evolving to meet the new age of media consumption demands via streaming and on-demand content. Disney’s streaming initiatives will continue to be major growth catalysts moving forward. Disney is a compelling buy as its legacy theme park business comes back online in conjunction with its streaming initiatives.
Disclosure: The author holds shares in AAPL, AMZN, DIA, GOOGL, JPM, MSFT, QQQ, SPY, and USO. He may engage in options trading in any of the underlying securities. The author has no business relationship with any companies mentioned in this article. He is not a professional financial advisor or tax professional. This article reflects his own opinions. This article is not intended to be a recommendation to buy or sell any stock or ETF mentioned. Kiedrowski is an individual investor who analyzes investment strategies and disseminates analyses. Kiedrowski encourages all investors to conduct their own research and due diligence prior to investing. Please feel free to comment and provide feedback, the author values all responses. The author is the founder of www.stockoptionsdad.com where options are a bet on where stocks won’t go, not where they will. Where high probability options trading for consistent income and risk mitigation thrives in both bull and bear markets. For more engaging, short duration options based content, visit stockoptionsdad’s YouTube channel.
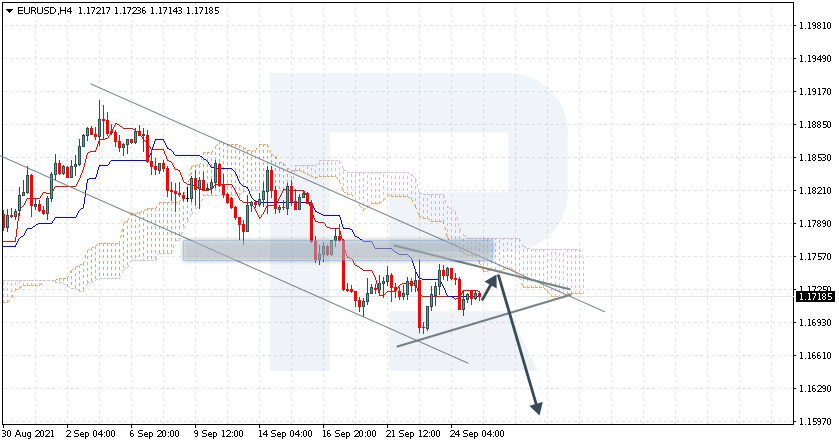
EURUSD is trading at 1.1718; the instrument is moving below Ichimoku Cloud, thus indicating a descending tendency. The markets could indicate that the price may test the cloud’s downside border at 1.1730 and then resume moving downwards to reach 1.1595. Another signal in favor of a further downtrend will be a rebound from the descending channel’s upside border. However, the bearish scenario may no longer be valid if the price breaks the cloud’s upside border and fixes above 1.1805. In this case, the pair may continue growing towards 1.1905. To confirm further decline, the asset must break the downside border of the Triangle pattern and fix below 1.1680.
AUDUSD, “Australian Dollar vs US Dollar”
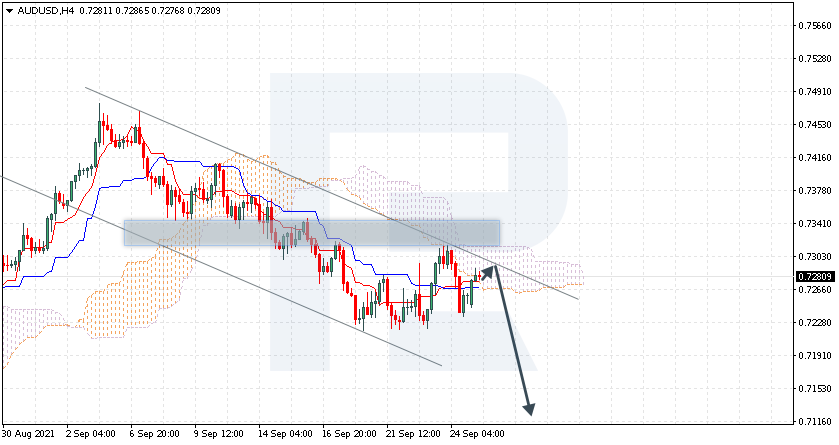
AUDUSD is trading at 0.7280; the instrument is moving inside Ichimoku Cloud, thus indicating a sideways tendency. The markets could indicate that the price may test the cloud’s upside border at 0.7290 and then resume moving downwards to reach 0.7115. Another signal in favor of a further downtrend will be a rebound from the descending channel’s upside border. However, the bearish scenario may no longer be valid if the price breaks the cloud’s upside border and fixes above 0.7350. In this case, the pair may continue growing towards 0.7445.
NZDUSD, “New Zealand Dollar vs US Dollar”
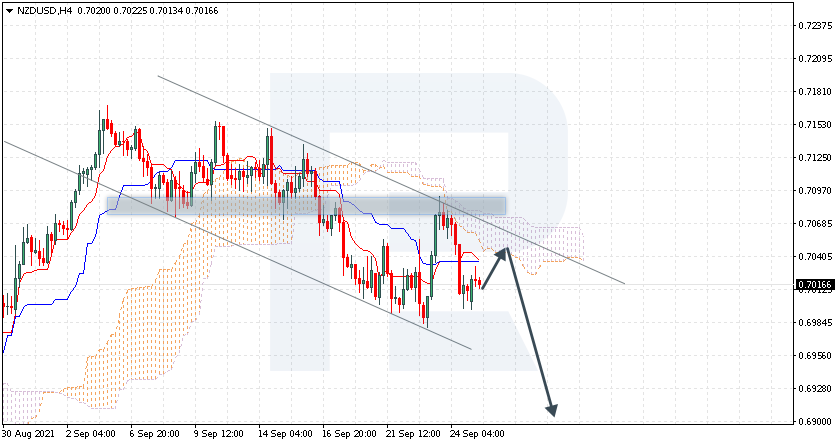
NZDUSD is trading at 0.7016; the instrument is moving below Ichimoku Cloud, thus indicating a descending tendency. The markets could indicate that the price may test the cloud’s downside border at 0.7040 and then resume moving downwards to reach 0.6905. Another signal in favor of a further downtrend will be a rebound from the descending channel’s upside border. However, the bearish scenario may no longer be valid if the price breaks the cloud’s upside border and fixes above 0.7095. In this case, the pair may continue growing towards 0.7185.
Attention! Forecasts presented in this section only reflect the author’s private opinion and should not be considered as guidance for trading. RoboForex LP bears no responsibility for trading results based on trading recommendations described in these analytical reviews.
As anticipated, the German federal election results came in with a narrow plurality for the center-left SDP party.
This is the closest result in history, suggesting that it will be the most difficult coalition negotiation as well. Some estimate the government negotiations to last until even Christmas. This means that Merkel could remain Chancellor for several more months.
Markets, then again, might not be so happy with the uncertainty.
The narrow results have allowed for a wide range of interpretations. Some media headlines announced that Germans demanded change, while others proclaimed Germans voted for continuity.
Thankfully, the major concern for the markets has been averted. In fact, they avoided a hard-left coalition of SPD, Linke, and Greens, who would have taken the government reins, and pushed up taxes and increased regulations.
Where to now?
Although Schultz’s SPD gained the most votes, the left-leaning parties failed to obtain an overall majority.
This means the center-right, and Merkel’s successor, Laschet of the CDU will try to form a “Jamaica” coalition, of CDU, plus liberal FDP and the Greens. That had been attempted before, but talks broke down as the pro-business FDP and pro-environment Greens could not agree on a platform.
Last time, the “escape valve” was to return to an CDU-SPD “grand coalition”. However, that option is not on the table anymore, since the sum of votes from both parties does not equal a majority either. This allows for alternatives of a “grand coalition” with the FDP or the Greens.
Nonetheless, given the political costs that the “grand coalition” implies for both parties, this could generally be a very distant, and last resort alternative.
Out of the two options, however, an CDU-SPD-FDP alliance is the less impossible one. The FDP has been in government before and has a more pragmatic approach than the other “minor” parties.
What about the people?
The uncertainty in the government provides uncertainty in the market. This is particularly in terms of where regulatory pressures and tax increases will lie. That said, it might leave many businesses on hold in terms of investing, providing a slight drag on the economy for the next couple of months.
On the other hand, consumers generally won’t really change their habits because of the election. That doesn’t mean it’s good news though, as Germany heads into autumn and worries about covid still persist.
Tomorrow we have the release of GfK Consumer Confidence, which analysts expect to move further negative to -1.8 from -1.2 in August. Unfortunately, this measure of consumer sentiment never recovered from the pandemic.
Regulatory reaction
Later in the day, analysts anticipate ECB’s Lagarde to give a speech in the bank’s Central Banking Forum. In fact, they will be going over her remarks with a fine-tooth comb looking for hints about future rate policy.
However, with the largest economy in Europe in somewhat of a regulatory limbo until they decide on the coalition, the ECB is likely to have ample room to keep monetary policy easing in place.
In turn, this might make the regulators’ job easier because there is less inflation. The problem is that less inflation is because of lower growth.
Orbex is a fully licensed broker that was established in 2011. Founded with a mission to serve its traders responsibly and provides traders with access to the world’s largest and most liquid financial markets. www.orbex.com
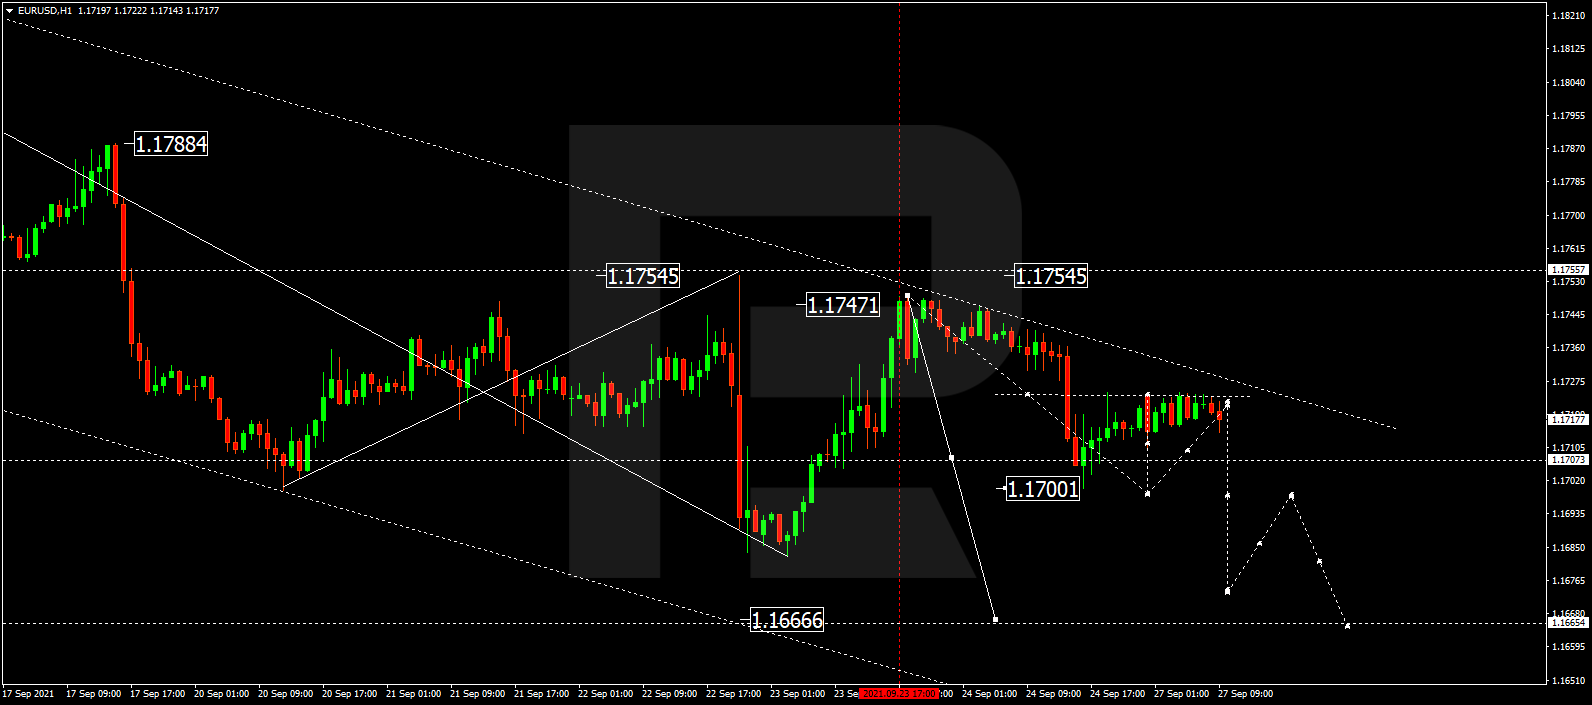
EURUSD continues trading downwards; it has already completed the descending structure at 1.1700 along with the correction towards 1.1724. Possibly, today the pair may fall to reach 1.1698 and then start a new correction towards 1.1707. Later, the market may resume falling with the target at 1.1666.
GBPUSD, “Great Britain Pound vs US Dollar”
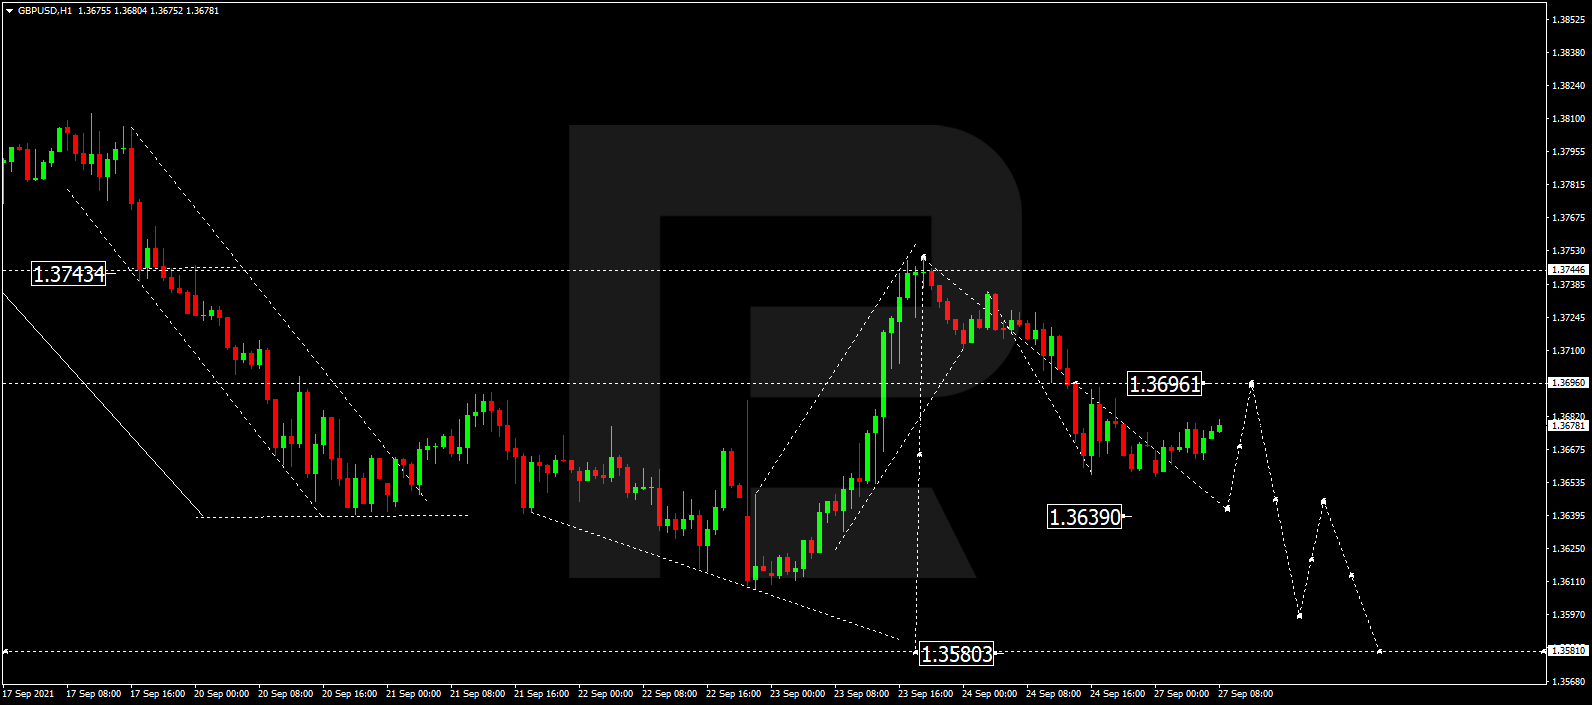
GBPUSD is still falling; it has already finished the descending structure at 1.3660 along with the correction towards 1.3696. Today, the pair may fall to reach 1.3639 and then start another correction to return to 1.3696. After that, the instrument may form a new descending structure with the target at 1.3580.
USDRUB, “US Dollar vs Russian Ruble”
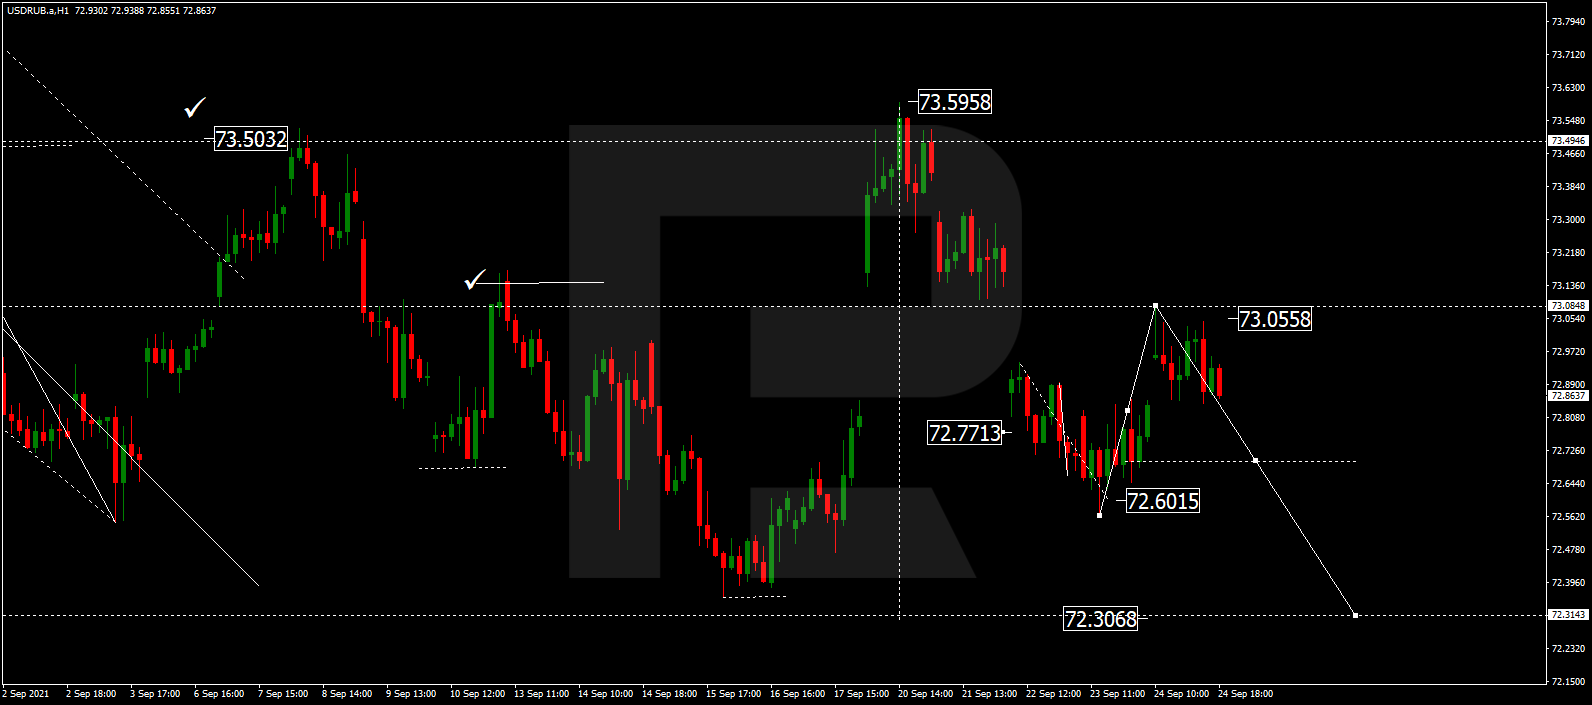
USDRUB has completed the correction at 73.00. Possibly, the pair may start a new decline to break 72.60 and then continue trading downwards with the target at 72.30.
USDJPY, “US Dollar vs Japanese Yen”
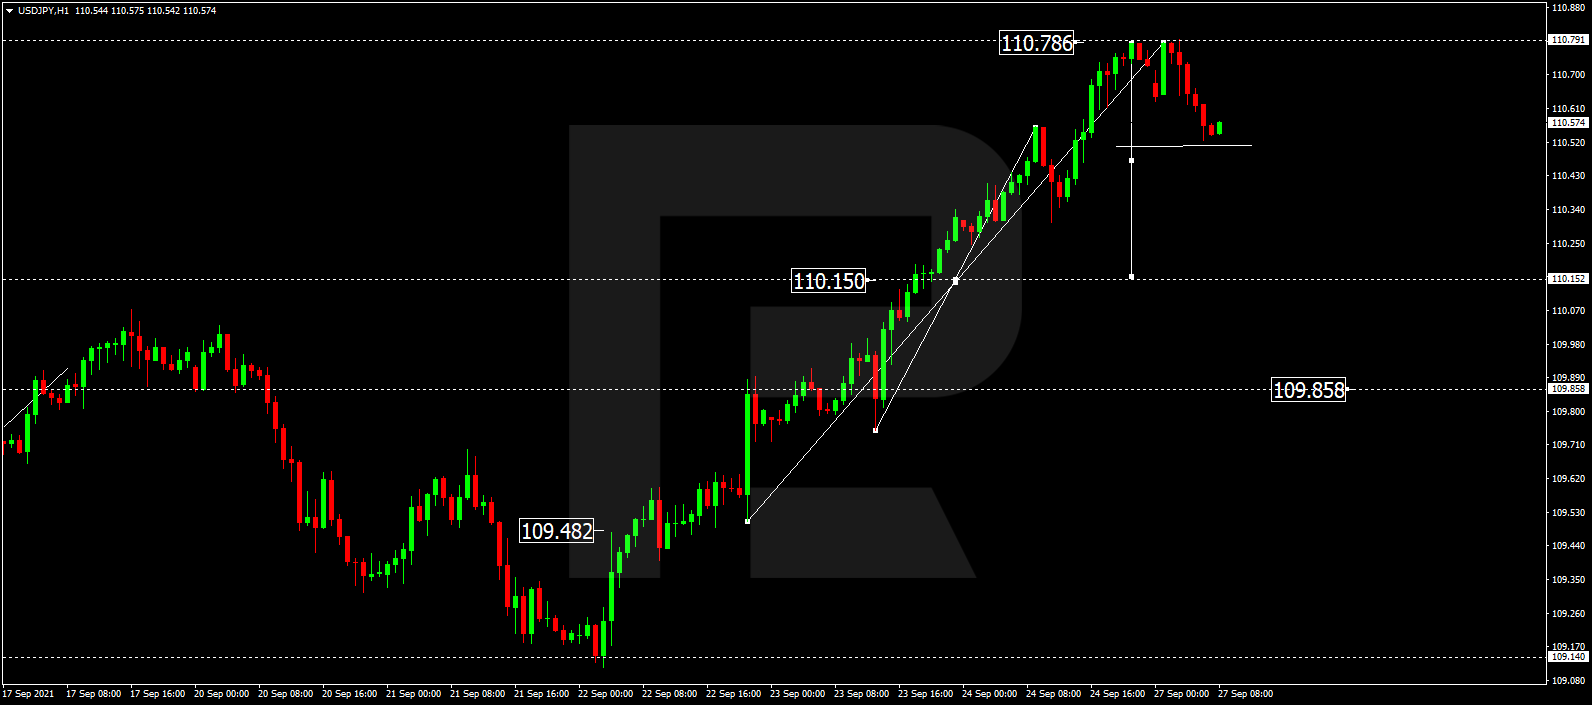
After finishing one more ascending structure at 110.78, USDJPY is expected to correct and reach 110.15. After that, the instrument may start another growth towards 110.40 and then resume falling with the target at 109.85.
USDCHF, “US Dollar vs Swiss Franc”
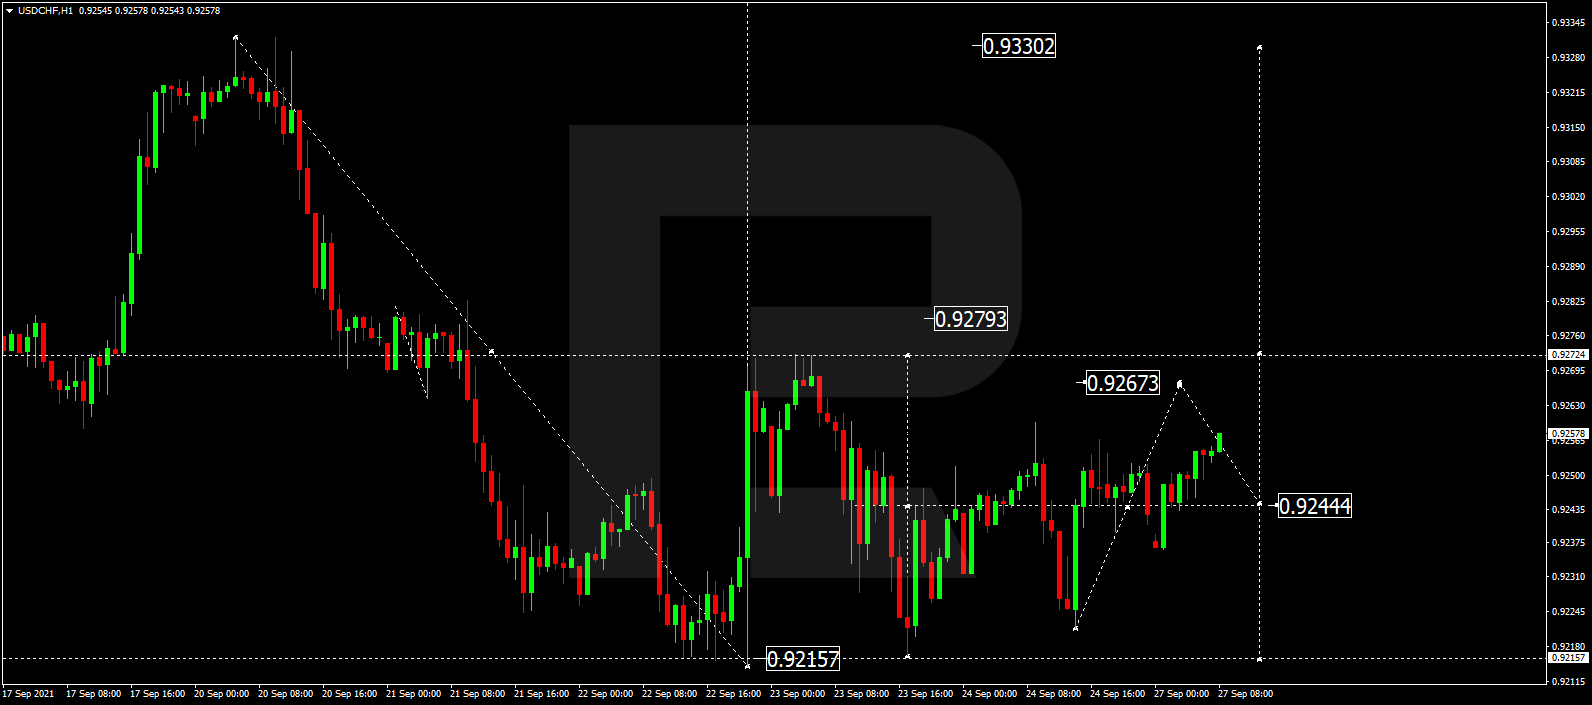
USDCHF is growing towards 0.9279. Later, the market may start a new correction to reach 0.9244 and then and resume trading within the uptrend with the target at 0.9330.
AUDUSD, “Australian Dollar vs US Dollar”
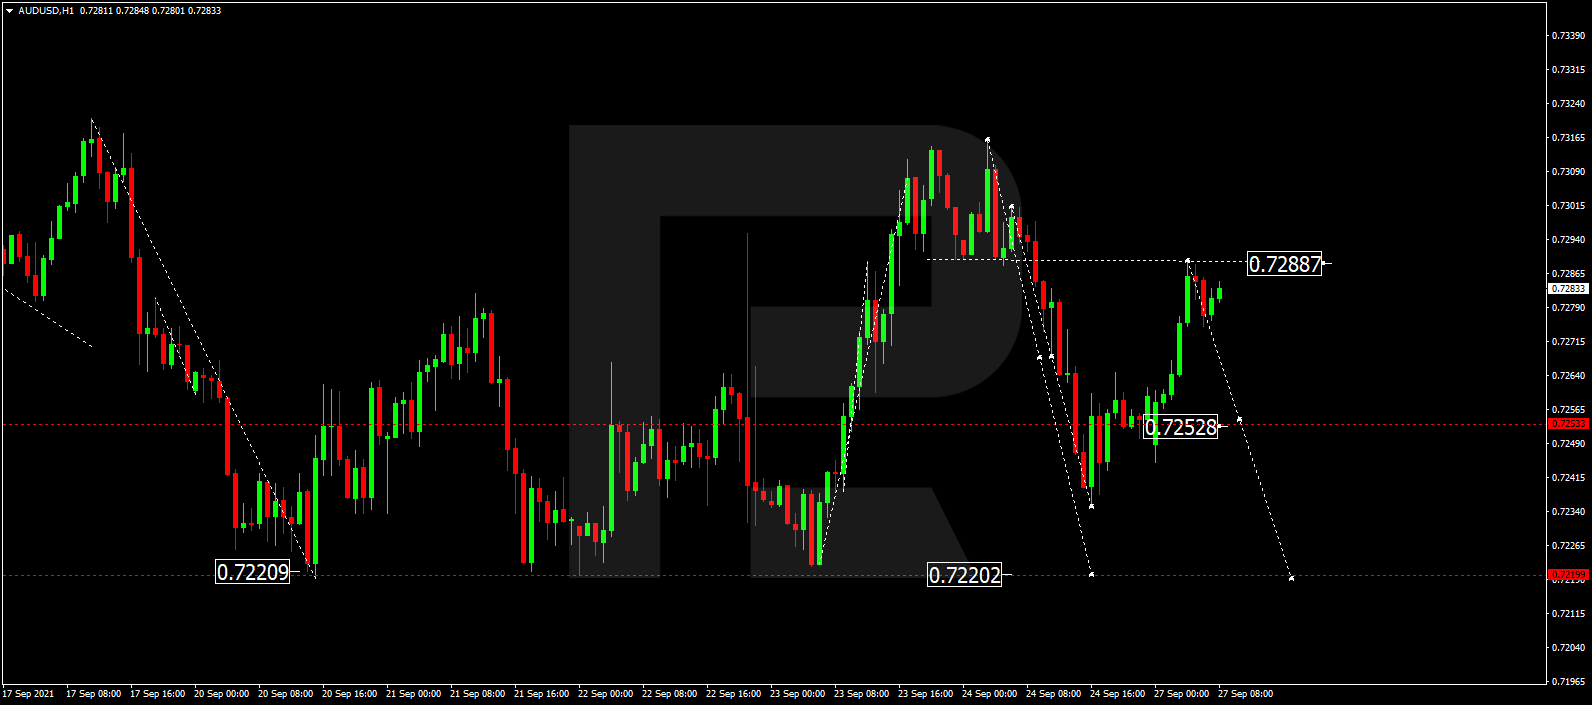
AUDUSD has completed the descending structure at 0.7235 along with the correction towards 0.7288. Possibly, today the pair may resume trading within the downtrend with the target at 0.7220.
BRENT
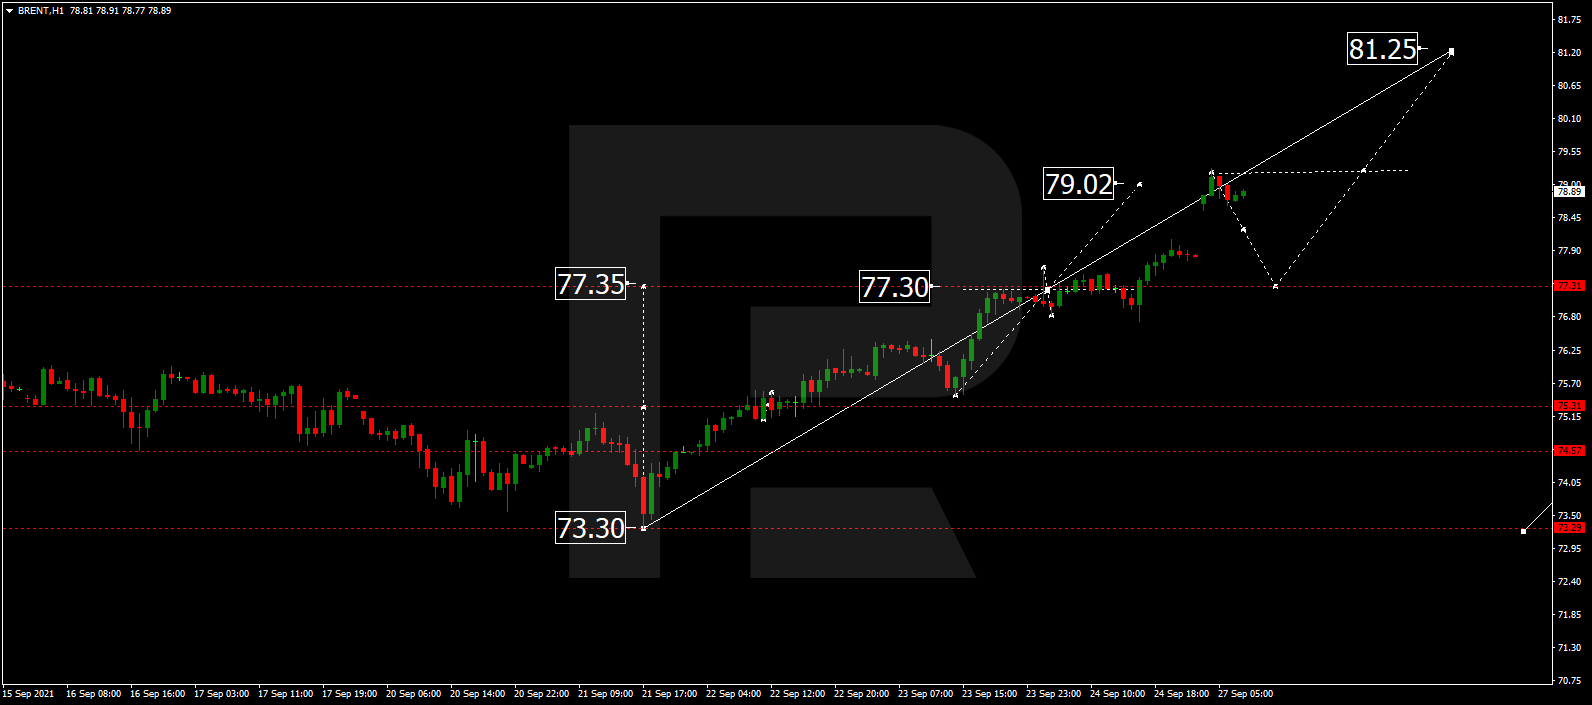
After completing the ascending wave at 79.02, Brent is consolidating there. Possibly, the asset may break the range to the downside and start a new correction towards 77.30. Later, the market may form one more ascending structure with the target at 81.25.
XAUUSD, “Gold vs US Dollar”
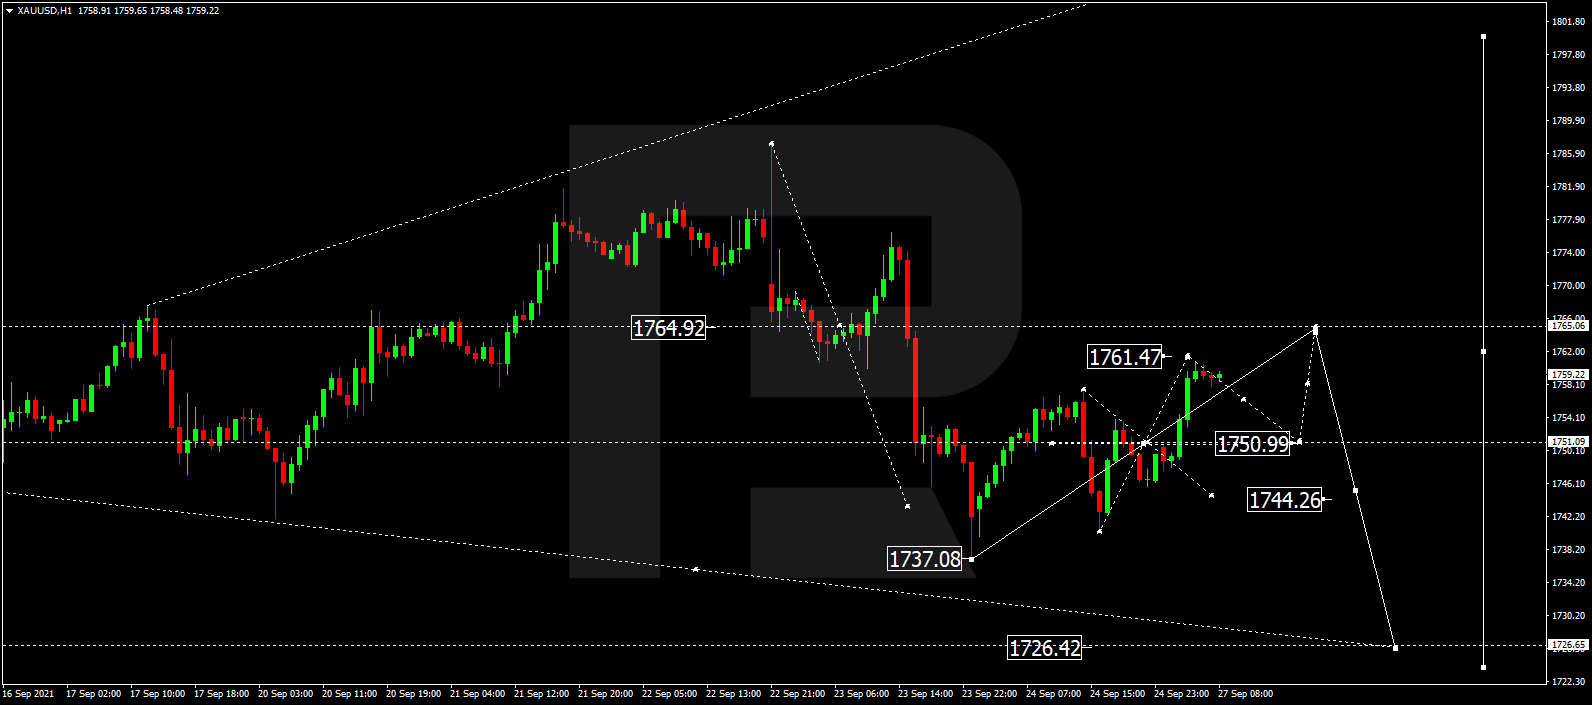
Gold is still consolidating around 1750.00. Today, the metal may expand the range up to 1761.47 and then form a new descending structure to return to 1750.00. After that, the instrument resume trading upwards with the target at 1764.90 and then start another decline to reach 1726.40.
S&P 500
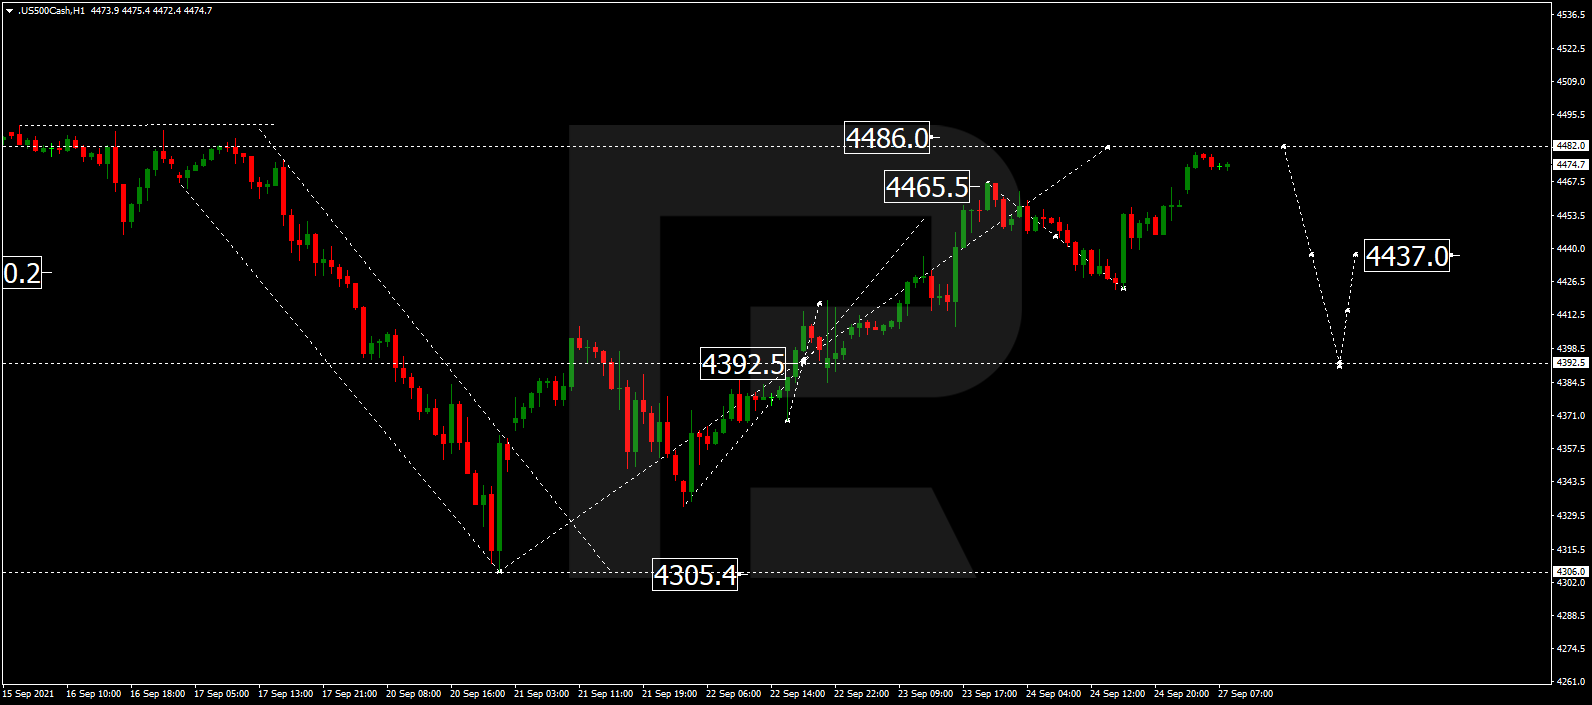
The S&P index has extended the correction towards 4486.0. Possibly, today the asset may start another decline to reach 4392.0 and then resume growing with the target at 4437.0.
Attention! Forecasts presented in this section only reflect the author’s private opinion and should not be considered as guidance for trading. RoboForex LP bears no responsibility for trading results based on trading recommendations described in these analytical reviews.
According to the IFO Munich Economic Institute, which estimated business sentiment in Germany, the German industry is in recession. It is noted that many companies that took part in the IFO survey stated that not only their current business situation but also their perspectives are worsening. Meanwhile, companies that operate in the tourism and hotel business, as well as in the construction business, noted the improvement of the situation.
From the technical point of view, the general trend of the EUR/USD currency pair is bullish. The price is trading near the priority change level. The MACD indicator shows a divergence. Under such market conditions, buy deals can be considered from the priority change level. It is best to look for sell trades from the resistance levels near the moving average or after the breakdown of priority change level.
Alternative scenario: if the price breaks down through the 1.1704 support level and fixes below, the mid-term uptrend will likely be broken.
News feed for 2021.09.27:
– Eurozone ECB President Lagarde’s Speech at 14:45 (GMT+3);
– US FOMC Member Evans’s Speech at 15:00 (GMT+3);
– US Core Durable Goods Orders (m/m) at 15:30 (GMT+3);
– US FOMC Member Williams’s Speech at 19:00 (GMT+3);
– US FOMC Member Brainard’s Speech at 19:15 (GMT+3).
The GBP/USD currency pair
Technical indicators of the currency pair:
Prev Open: 1.3718
Prev Close: 1.3666
% chg. over the last day: -0.38%
One-third of BP’s gas stations are out of fuel. Car queues near gas stations have been observed for the third consecutive day. The shortage of drivers is causing problems transporting fuel from refineries to gas stations. Some operators were forced to limit deliveries and others even closed gas stations.
On the hourly time frame, the GBP/USD trend is bearish. The MACD indicator has become inactive. Under such market conditions, it is better to look for sell trades from the resistance levels near the moving average line. Buy deals should be considered only intraday and only with short targets from the support levels.
Alternative scenario: if the price breaks out through the 1.3812 resistance level and consolidates above, the bullish scenario will likely resume.
News feed for 2021.09.27:
– UK BoE Gov Andrew Bailey’s Speech at 21:00 (GMT+3).
The USD/JPY currency pair
Technical indicators of the currency pair:
Prev Open: 110.25
Prev Close: 110.74
% chg. over the last day: +0.44%
Last week, the Japanese government announced that more than half of the population is fully vaccinated against COVID-19, with vaccination rates finally catching up with the US, UK, and other major countries. As for supply chain disruptions, new measures are needed to solve the problem of the lack of key products such as semiconductors and auto parts. And while the prime ministerial candidates plan to compile a package of measures to stimulate the economy, the Japanese yen is losing its positions against the dollar index.
Trading recommendations
Support levels: 110.40, 109.95, 109.63, 109.27
Resistance levels: 110.65, 110.95, 111.49
The main trend of the USD/JPY currency pair has changed to bullish. Against the background of the Japanese Yen weakness, the USD/JPY quotes sharply rushed up. The MACD indicator has become positive. There are signs of overbuying but no signs of reversal. Under such market conditions, it’s better to look for buy positions from the support levels after a small pullback, as the price has deviated strongly from the moving average. Sell positions should be considered only throughout the day from the resistance levels but only after the sellers’ initiative.
Alternative scenario: if the price falls below 109.63, the uptrend is likely to be broken.
There is no news feed for today.
The USD/CAD currency pair
Technical indicators of the currency pair:
Prev Open: 1.2654
Prev Close: 1.2646
% chg. over the last day: -0.06%
The Canadian dollar is a commodity currency, so the USD/CAD currency pair is highly dependent on the dynamics of the dollar index and oil prices. The dollar index traded in a range on Friday, while oil prices continued to rise. As a result, the USD/CAD quotes are declining against the background of the strengthening Canadian dollar.
From the technical point of view, the trend has changed to bearish. The price fell below the moving average and broke through down the priority change level. The MACD indicator is negative, but there are signs of a reversal in the form of divergence. That means that a breakout of the priority change level might be false. Under such market conditions, it is better to buy only after the price returns above the level of priority change level, with a bullish initiative. It is best to look for sell trades from resistance levels near the moving average.
Alternative scenario: if the price breaks out through the 1.2646 support level and fixes above again, the uptrend will likely resume.
This article reflects a personal opinion and should not be interpreted as an investment advice, and/or offer, and/or a persistent request for carrying out financial transactions, and/or a guarantee, and/or a forecast of future events.
The current BABA structure suggests the construction of a large zigzag Ⓐ-Ⓑ-Ⓒ.
Apparently, the construction of the middle part of this zigzag, correction Ⓑ has come to an end. It consists of three main sub-waves (A)-(B)-(C) of the intermediate degree. The final part of the intermediate impulse wave (C) took the form of an ending diagonal.
Most likely, we are currently at the beginning of the development of a bullish wave Ⓒ, which can take the form of a simple impulse. Its growth may end above the level of 274.86, which was marked by the correction wave (B).
However, the development of the primary correction wave Ⓑ could continue. It may take the form of an intermediate triple zigzag (W)-(X)-(Y)-(X)-(Z).
The actionary wave (W) is a minor double zigzag, and the second actionary wave (Y) is a triple zigzag.
If our assumption is correct, then in the coming week, the price could continue declining in the actionary intermediate wave (Z) to the level of 118.48, at which, primary correction Ⓑ will be at 76.4% of wave Ⓐ.
And only after the full completion of this correction the price could rise to 274.37.
Orbex is a fully licensed broker that was established in 2011. Founded with a mission to serve its traders responsibly and provides traders with access to the world’s largest and most liquid financial markets. www.orbex.com
The US stock market closed in the green zone on Friday. The Dow Jones Industrial Average increased by 0.10% (+0.98% for the week), the S&P 500 added 0.15% (+1.19% for the week) and the Nasdaq Technology Index added 0.11% (+1.96% for the week). Despite all of the major indices rising by the end of the week, US stocks experienced their biggest weekly outflow in more than three years, with traders withdrawing $28.6 billion from US equity funds during the week. With the QE program cuts set to begin in a little over a month, there is no reason to expect further significant growth in the indices.
US House Speaker Nancy Pelosi urged her Democratic colleagues to pass the Biden administration’s $3.5 trillion spending package. The House of Representatives is scheduled to vote on the infrastructure package this Thursday. US President Joe Biden indicated in his speech that the administration was going to make historic tax cuts for the middle class and increase taxes on large corporations and wealthy citizens.
Stock markets in Western Europe ended Friday trading with a decline. British FTSE 100 index decreased by 0.4% (+1.26% for the week), German DAX decreased by 0.7% (+1.78% for the week), French CAC 40 lost 1% (+2.92% for the week), Spanish IBEX 35 decreased by 0.4% (+2.71% for the week). Stocks of sports goods producers fell on Friday. Adidas AG dropped 2.5%, Puma SE dropped 3% and JD Sports decreased by 2.4%. The UK consumer confidence index fell five points in September compared to the previous month. The UK is facing several crises at once: an international gas price hike that is forcing energy companies out of business, which threatens to undermine meat production; a truck driver shortage that brings chaos on the retail trade and leaving not only empty store shelves but also empty gasoline stations. In Germany, the Chancellor held elections, which will succeed Angela Merkel, who served as the head of the German office for 16 years. The first data of exit polls were published in Germany. The German Social Democrats led by Olaf Scholz are leading the Bundestag elections with 26%.
Energy shortages around the world continue. Natural gas prices in Europe are at record highs. The gas crisis in Europe is already bigger than the oil shock of the 1970s in the United States. Oil prices increased for the fifth straight day on Monday, with Brent crude hitting $80 amid concerns about tight supply as some parts of the world see demand rise with pandemic conditions easing. Goldman Sachs raised its year-end forecast for Brent crude oil from $80 to $90 per barrel.
The 10-year Treasury yield jumped from 1.30% to 1.45% last week after the Fed signaled a reduction in its QE program. Rising yields and a rising dollar index are always negative for gold and silver prices, as these instruments are inversely correlated.
Coal prices in China also reached an all-time high. The National Energy Administration of China (NEA) has ordered coal and gas companies to increase production to ensure the country has enough energy to keep homes warm in winter. Car sales in China could rise in 2021, breaking a three-year slump. Vietnam plans to ease coronavirus measures and allow businesses to resume production from next week to support an economy hit by prolonged lockdowns.
Adding to the semiconductor shortages plaguing many industries appears to be a shortage of passive components such as capacitors. Chemi-Con, Nichicon, and Rubycon plants in Malaysia and Indonesia, where most of the well-known aluminum electrolytic capacitors are made, were closed in July and August. Meanwhile, the three listed companies together control about 50% of the market for these products. The current restrictions are expected to reduce capacitor shipments by 30-60%.
Evergrande’s foreign investors have not received an interest payment. Evergrande Payment was to be made on Thursday. The missed payment opens Evergrande’s grace period, which could lead to the largest default. It would also raise questions about the financial solvency of investors and could lead them to start selling their other assets to cover the losses.
Main market quotes:
S&P 500 (F) 4,455.48 +6.50 (+0.15%)
Dow Jones 34,798.00 +33.18 (+0.095%)
DAX 15,531.75 −112.22 (−0.72%)
FTSE 100 7,051.48 −26.87 (−0.38%)
USD Index 93.28 −0.19 (−0.20%)
Important events for today:
– Eurozone ECB President Lagarde’s Speech at 14:45 (GMT+3);
– US FOMC Member Evans’s Speech at 15:00 (GMT+3);
– US Core Durable Goods Orders (m/m) at 15:30 (GMT+3);
– US FOMC Member Williams’s Speech at 19:00 (GMT+3);
– US FOMC Member Brainard’s Speech at 19:15 (GMT+3);
– UK BoE Gov Andrew Bailey’s Speech at 21:00 (GMT+3).
This article reflects a personal opinion and should not be interpreted as an investment advice, and/or offer, and/or a persistent request for carrying out financial transactions, and/or a guarantee, and/or a forecast of future events.
Many of us will have heard the famous phrase “sell in May and go away” in relation to the financial markets. This phrase refers to the theory that, during the period between the months of November and April, the growth in the stock market is higher than the average growth of the months between May and November. Therefore, the phrase recommends closing our positions and waiting for the summer period to pass before resuming our activity.
So far, in 2021, this premise is not being entirely fulfilled. Whilst it is true that the upward trend seems to have slowed down, if we look at the main stock market indices from June onwards, we can see that – with the exception of the IBEX35, generally speaking – the trend has remained positive, thus continuing the trend from the first half of the year.
European indices:
IBEX35 has lost 2.37% since May.
DAX40 is up 1.58% since May.
CAC40 is up 3.57% since May.
FTSE100 is up 0.67% since May.
US indices:
DJI30 is up 0.78% since May
SP500 is up 5.98% since May
Nasdaq up is 9.4% since May
As we have noted in recent analyses, during the last few weeks we have observed a deterioration in the global economy. As a consequence of this, September has been generally negative, erasing part of the gains obtained up to August – with declines in September of 1.04%, 1.39% and 1.49% in the DAX40, NQ100 and SP500 respectively.
To this slowdown in macro data, we must add the uncertainty regarding the impact of the start of tapering in the United States and the formation of the new government in Germany following yesterday’s elections, in which the replacement for Chancellor Angela Merkel was to be decided after she announced her departure several months ago, having led the country for the last 16 years.
These elections have resulted in uncertainty with regard to the new government, as Olaf Sholz’s social democratic party (SPD) has not achieved a clear majority. Therefore, an intense period of negotiations is now underway to achieve power.
After the last meeting of the Federal Reserve, it seems that tapering will begin in November and could end in mid-2022, so we will have to be very attentive to how the market digests this situation, as a hasty withdrawal of stimulus could cause corrections in the main stock market indices.
DAX40 Analysis
If we focus on the German DAX40, we can see that, over the last few months, it has maintained a clear upward trend that led it to set new all-time highs in mid-August. These highs came after the price overcame the sideways movement it had been following since last June after successive support on its uptrend line. Although, after finally setting its current all-time highs (green band), the price began a consolidation that led it to break its important long-term uptrend line.
This break led the price to look for its important support zone in the area where its 200-session moving average in red meets the lower red band near 15,000 points. Here, the price found a point of support to make a new impulse, which has led it to once again overcome its important support/resistance level (represented by the orange band) on which it has been pivoting for several months.
This support/resistance level is crucial for the DAX40, because, if it is able to hold this level, we could witness a new impulse in search of its historical highs. In contrast, if the price loses this level, it should face again its main support and the subsequent loss of this level would open the doors to a change of trend and an even bigger correction.
Depicted: Admirals MetaTrader 5 – DAX40 Daily Chart. Date Range: 12 August 2020 – 27 September 2021. Date Captured: 27 September 2021. Past performance is not a reliable indicator of future results.
Evolution of the last five years:
2020: 3.6%
2019: 25.48%
2018: -18.26%
2017: 12.51%
2016: 6.87%
SP500 Analysis
If we focus on the daily chart of the SP500, we can see that – after the declines of this month, due to the slowdown in the economy caused by the energy crisis and the delta variant of the coronavirus – the price has lost the important bullish channel which it had been following after forming a double bottom between September and October last year represented by the red band.
This break of the lower band of the channel is important because, if the price fails to recover these levels and the pullback is confirmed, the SP500 could suffer a major correction, the main target of which would be the width of this important channel around the orange band which acts as the main support/resistance level.
The loss of this level would jeopardise the current bullish structure and open the door to a possible change of trend from bullish to bearish. Although to confirm this change in trend, the price would first have to face its important 200-session moving average in red.
Depicted: Admirals MetaTrader 5 – SP500 Daily Chart. Date Range: 17 August 2020 – 27 September 2021. Date Captured: 27 September 2021. Past performance is not a reliable indicator of future results.
Evolution of the last five years:
2020: 15.05%
2019: 29.09%
2018: -5.96%
2017: 19.08%
2016: 8.80%
With our exclusive Premium Analytics tool, you can follow all the latest market news, sentiment and technical insight! Click the banner below to find our more:
Furthermore, with the Trade.MT5 account from Admirals, you can trade Contracts for Difference (CFDs) on the DAX40, IBEX35, S&P500 and many more instruments. CFDs allow traders to attempt to profit from both rising and falling prices, whilst also benefiting from the use of leverage. Click the banner below to open an account today:
INFORMATION ABOUT ANALYTICAL MATERIALS:
The given data provides additional information regarding all analysis, estimates, prognosis, forecasts, market reviews, weekly outlooks or other similar assessments or information (hereinafter “Analysis”) published on the websites of Admirals investment firms operating under the Admirals trademark (hereinafter “Admirals”) Before making any investment decisions please pay close attention to the following:
This is a marketing communication. The content is published for informative purposes only and is in no way to be construed as investment advice or recommendation. It has not been prepared in accordance with legal requirements designed to promote the independence of investment research, and that it is not subject to any prohibition on dealing ahead of the dissemination of investment research.
Any investment decision is made by each client alone whereas Admirals shall not be responsible for any loss or damage arising from any such decision, whether or not based on the content.
With view to protecting the interests of our clients and the objectivity of the Analysis, Admirals has established relevant internal procedures for prevention and management of conflicts of interest.
The Analysis is prepared by an independent analyst Roberto Rojas, Freelance Contributor (hereinafter “Author”) based on personal estimations.
Whilst every reasonable effort is taken to ensure that all sources of the content are reliable and that all information is presented, as much as possible, in an understandable, timely, precise and complete manner, Admirals does not guarantee the accuracy or completeness of any information contained within the Analysis.
Any kind of past or modelled performance of financial instruments indicated within the content should not be construed as an express or implied promise, guarantee or implication by Admirals for any future performance. The value of the financial instrument may both increase and decrease and the preservation of the asset value is not guaranteed.
Leveraged products (including contracts for difference) are speculative in nature and may result in losses or profit. Before you start trading, please ensure that you fully understand the risks involved.
Roberto Rojas Financial Analyst, Admirals SpainRoberto is a Financial Analyst with a European Financial Advisor certificate and a Double Degree in Business Administration and in Actuarial and Financial Sciences. In 2013 was graduated as an Expert Manager in Equities
Last week the US dollar was in a consolidative mood and did not show a consistent direction, although the stock markets started the week with a rather material correction and then the US central bank finally signalled a tapering of its stimulus programme in the coming months.
USD
Data in the world’s largest economy remained good and pointed to a high level of activity among people and businesses. Preliminary data on the purchasing managers’ indices pointed to a moderate slowdown in the pace of growth, with manufacturing at 60.5 points and services at 54.4, both remaining in positive territory, although the results were weaker than in the previous month. In the secondary real estate market, annual existing home sales stood at 5.88 million in August and were stable in the perspective of the last six months, while sales of new homes reached 740 thousand per year and rose gradually for the second month in a row. The number of new jobless claims continued to rise marginally from 0.332 to 0.351 million on a weekly basis.
Also last week, the minutes of the US central bank’s last meeting were released, with the main message being that the bank’s members are prepared to reduce the size of the stimulus programme and buy smaller amounts of bonds on the market. The market’s expectation is that the next meeting will already announce amounts and dates for when and how this process will start. The forecasts for 2022 were also updated, with 3.8% annual economic growth and 2.2% inflation expected.
The spread of the virus continued to show a slowing trend, with the global average of new cases dropping from 533 to 482 thousand per day. North America recorded a decline of around -15% in cases per week, while Europe saw a slight increase of a few percent. In the US alone, the figures moved in a positive direction, with the weekly average dropping from 148 to 122 thousand cases per day. The number of vaccines administered increased from 383 million to 389 million, with a change of 6 million, as the third dose of the vaccine intensified. Overall in the US, the number of people vaccinated with at least one dose rose from 63.5% to 64.1% of the population, with a weekly increase of 0.6%. In Lithuania, the number of people vaccinated with at least one dose rose from 61.5% to 62.0%, a difference of 0.5%. In England, the number of cases remains stable at 33,000 per day.
Euro
The major currency pair EUR/USD depreciated to the level of 1.169 at the beginning of the week, but recovered its losses and ended the trading session marginally changed. Economic data on the Old Continent included the German producer price index, which rose by 12% in August compared to the same period a year earlier, the fastest rise since 1974, suggesting that upward pressure on prices still remains in the economy. Preliminary purchasing managers’ indices were also released: European manufacturing fell to 58.7 and services slipped to 56.3 points, suggesting slower growth expectations in the coming months. The EUR/USD pair ended the week down -0.1%.
JPY
The most important Asian pair USD/JPY moved in the trading channel formed at the beginning of July. After starting the week with a correction to the bottom at 109.2, it started to appreciate significantly on Wednesday and ended the week at 110.7 points. Among the data was the August annual inflation rate, which remained negative at -0.4%. Preliminary purchasing managers’ indices showed mixed results, with industrial falling to 51.7 points and services rising to 47.4. USD/JPY ended the week trading up 0.7%.
GBP
The British pound/US dollar pair reflected the general sentiment on the currency markets and depreciated at the beginning of the week before appreciating in the second half. Data included preliminary purchasing managers’ indices: industrial at 56.3 and services at 54.6 points. The central bankers unanimously decided to keep the monetary policy and the amount of stimulus unchanged. GBP/USD ended the week down -0.5%.
Economic Events
This week will start quietly and on Monday only the US industrial orders will be monitored. On Tuesday, the US consumer confidence index will be due, and on Wednesday the German retail sales and the US pending home sales will be released. On Thursday, Japanese industrial production data and German labour market results will be monitored, while on Friday European preliminary inflation and actual purchasing managers’ indices will be seen.
According to Admiral Markets market sentiment data, 70% of investors have long positions in EUR/USD (down -15 percentage points compared to last week). In the main Asian pair USD/JPY, 9% of investors have long positions (down -15 percentage points). In the GBP/USD pair, 68% of participants expect a rise (down -15 percentage points). Such market data is interpreted as a contrarian indicator, and therefore EUR/USD and GBP/USD are expected to fall, while USD/JPY is expected to appreciate. The analysis of positioning data should be combined with fundamental projections and technical analysis.
The given data provides additional information regarding all analysis, estimates, prognosis, forecasts, market reviews, weekly outlooks or other similar assessments or information (hereinafter “Analysis”) published on the websites of Admiral Markets investment firms operating under the Admiral Markets trademark (hereinafter “Admiral Markets”) Before making any investment decisions please pay close attention to the following:
This is a marketing communication. The content is published for informative purposes only and is in no way to be construed as investment advice or recommendation. It has not been prepared in accordance with legal requirements designed to promote the independence of investment research, and that it is not subject to any prohibition on dealing ahead of the dissemination of investment research.
Any investment decision is made by each client alone whereas Admiral Markets shall not be responsible for any loss or damage arising from any such decision, whether or not based on the content.
With view to protecting the interests of our clients and the objectivity of the Analysis, Admiral Markets has established relevant internal procedures for prevention and management of conflicts of interest.
The Analysis is prepared by an independent analyst, Skirmantus Paulavicius (analyst), (hereinafter “Author”) based on their personal estimations.
Whilst every reasonable effort is taken to ensure that all sources of the content are reliable and that all information is presented, as much as possible, in an understandable, timely, precise and complete manner, Admiral Markets does not guarantee the accuracy or completeness of any information contained within the Analysis.
Any kind of past or modeled performance of financial instruments indicated within the content should not be construed as an express or implied promise, guarantee or implication by Admiral Markets for any future performance. The value of the financial instrument may both increase and decrease and the preservation of the asset value is not guaranteed.
Leveraged products (including contracts for difference) are speculative in nature and may result in losses or profit. Before you start trading, please ensure that you fully understand the risks involved.
Admirals An all-in-one solution for spending, investing, and managing your moneyMore than a broker, Admirals is a financial hub, offering a wide range of financial products and services. We make it possible to approach personal finance through an all-in-one solution for investing, spending, and managing money.