U.S. Default Could Be A Disaster

By Ino.com

– On September 30th, the United States Congress sent a bill to President Biden’s desk to avoid a government shutdown, at least until December 3rd. In the past, when the government has shut down or come close to a shutdown, similar to what just happened, we have seen market turmoil caused by the uncertainty surrounding the situation. However, even with that uncertainty removed temporarily until December 3rd, the markets may not have much breathing room since lawmakers still need to raise or suspend the debt ceiling before October 18th.

If the politicians in Washington can’t agree on the debt ceiling, the U.S. could default on U.S. debt, something that most market participants believe would be “disastrous.” However, the United States has never in its history defaulted on government debt. So, we honestly do not know what would happen if it were to happen. But, since U.S. Treasury bonds are widely considered “zero” risk and used as a benchmark or starting point to determine the risk of other alternative investment options if the government did indeed default, it would send shock waves throughout the market as other assets would need to be repriced based on their risk level when compared to U.S. Treasury bonds.

The uncertainty which would follow and potentially dramatic rise in interest rates across the board could and very likely would send the U.S. economy into a tailspin with the stock market falling and potentially a rise in unemployment. Some even believe that government spending in the forms of social security payments and bills owed to contractors would be suspended for a period of time while the U.S. Treasury determines what to pay and what not to pay. This would obviously hurt the overall economy as potentially millions of Americans would not receive social security checks and or paychecks if they work for a government contractor.

However, the long-term implications of defaulting would likely be the worst consequences. It is estimated that the U.S. Government gets a 25-basis point reduction in its interest rate because of the ‘perceived unparalleled safety and liquidity of the Treasury market.’ That discount on interest rates the government receives equates to roughly $60 billion in lower interest payments this year alone and more than $700 billion in interest savings over the next decade, based on the current U.S. debt amount. That means if the politicians in Washington can’t agree on something and the U.S. Treasury Department is forced to come up with creative solutions because it doesn’t have the funds to pay its bills, the U.S. taxpayer will be on the hook for a higher interest rate in the future.

So as an investor, how should you proceed over the next few days or weeks as this plays out?

Let’s talk about a few options you have at your disposal.

First, do nothing different and maintain the mindset that ‘this storm will pass.’ This is honestly the mindset that 99% of investors should take. If the stock market crash at the start of the pandemic, or the 2007-08 financial crisis, or the dotcom bubble (I’ll stop here), have taught us anything, it’s that the market will rebound and go higher than it was even just prior to the crisis. Long-term-oriented investors should literally just sit back and ride the roller coaster with their hands up (screaming is allowed but only in the confines of your own home) and let the market do what the market does. There is absolutely nothing wrong with this approach; you just need to be patient and keep a calm mind if the mayhem does hit.

Another option is that you could buy the market now, prior to the potential market-crushing event, with the thinking that some stocks have already been taken lower by some investors in anticipation of a big drop that they don’t want to be involved in. Then when the potential future market wrecking event doesn’t happen, stocks will bounce higher, and you will be sitting pretty. Finally, you could buy individual equities or ETFs that mimic the market, such as the Vanguard S&P 500 ETF (VOO), the SPDR S&P 500 ETF (SPY), which both follow the S&P 500 Index or the Invesco QQQ Trust (QQQ), which tracks the NASDAQ Index.

A third option is to buy a hedge in case the ceiling is hit, and we don’t have a solution from Congress, and the markets go haywire. Again, you would remain stable and hold all your current holdings and make no changes to those either before or after the crash occurred. However, before the crash, you hedge your long-term holdings and buy something like the Direxion Daily S&P 500 Bear 3X Shares ETF (SPXS), which is betting that the S&P 500 will go lower, or the ProShares UltraPro Short QQQ (SQQQ), which is an ETF that is betting against the NASDAQ Index or the QQQs. Another way of hedging would be to buy put options on the Vanguard S&P 500 ETF or the Invesco QQQ Trust themselves.

As I said before, 99% of investors should just sit back and watch the mess play out in Washington and do nothing different with their investors or portfolio. The 1% that may want to ‘time’ the market have a 50% chance of being right, so good luck. But what 100% of investors should do, is keep investing, no matter what happens over the next few weeks.

Matt Thalman
INO.com Contributor – ETFs
Follow me on Twitter @mthalman5513

Disclosure: This contributor did not own shares of any investment mentioned above at the time this blog post was published. This article is the opinion of the contributor themselves. The above is a matter of opinion provided for general information purposes only and is not intended as investment advice. This contributor is not receiving compensation (other than from INO.com) for their opinion.

By Ino.com – See our Trader Blog, INO TV Free & Market Analysis Alerts

Source: U.S. Default Could Be A Disaster

 

Is the resource curse hard-baked into African economies? China’s approach hints that it may not be

By Daniel Ofoe Chachu, University of Zurich and Edward Nketiah-Amponsah, University of Ghana 

Countries with abundant natural resources – gold, diamonds, crude oil– often fail to transform that advantage into favourable development outcomes. This is known as the natural resource curse. Countries like Nigeria, Angola and the Democratic Republic of Congo are often cited as examples.

Several explanations have been offered for the resource course. These include the lack of government accountability usually associated with large windfalls from natural resources relative to other sources of tax revenues. Others are an increase in the local currency against major currencies such as the US dollar, which makes it difficult for other sectors of the economy to compete globally. This is referred to as the Dutch Disease, named after the economic crisis that hit the Netherlands in the mid-1970s after the discovery of oil in the North Sea.

A related problem, but one that has received less attention, is the fiscal resource curse. It refers to the inability of a country well endowed with natural resources to generate domestic revenue from other sectors of the economy. For example, between 2000 and 2010, resource revenues in Angola stayed above 20% of GDP compared to a non-resource tax level of about 7% on average.

But the fiscal resource curse need not be a foregone conclusion for developing countries. A recent study finds tentative signs that China’s approach to trade with resource rich African countries might be the answer.

China has been offered bilateral infrastructure investment deals to resource rich countries. For instance, China “pays” for some of the commodities by investing in the supplier country’s infrastructure. This has been a common approach in several African countries, including Angola, Sudan, Nigeria and Ethiopia.

There is no consensus in the economics literature on the relationship between natural resource abundance and domestic revenue mobilisation. Nevertheless many studies suggest a tradeoff between revenues from the natural resource sector versus those from other sectors.

Our study investigated whether natural resource revenues displace non-resource tax revenues in developing countries. Its novel contribution is that it explores the impact of China. This is specifically about China’s extensive involvement (as a buyer) in the natural resource trade since joining the World Trade Organisation (WTO) in 2001.

Resource rich African countries do not have to fall victim to the resource curse.
Wikimedia Commons

Enter the dragon

We examined whether China’s entrance into the global trade has affected the relationship between natural resources and domestic revenue mobilisation.

We do not find consistent evidence of a negative relationship between natural resource revenues and tax revenue mobilisation from other sectors. The key implication is that natural resource abundance need not translate into a curse.

In our study we used a unique global dataset that separates domestic resource revenues and non-resource revenues. The database was developed by the International Centre for Taxation and Development. It is hosted by the United Nations University. We also used data from the World Bank’s World Development Indicators and the International Country Risk Guide.

We analysed a sample of 45 developing countries with data covering the period 1980-2015. More than half of these countries are African.

The period after 2001 was marked by growing commodity trade and rising commodity prices. These were triggered by China’s rising demand for crude oil and metals. For example, China’s global demand for metals increased to about 40% of total demand after 2001 compared to a paltry 3% before. Africa satisfied a third of China’s energy requirements.

This demand shock spurred natural resource exports, resulting in an increase in resource revenue growth.

The China shock

Without accounting for China’s role, we find that a negative relationship between natural resource revenues and non-resource tax revenues. In other words, developing countries don’t appear to raise taxes outside the resource sector when commodity prices are high and resource revenues are growing. But robust statistical analysis suggests that it’s not so simple.

If we take into account the “China shock”, there isn’t consistent evidence of a negative relationship between natural resource revenues and non-resource tax revenues. Our study finds that natural resource revenues could play a complementary role in raising taxes outside the natural resource sector.

On average, a percentage point increase in resource revenues triggers a non-resource tax revenues increase of about 0.3 percentage points for the countries and time period of study. However, the relationship is not strong, statistically.

A plausible explanation could be how developing countries take advantage of China’s demand for natural resources. In return for primary commodities, China offers a bilateral infrastructure investment strategy. This often compensates for the financial market and governance challenges that developing countries face. For instance, China “pays” for some of the commodities by investing in the supplier country’s infrastructure. This has been a common approach in several African countries, including Angola, Sudan, Nigeria and Ethiopia.

China’s development of infrastructure in these countries could be stimulating the growth of their non-resource sectors. Infrastructure is one of the key bottlenecks for private sector growth. In turn, private sector growth can help these economies diversify the economic base and increase non-resource revenues. Thus, increasing natural resource revenues need not displace sound tax policy. Tax revenue mobilisation in the non-resource sector need not suffer.

Concerns about opacity

The lack of a highly statistically significant positive relationship deserves comment. First, even if the China shock makes a difference, developing the capacity to tax in developing countries takes time. Moreover, one should not expect China’s natural resource trade model with developing countries to automatically guarantee favourable outcomes in every case.

Indeed, the burgeoning literature on China’s involvement in Africa paints a mixed picture. For example, despite the potential benefits of infrastructure projects, there are concerns with the opacity of Chinese contracts and the quality of the projects. Some governments also worry about the cost of natural resource-backed loans. Furthermore, many developing countries lack the capacity to manage infrastructure projects effectively.

Overall, our analysis shows that there isn’t strong evidence that natural resource revenues displace non-resource tax revenues. Investments in infrastructure in developing nations on the back of natural resource windfalls could help diversify economies and government revenue. This offers policymakers an opportunity to broaden the tax base and maintain a relatively stable tax rate. It also puts something in domestic revenue buckets even when the oil wells run dry.The Conversation

About the Author:

Daniel Ofoe Chachu, Research Fellow, Institute of Political Science (Political Economy and Development Group), University of Zurich and Edward Nketiah-Amponsah, Associate Professor, Department of Economics , University of Ghana

This article is republished from The Conversation under a Creative Commons license. Read the original article.


Pandora papers: ‘it’s time to pursue lawyers and accountants who enable tax evasion’ – offshore tax expert Q&A

By Ronen Palan, City, University of London 

Many of the world’s richest and most powerful people are in the spotlight once more for using secretive tax havens and corporate structures to hide wealth and avoid paying taxes. The Pandora papers is the third in a series of huge leaks of documents to the media following the Panama papers in 2016 and the Paradise papers in 2017 – and little seems to have changed in the interim.

Those included so far in the new revelations include the leaders of the Czech Republic, Cyprus, Jordan and Ukraine, plus members of the ruling family in Azerbaijan and figures close to Vladimir Putin. In all, more than 100 billionaires are reportedly involved in the revelations, with transactions ranging from properties worth millions of pounds to slush funds and superyachts.

We asked Professor Ronen Palan, a specialist in offshore tax havens at City, University of London, about the story so far.

What are your initial thoughts?

I’m afraid I’m not surprised by these papers. There’s no evidence to suggest that the volume of transactions taking place through these offshore centres is declining, so the same financial structures that we heard about in the Panama and Paradise papers are still clearly being used.

It’s fascinating that so many of these people in the public eye must have known that eventually their activities would become common knowledge, and yet they opted for offshore secrecy anyway. I suppose any concerns may be overcome perhaps by greed and the knowledge that they will not be prevented from doing it.

In some cases we are talking about (illegal) tax evasion and in some cases it’s (legal) tax avoidance: the difference comes down to whether the people in question had fully notified the authorities in their home countries about the offshore structures they are using. In instances when I read that they are asked by the media to comment and they decline to respond, it creates the appearance that we are talking about evasion – although this remains unproven.

Why does the situation not appear to be improving?

Over the past 20 or 30 years, international regulation has focused on creating tools that allow tax authorities to ensure that taxpayers are not evading taxation. Systems were introduced that focus on “know your customer” or KYC – requiring people transacting in particular jurisdictions to fully identify themselves so that this information can be shared with other jurisdictions.

This essentially creates transparency so that you know who has money where, so that tax authorities can use this information to make sure that their citizens are not evading taxation. But while that can be effective in countries where the tax authority is operating independently of the government and politics, it’s not going to work in Russia or China or many other developing countries. It’s therefore not surprising to me that many of the revelations are about activities outside of the developed world.

But why hasn’t transparency forced tax havens to change?

It has brought about change, but some jurisdictions comply more than others. So you have got some British jurisdictions such as Jersey or the Cayman Islands that are much more transparent than they used to be. On the face of it, they can claim to be more regulated than, say, Denmark or Sweden.

But the professionals who have the expertise to create structures that enable tax evasion are still often based in these places, and they create structures with different layers that will be partly registered in these jurisdictions but partly in those with looser transparency rules such as the British Virgin Islands or Panama – following the letter but not the spirit of the law. This makes it very difficult to see what is happening and whose money is involved.

How do we improve the current situation?

The Pandora papers show we are reaching the limits of what can be done with data transparency. Unless we find ways to tighten the net, this won’t be the last leak of its kind. This is recognised at least implicitly by the OECD (Organisation for Economic Co-Operation and Development) and other international bodies in their increasing interest in going after the enablers, rather than just focusing on the tax evaders themselves.

Maybe it’s time to create something similar to what applies in medicine, so that, if enablers contravene certain standards, they can be prosecuted – even in countries who are not directly affected by their activities. If they went to such a country, they could be arrested on arrival.

Should we create a new international institution dedicated to stamping out tax evasion?

In practical terms, the three places that matter when it comes to creating international regulations are the US, EU and China. Unfortunately they are not agreeing with one another on much right now, so it will be difficult to reach an agreement about such an institution. Even if they did agree, they would be accused of imperialism by smaller countries, or of acting as dictators.

Of course, these three players would still need to agree on an initiative to really go after enablers, so you can make the same criticism of this strategy, but it is at least more modest in its scope and therefore potentially more realistic.

Are all these revelations actually helpful?

There’s certainly a danger of media saturation, in which the public knows about these kinds of activities and may be less interested by now. But we need to emphasise that the consequences are not going away: to run a modern state, it’s very expensive. To pay for a good education system, a good health system, properly functioning infrastructure and so forth, somebody has to pay for it.

If the rich are avoiding paying their share, somebody else is picking up the tab, and that’s either the poor or the squeezed middle classes. So if the public are tired of all this scandal, it doesn’t change the fact that they are suffering because of it.The Conversation

About the Author:

Ronen Palan, Professor of International Politics, City, University of London

This article is republished from The Conversation under a Creative Commons license. Read the original article.


Chris Vermeulen’s Technical Trader Tip Of The Week – October 4th, 2021

By TheTechnicalTraders

Join Chris as he talks about the energy sector stocks’ recent moves. There’s been a roughly 8% upside move in the XLE and there might still be more upside to go.

Subscribers to any service at The Technical Traders: Please let us know via a member ticket what you would like to learn about and we will do our best to make sure this happens.

Non-subscribers: Please enjoy these micro-lessons as a way to further your education and understanding of how a technical trader…well…trades!

CLICK ON THE IMAGE BELOW TO WATCH THE VIDEO

TO EXPLORE THE DIFFERENT TRADING STRATEGIES CHRIS OFFERS, PLEASE VISIT US AT THE TECHNICAL TRADERS. YOU’VE GOT MORE TO GAIN THAN TO LOSE WHEN SEEKING INFORMATION!

TheTechnicalTraders.com

NZDUSD Did Cycle Wave X End?

By Orbex

NZDUSD has completed the formation of the correction wave x of a cycle degree. It is a double zigzag consisting of primary sub-waves, the last part of which is an intermediate double zigzag (W)-(X)-(Y).

A cycle wave y is currently under development, which can take the form of a primary standard zigzag Ⓐ-Ⓑ-Ⓒ. In the last section of the chart, we can notice the primary impulse wave Ⓐ and the bearish correction Ⓑ in the form of an intermediate triple zigzag.

In the near future, the development of the primary wave Ⓒ is likely in the direction of a maximum of 0.746. It can take the form of a simple 5-wave impulse.

NZDUSD

An alternative scenario indicates that the global intervening wave x of a cycle degree could not be complete yet.

In this case, the last part of this wave, which is the primary wave Ⓩ, is still under development. It consists of intermediate sub-waves (W)-(X)-(Y), where wave (X) was formed not so long ago.

In the near future, the decline in the alternative scenario could continue in the minor wave Y. This could complete the intermediate double zigzag near 0.665. At that price level, wave Ⓩ will be at 100% of wave Ⓨ.

Only after the completion of the intervening wave x, the market can begin to move up in the cycle wave y above the level of 0.717 marked by the primary wave Ⓧ.


Orbex-LogoArticle by Orbex

Orbex is a fully licensed broker that was established in 2011. Founded with a mission to serve its traders responsibly and provides traders with access to the world’s largest and most liquid financial markets. www.orbex.com

Intraday Market Analysis – USD Lacks Support

By Orbex

USDJPY retreats below resistance

USDJPY

The dollar bounced back against the yen after a weak Tokyo CPI in September.

As the pair rose to the peak from February 2020 (112.20), a bearish RSI divergence revealed weakness in the momentum. A break below 111.20 and a bearish MA cross may have dented optimism.

The US dollar has seen bids at 110.90 when the RSI neared the oversold area. However, the bounce has been capped by 111.50 as trapped buyers were waiting to get out. A new round of sell-off would send the price to the psychological level of 110.00.

USDNOK tests critical support

USDNOK

Rally in oil prices helped lift the Norwegian krone against the greenback.

The pair had met stiff selling pressure in the supply zone around 8.8000. A sharp drop below 8.6500, which has turned into resistance, suggests that sellers have regained control of the action.

A close below 8.5500 (a major support from the daily chart) would invalidate the latest rebound and put the dollar on a bearish trajectory. An oversold RSI may cause a temporary bounce. 8.4500 would be the next stop when momentum traders stake in.

GER 40 hovers over major support

DE40

Stock markets still jitter over ongoing supply chain disruptions.

The Dax 40 has been treading water over the psychological level of 15000. A bullish RSI divergence in this important demand zone indicates that selling has become less aggressive.

However, it may be too soon to call for a U-turn. The bulls must take out 15330 before they could convince trend-followers of a turnaround. Then, 15700 would be the next hurdle.

On the downside, a bearish breakout would trigger a wave of stop-losses, sending the index towards 14500.


Orbex-LogoArticle by Orbex

Orbex is a fully licensed broker that was established in 2011. Founded with a mission to serve its traders responsibly and provides traders with access to the world’s largest and most liquid financial markets. www.orbex.com

EU Retail Sales: More Inflation On The Way?

By Orbex

The eurozone’s better than expected services PMI could suggest that the European economy is on track for growth.

The services sector, of course, suffered the most from covid, and its recovery would be a strong sign of improvement over the impact from covid.

The implication is that European consumers are still willing to spend. We could get confirmation of that theory tomorrow when the eurozone will report its August Retail Sales data.

The importance here is in the context of rising inflation. Several EU officials have acknowledged that inflation is a problem. However, in the most recent meeting of Financial Ministers this week, including Lagarde, they all agreed that inflation will be transitory.

We’ve all heard that before

European policymakers are banking on inflation being higher for the rest of the year, but returning to a more modest level next year.

This implies that monetary and fiscal policy is likely to stay on track. With less inflation pressure, the ECB is in a better position to keep the liquidity flow going. This is also likely to keep the euro relatively weaker to other currencies. Other nations’ central banks will have to pull back on easing to deal with rising inflation.

Nonetheless, part of this evaluation that European officials are making is based on some circumstantial evidence, and they publicly acknowledge it.

The rising cost of energy across the continent has been one of the drivers of CPI. This is why many officials are confident that the core inflation figure will not show as much of an anomaly.

Where the troubles start

The problem is that if energy prices remain high (or investors expect they will) then the increased cost for transportation and manufacturing will be passed on to consumers.

This comes in the context of OPEC+ agreeing to maintain its slow growth in production over the coming months. The price of crude jumped in response. And that could put further pressure on supply chains going into the critical Christmas shopping season.

Long-range weather forecasters are saying this winter is likely to be unusually cold in Europe. In turn, this could potentially exacerbate an already stressed energy system.

Just yesterday, EC President von der Leyen called for making Europe “energy independent”. This is a very challenging goal considering that oil makes up 32% of Europe’s primary energy grid. Additionally, Europe imports over 98% of its oil, chiefly from OPEC+ nations.

Getting the economy going

Now that Europe is in a position to “return to normal” post-pandemic, it’s becoming increasingly obvious that pre-pandemic Europe wasn’t doing so well.

European economic growth could simply stagnate in the coming months, as the bloc imposes more taxes and regulatory burdens in pursuit of its climate objectives. Political uncertainty in the largest economy also might keep investment on the back burner.

Analysts expect the eurozone’s retail sales to have increased 0.8% in August, compared to -2.3% in July. On an annual basis that would put the figure at just 0.4% higher than last year’s – when there were significant restrictions still in place due to covid.


Orbex-LogoArticle by Orbex

Orbex is a fully licensed broker that was established in 2011. Founded with a mission to serve its traders responsibly and provides traders with access to the world’s largest and most liquid financial markets. www.orbex.com

Fibonacci Retracements Analysis 05.10.2021 (EURUSD, USDJPY)

Article By RoboForex.com

EURUSD, “Euro vs US Dollar”

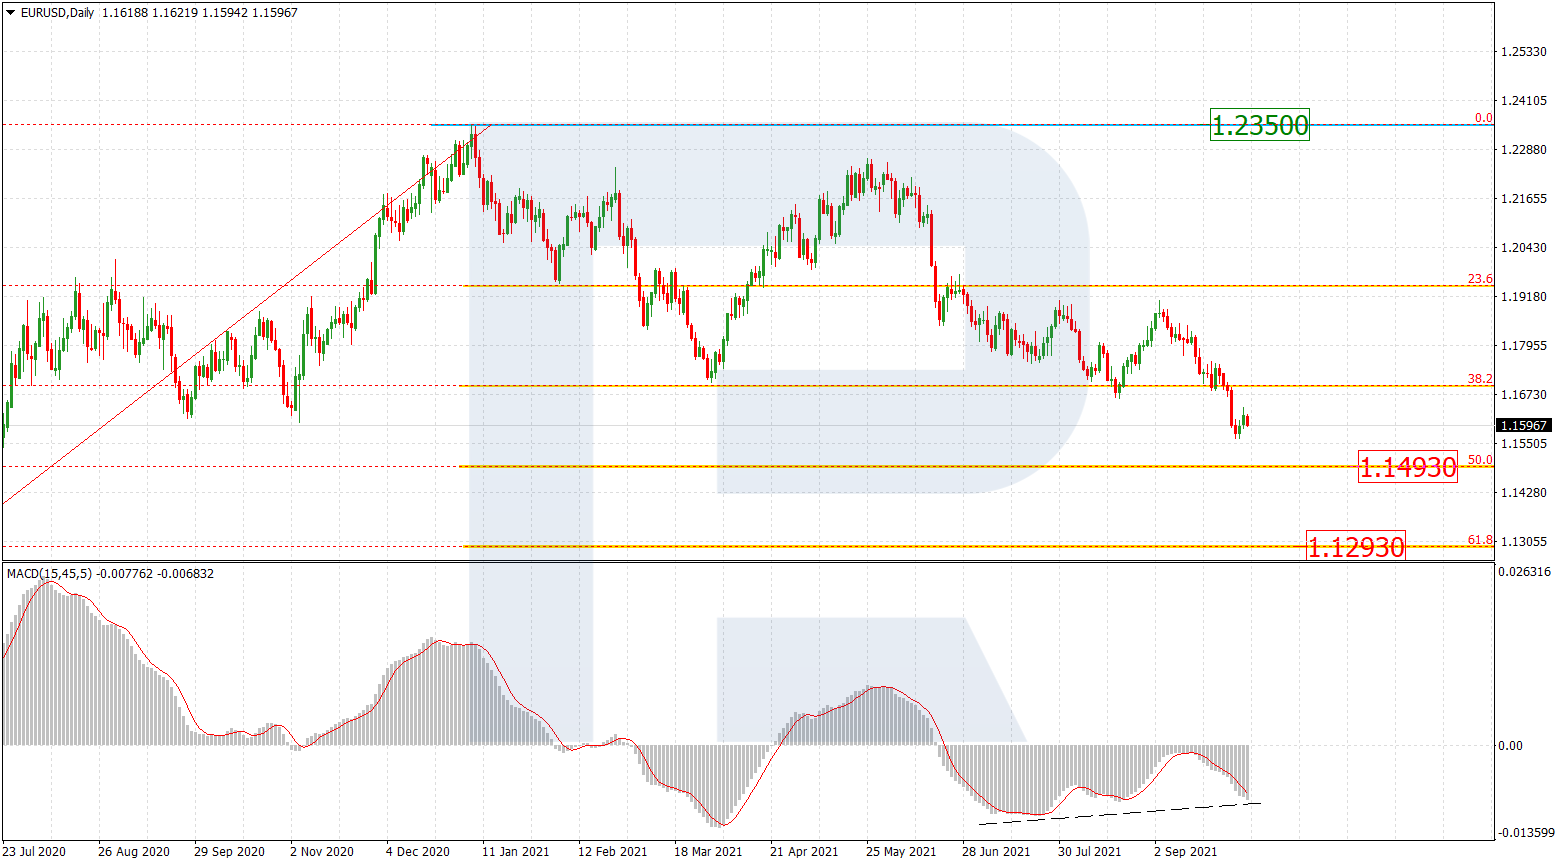
As we can see in the daily chart, EURUSD is forming a steady descending wave towards the long-term 50.0% fibo at 1.1493. Of course, this decline may continue down to 61.8% fibo at 1.1293 but convergence on MACD may hint at a possible reversal. If it happens, the asset may resume moving upwards to update the high at 1.2350.

EURUSD_D1
Risk Warning: the result of previous trading operations do not guarantee the same results in the future

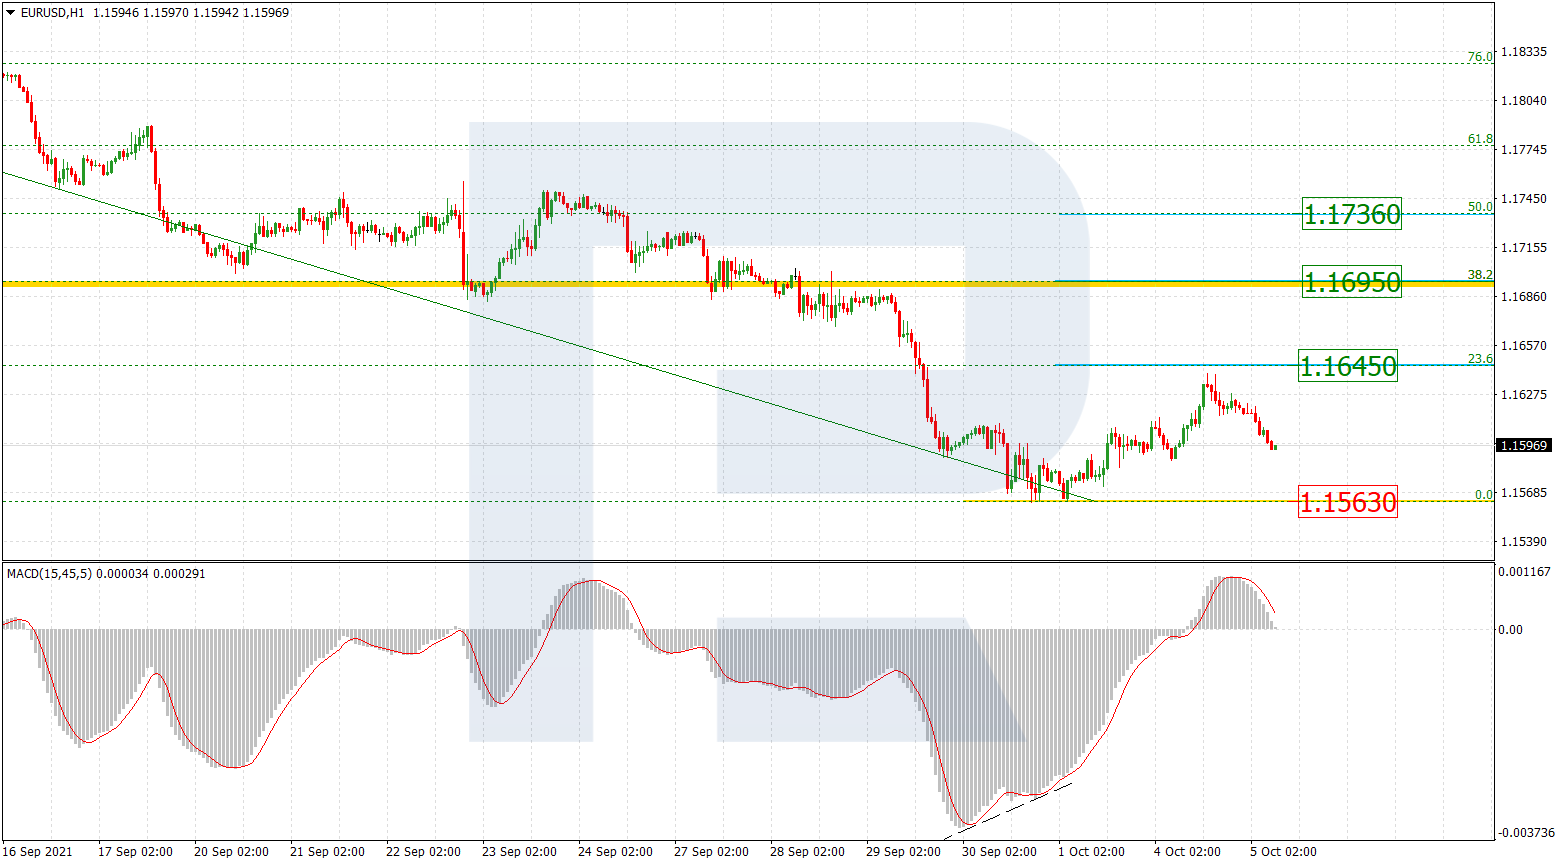
The H1 chart shows the start of a short-term correction after local convergence on MACD. The first rising wave tried to test 23.6% fibo at 1.1645 but failed and transformed into a new decline towards the low at 1.1563. However, the low hasn’t been broken yet. If the pair rebounds from this level, the asset may extend the correction up to 38.2% and 50.0% fibo at 1.1695 and 1.1736 respectively. On the other hand, a breakout of the low will lead to a further downtrend.

EURUSD_H1
Risk Warning: the result of previous trading operations do not guarantee the same results in the future

USDJPY, “US Dollar vs. Japanese Yen”

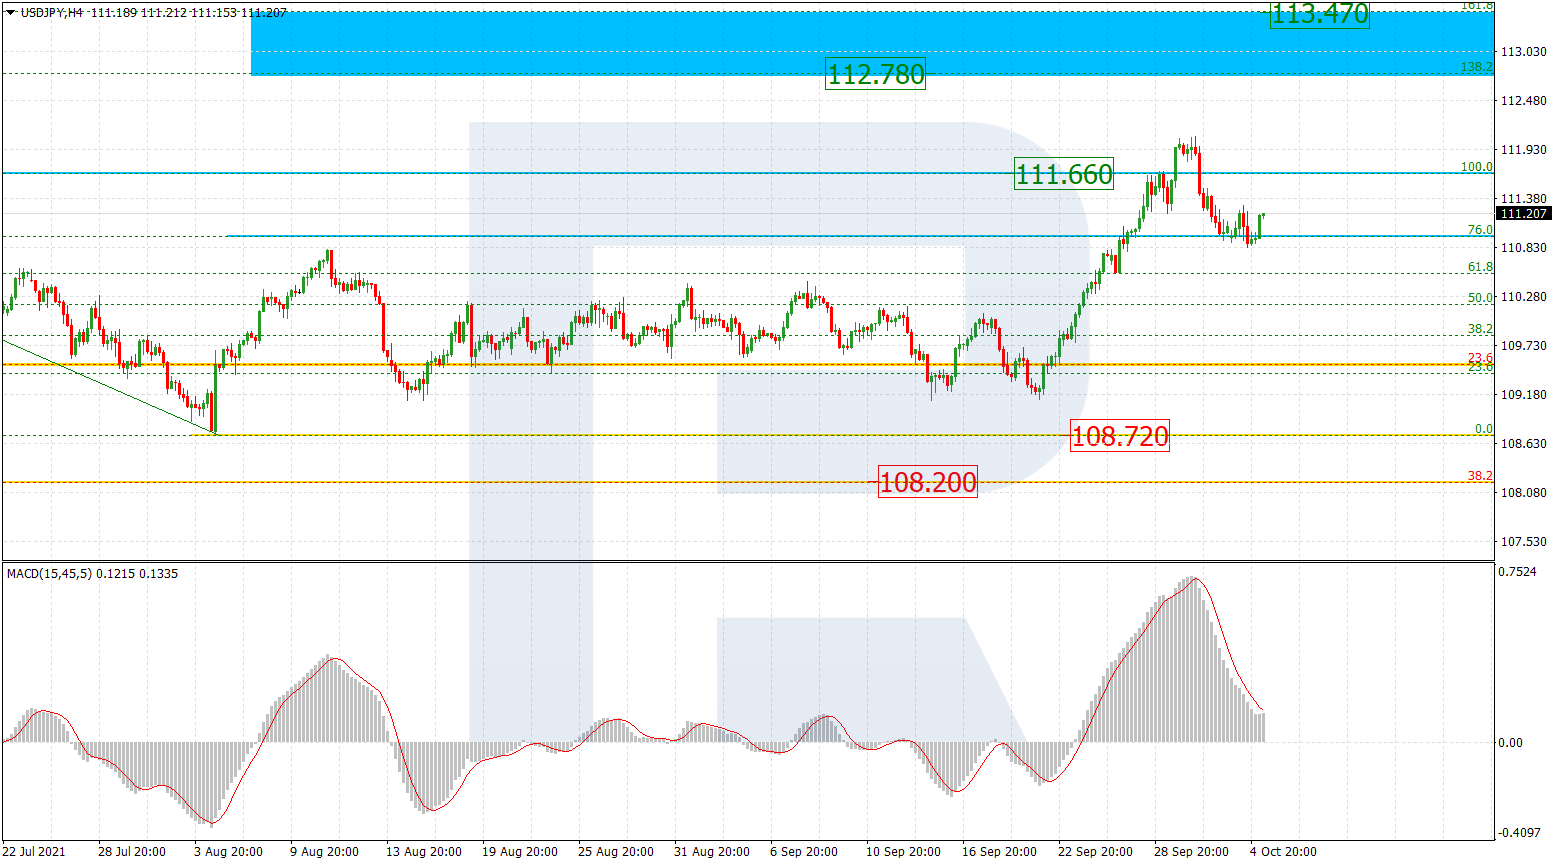
As we can see in the H4 chart, USDJPY is correcting downwards after breaking the high at 111.66. After finishing the pullback, the asset may continue growing towards the post-correctional extension area between 138.2% and 161.8% fibo at 112.78 and 113.47 respectively. The support is the local low at 108.72.

USDJPY_H4
Risk Warning: the result of previous trading operations do not guarantee the same results in the future

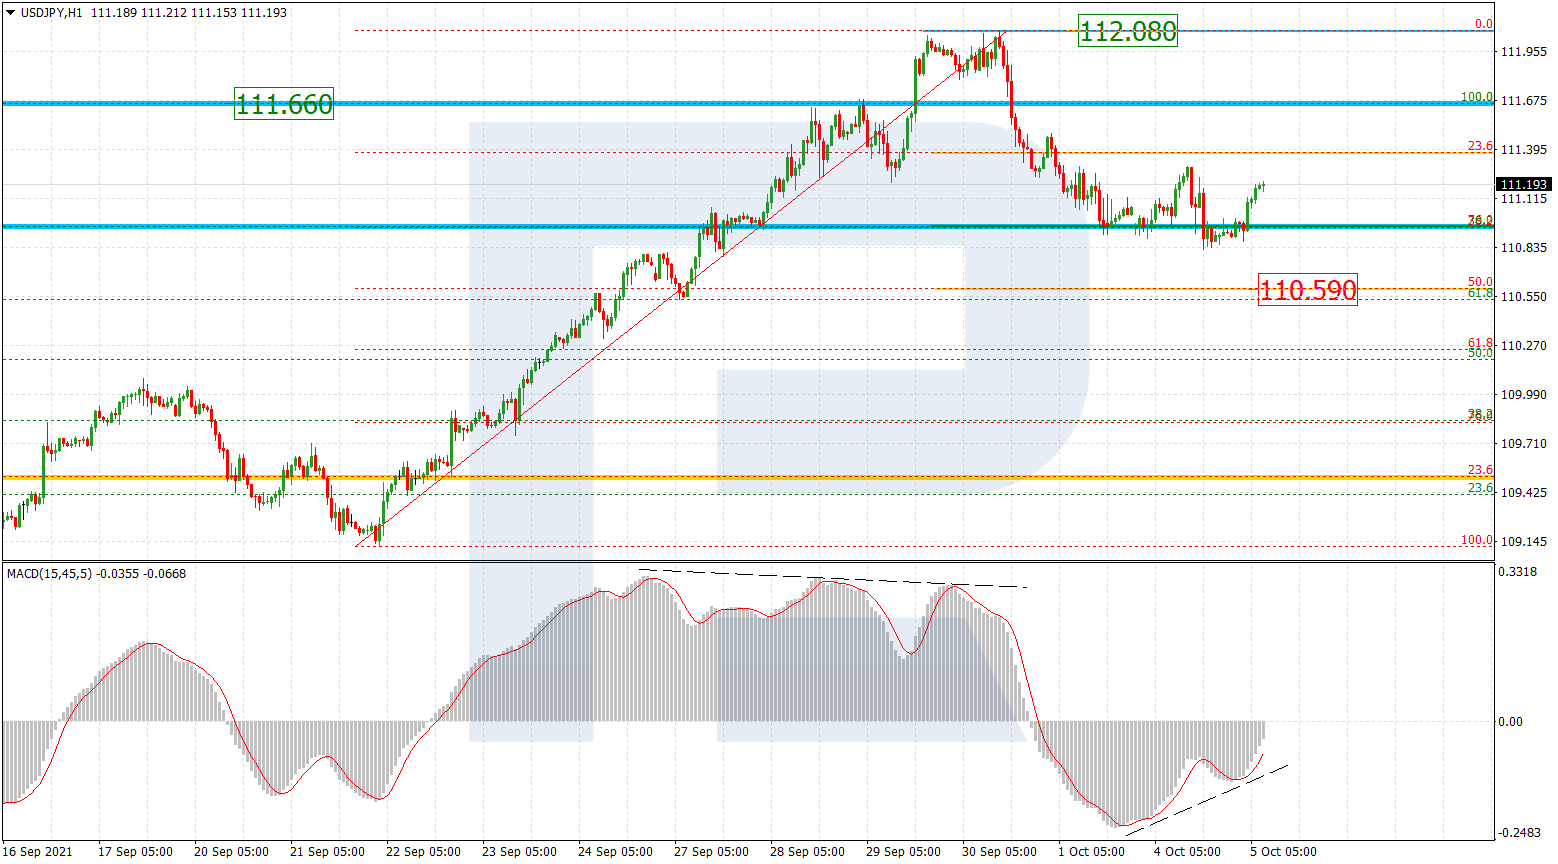
The H1 chart shows a more detailed structure of the current descending correction after divergence on MACD. The pair has reached 38.2% fibo and may yet continue falling towards 50.0% fibo at 110.59. At the same time, convergence on the indicator may hint at a new rising impulse after the asset finishes the pullback.

USDJPY_H1

Article By RoboForex.com

Attention!
Forecasts presented in this section only reflect the author’s private opinion and should not be considered as guidance for trading. RoboForex LP bears no responsibility for trading results based on trading recommendations described in these analytical reviews.

The Australian Dollar couldn’t keep balance. Overview for 05.10.2021

Article By RoboForex.com

AUDUSD is falling after the RBA meeting and the statistics release.

The Australian Dollar is falling against the USD on Tuesday afternoon. The current quote for the instrument is 0.7281.

So, during its October meeting, the Reserve Bank of Australia decided to keep the benchmark interest rate intact at 0.10%, just as expected. The QE program also remained unchanged: AU$4B every week until February 2022 at least to support the economic recovery process in Australia.

In the comments, the RBA said that there were no necessary conditions that could make the regulator change its rate-related stance – it might change closer to 2024.

At the same time, the RBA believes that the current slowdown in the economic growth rate is temporary and the recovery will boost once the vaccination campaign accelerates. The regulator, in its turn, is going to keep the business-friendly monetary policy.

The data published in the morning showed that the Retail Sales lost 1.7% m/m in August, just as expected. Moreover, this time the decline is the same it was in July. That’s not good for the Aussie.

Article By RoboForex.com

Attention!
Forecasts presented in this section only reflect the author’s private opinion and should not be considered as guidance for trading. RoboForex LP bears no responsibility for trading results based on trading recommendations described in these analytical reviews.

The Analytical Overview of the Main Currency Pairs on 2021.10.05

by JustForex

The EUR/USD currency pair

Technical indicators of the currency pair:
  • Prev Open: 1.1593
  • Prev Close: 1.1619
  • % chg. over the last day: +0.22%

ECB spokesman Paolo Gentiloni says that high inflation in EU countries is temporary, as supply chain problems and rising energy prices are pushing prices up. But the ECB expects EU countries to show a positive economic trend in the third quarter.

Trading recommendations
  • Support levels: 1.1564, 1.1453
  • Resistance levels: 1.1671, 1.1717, 1.1772, 1.1802, 1.1835

From the technical point of view, the EUR/USD trend is bearish. But the MACD indicator has become inactive. It indicates that the sellers have stopped putting pressure. Under such market conditions, traders should consider sell deals from the resistance levels near the moving average, as the price has deviated from the middle line. Buy trades should be considered only from the support levels with additional confirmation in the form of a buyers’ initiative.

Alternative scenario: if the price breaks out through the 1.1717 resistance level and fixes above, the mid-term uptrend will likely resume.

EUR/USD
News feed for 2021.10.05:
  • – Eurozone Services PMI (m/m) at 11:00 (GMT+3);
  • – US ISM Services PMI (m/m) at 17:00 (GMT+3);
  • – Eurozone ECB President Lagarde’s Speech at 18:00 (GMT+3).

The GBP/USD currency pair

Technical indicators of the currency pair:
  • Prev Open: 1.3552
  • Prev Close: 1.3605
  • % chg. over the last day: +0.39%

The situation with the delivery of fuel to gas stations is improving, but the UK is still experiencing a serious shortage of truck drivers. New car registrations in the UK fell by 35% year-over-year last month. The automotive industry continues to suffer from a global shortage of semiconductors. But the British currency is strengthening due to rising oil prices, as the GBP directly correlates with BRENT oil prices.

Trading recommendations
  • Support levels: 1.3525, 1.3457, 1.3360, 1.3282
  • Resistance levels: 1.3617, 1.3685, 1.3759, 1.3812, 1.3886

On the hourly time frame, the GBP/USD trend is bearish. But the British currency keeps getting stronger due to oil prices growth. The MACD indicator has become positive, but there are already signs of divergence. Buy trades should be considered only throughout the day and only with short targets from the support levels after the buyer’s initiative. Sell trades can be found at the resistance levels near the moving average line.

Alternative scenario: if the price breaks out through the 1.3759 resistance level and consolidates above, the bullish scenario will likely resume.

GBP/USD
News feed for 2021.10.05:
  • – UK Services PMI (m/m) at 11:30 (GMT+3).

The USD/JPY currency pair

Technical indicators of the currency pair:
  • Prev Open: 110.86
  • Prev Close: 111.91
  • % chg. over the last day: +0.04%

Tokyo’s consumer price index is declining. It’s a sign of slowing inflation in Japan’s capital. The newly elected prime minister Fumio Kishida says he will dissolve the lower house of parliament next week in preparation for the October 31 elections as he seeks a new mandate to deal with the coronavirus pandemic, a decline in economics, and security threats from China and North Korea.

Trading recommendations
  • Support levels: 110.65, 110.40, 109.95, 109.63, 109.27
  • Resistance levels: 111.62, 112.19

The main trend of the USD/JPY currency pair is bullish. The MACD indicator became positive, and there are signs of buyer’s initiative. Under such market conditions, it’s better to look for buy positions from the support levels near the moving average. Sell positions should be considered only throughout the day from the resistance levels, given there is sellers’ initiative.

Alternative scenario: if the price falls below 110.45, the uptrend is likely to be broken.

USD/JPY
News feed for 2021.10.05:
  • – Japan Tokyo Core Consumer Price Index at 02:30 (GMT+3).

The USD/CAD currency pair

Technical indicators of the currency pair:
  • Prev Open: 1.2639
  • Prev Close: 1.2587
  • % chg. over the last day: -0.41%

The Canadian dollar is a commodity currency, so USD/CAD is highly dependent on the dynamics of the dollar index and oil prices. The dollar index slightly decreased yesterday while the oil prices jumped. As a result, the USD/CAD quotes sharply decreased due to the strengthening of the Canadian currency.

Trading recommendations
  • Support levels: 1.2611, 1.2565, 1.2518, 1.2425
  • Resistance levels: 1.2729, 1.2774, 1.2891

From the technical point of view, the trend of the USD/CAD currency pair is bearish. The MACD indicator has become inactive. Yesterday, the price broke down through the support level but came back above the level at the Asian session, forming a false breakdown zone below. Under such market conditions, it is better to look for sell deals from the resistance levels near the moving average. Buy deals should be considered from the false breakdown zone but with short targets.

Alternative scenario: if the price breaks out through the 1.2774 resistance level and fixes above, the uptrend will likely resume.

USD/CAD
There is no news feed for today.

by JustForex


This article reflects a personal opinion and should not be interpreted as an investment advice, and/or offer, and/or a persistent request for carrying out financial transactions, and/or a guarantee, and/or a forecast of future events.