
Article By RoboForex.com
EURUSD, “Euro vs US Dollar”
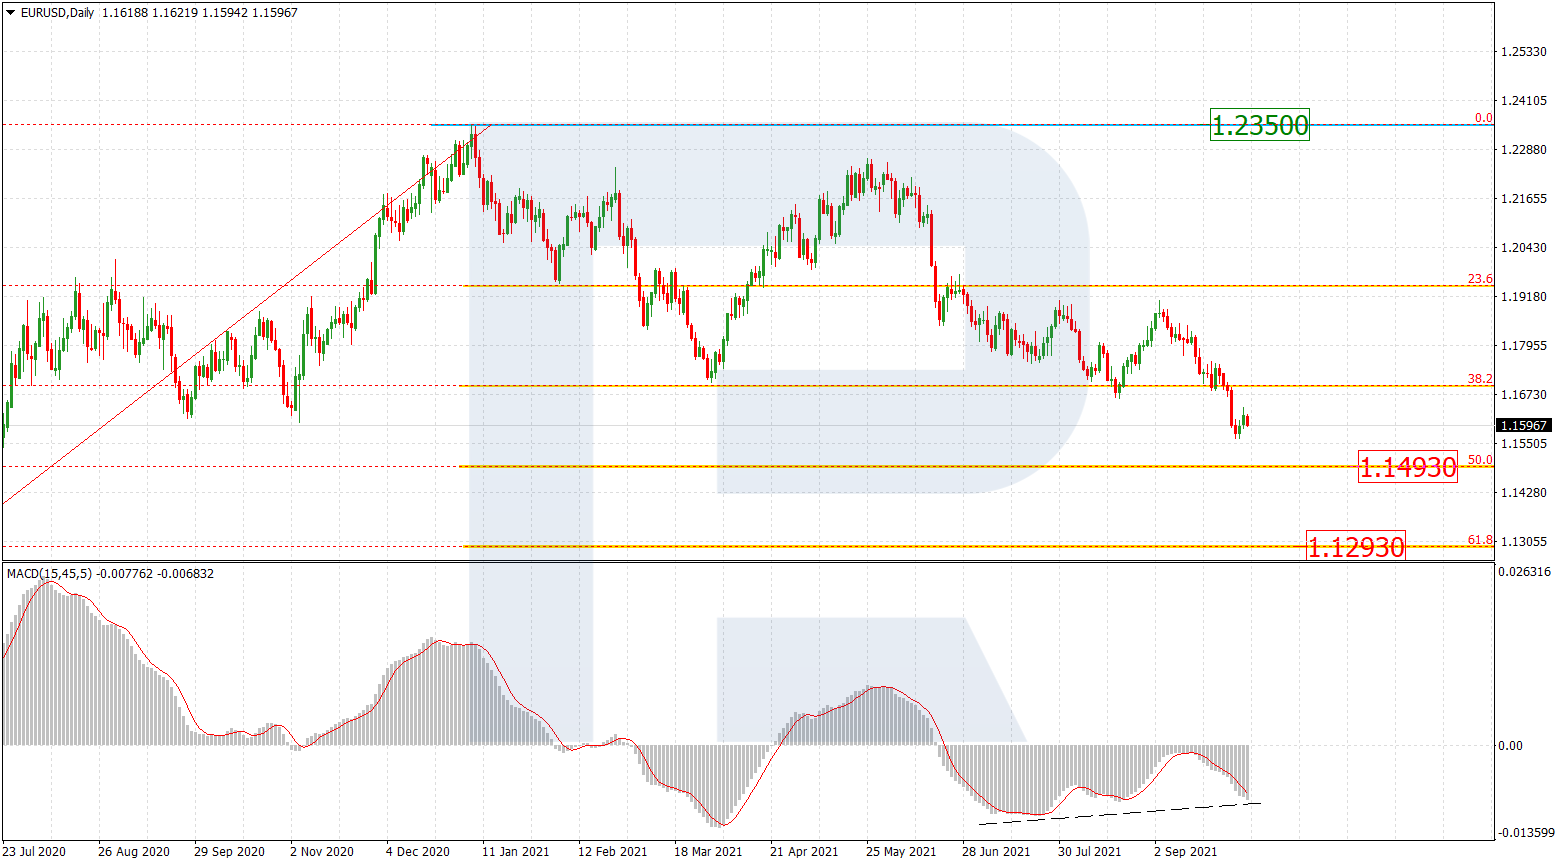
As we can see in the daily chart, EURUSD is forming a steady descending wave towards the long-term 50.0% fibo at 1.1493. Of course, this decline may continue down to 61.8% fibo at 1.1293 but convergence on MACD may hint at a possible reversal. If it happens, the asset may resume moving upwards to update the high at 1.2350.

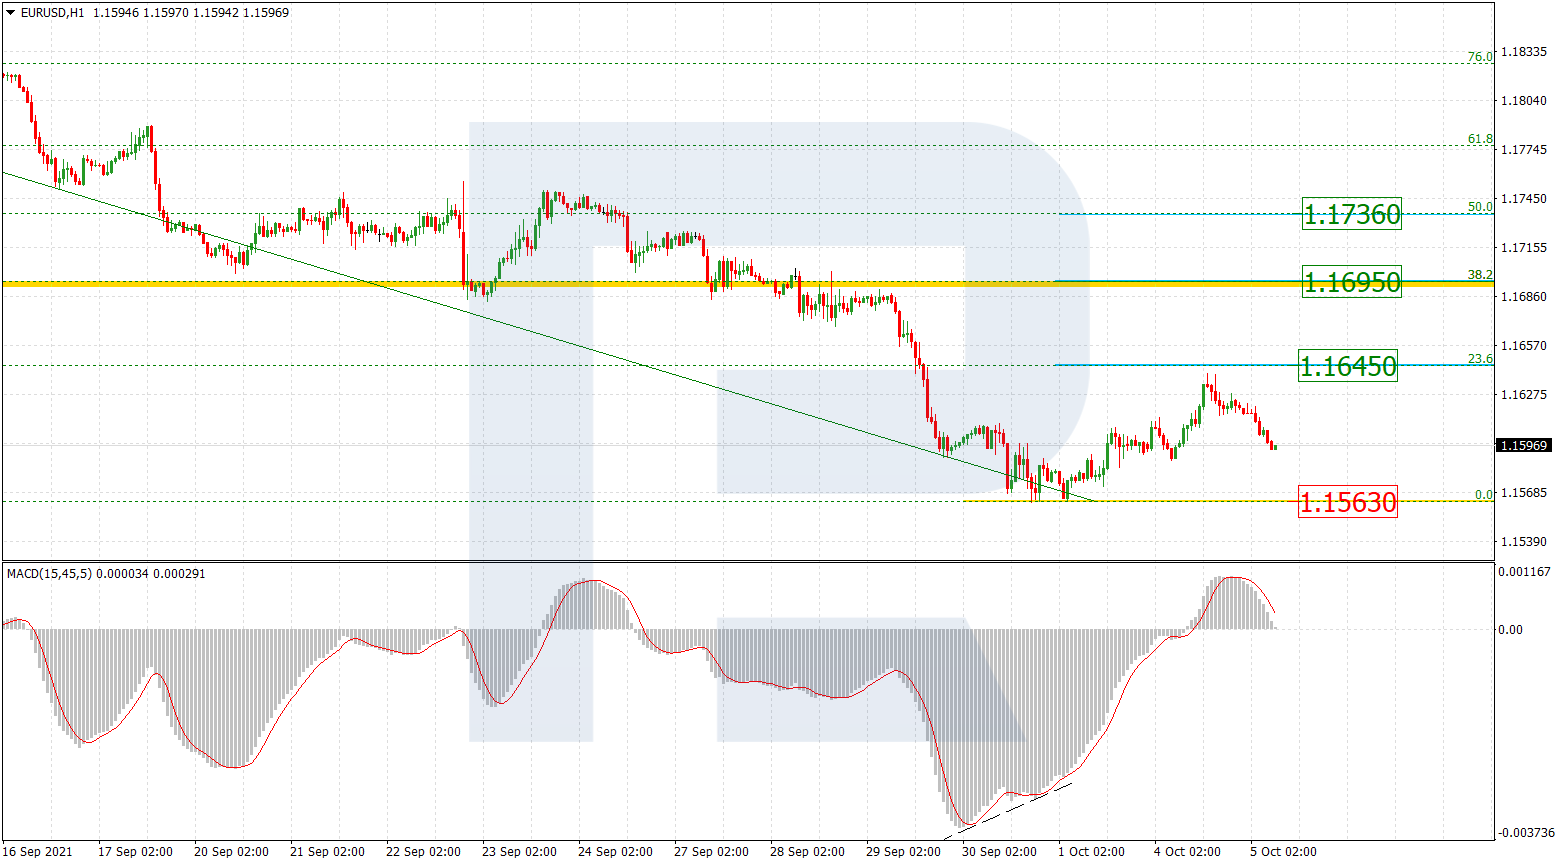
The H1 chart shows the start of a short-term correction after local convergence on MACD. The first rising wave tried to test 23.6% fibo at 1.1645 but failed and transformed into a new decline towards the low at 1.1563. However, the low hasn’t been broken yet. If the pair rebounds from this level, the asset may extend the correction up to 38.2% and 50.0% fibo at 1.1695 and 1.1736 respectively. On the other hand, a breakout of the low will lead to a further downtrend.
Free Reports:
 Download Our Metatrader 4 Indicators – Put Our Free MetaTrader 4 Custom Indicators on your charts when you join our Weekly Newsletter
 Get our Weekly Commitment of Traders Reports - See where the biggest traders (Hedge Funds and Commercial Hedgers) are positioned in the futures markets on a weekly basis.
USDJPY, “US Dollar vs. Japanese Yen”
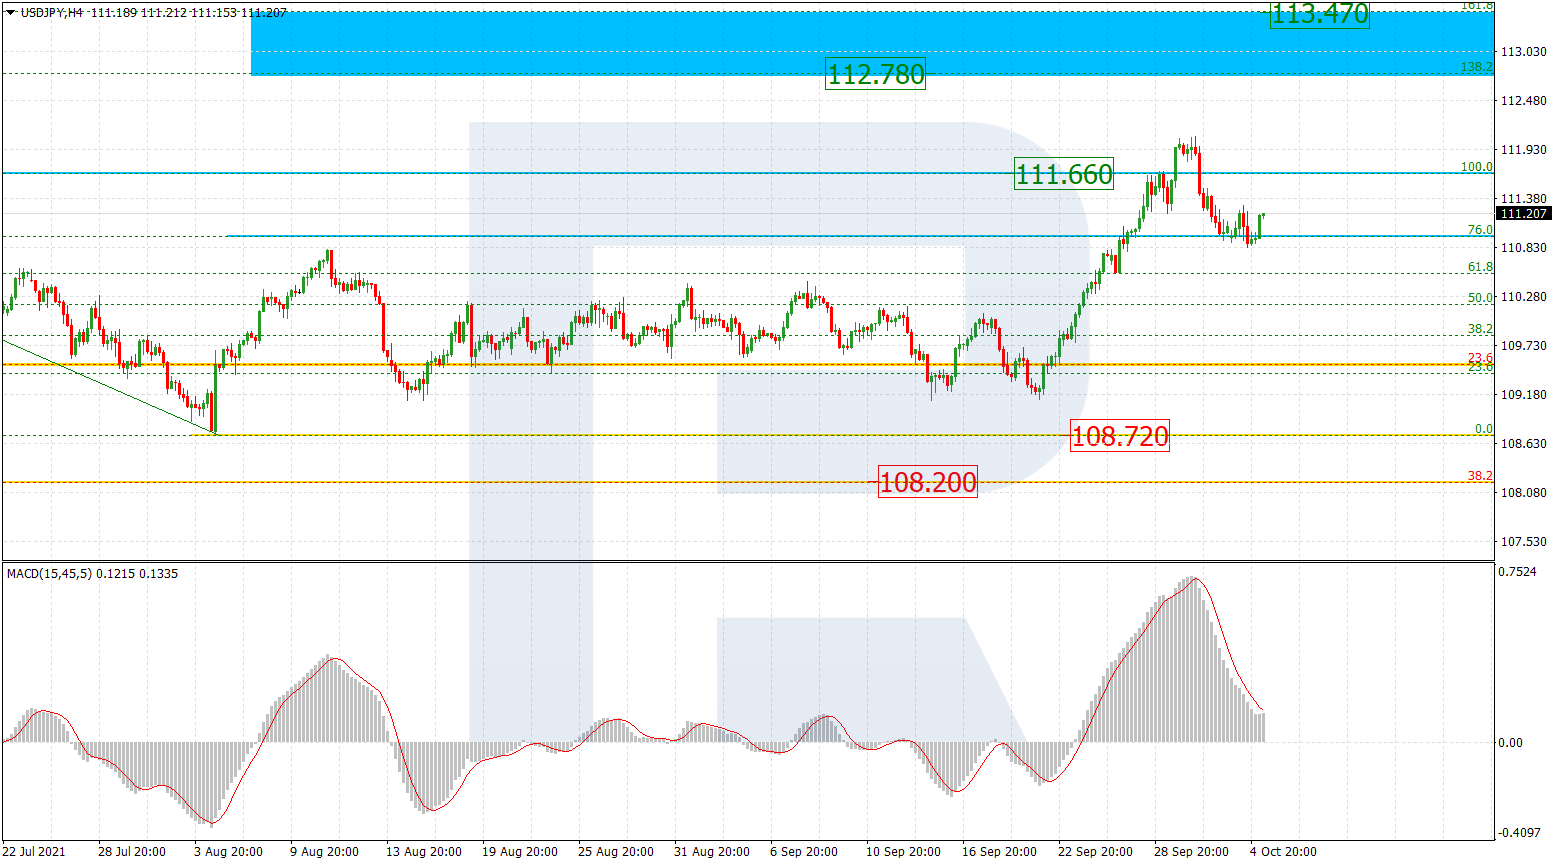
As we can see in the H4 chart, USDJPY is correcting downwards after breaking the high at 111.66. After finishing the pullback, the asset may continue growing towards the post-correctional extension area between 138.2% and 161.8% fibo at 112.78 and 113.47 respectively. The support is the local low at 108.72.
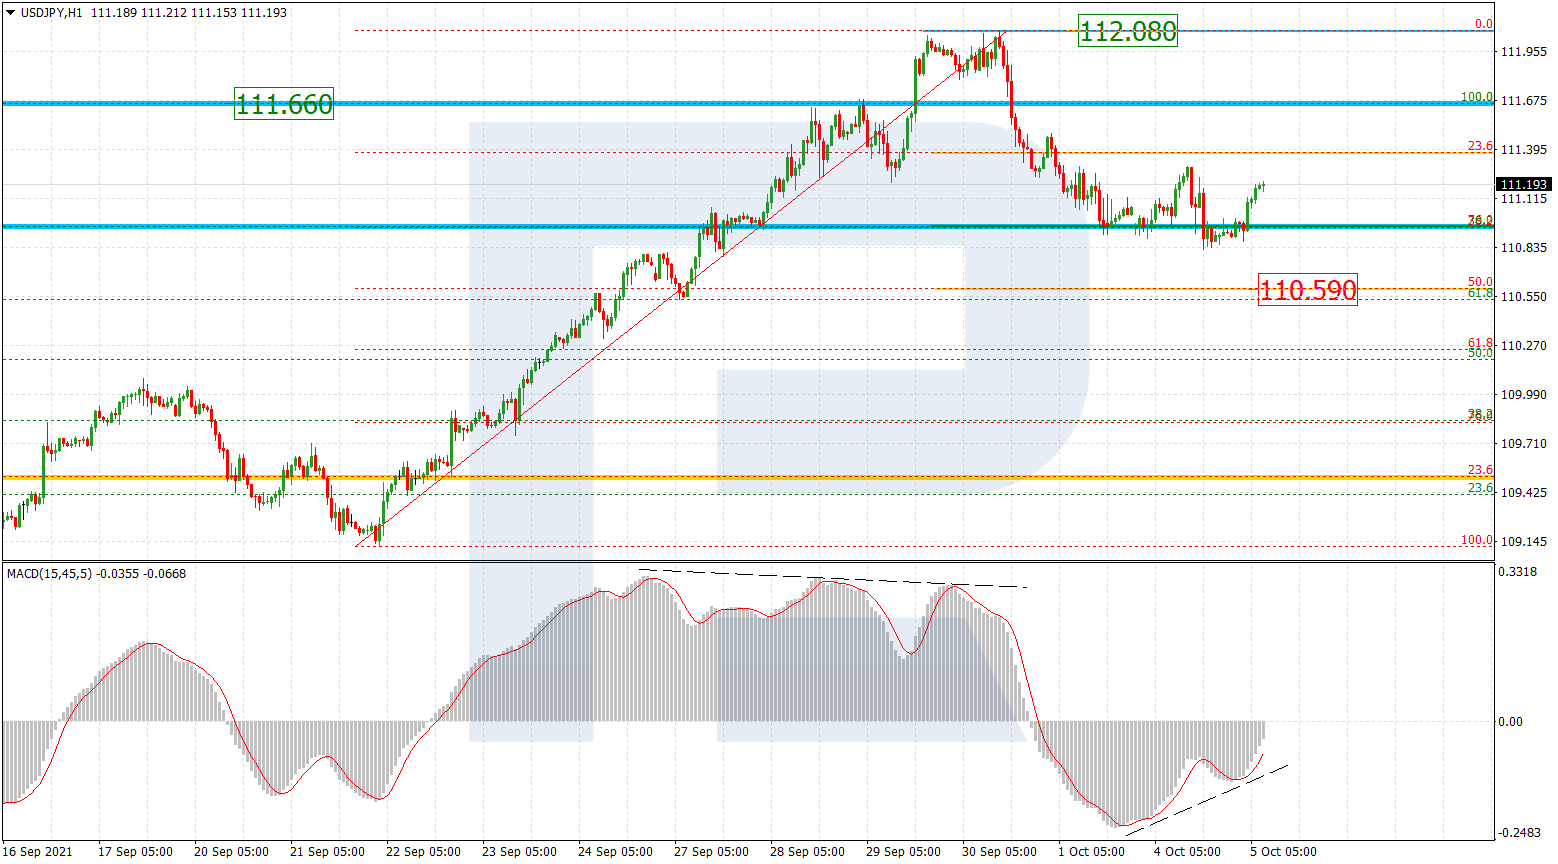
The H1 chart shows a more detailed structure of the current descending correction after divergence on MACD. The pair has reached 38.2% fibo and may yet continue falling towards 50.0% fibo at 110.59. At the same time, convergence on the indicator may hint at a new rising impulse after the asset finishes the pullback.
Article By RoboForex.com
Attention!
Forecasts presented in this section only reflect the author’s private opinion and should not be considered as guidance for trading. RoboForex LP bears no responsibility for trading results based on trading recommendations described in these analytical reviews.

- COT Metals Charts: Weekly Speculator Bets led by Copper & Steel Jul 18, 2026
- COT Bonds Charts: Weekly Speculator Bets led by 2-Year, SOFR 3M & 5-Year Bonds Jul 18, 2026
- COT Energy Charts: Weekly Speculator Bets led by Brent Oil & Heating Oil Jul 18, 2026
- COT Soft Commodities Charts: Weekly Speculator Bets led by Wheat, Corn & Soybean Meal Jul 18, 2026
- The Bank of Canada kept its interest rate unchanged. Platinum prices reached a three‑week high Jul 16, 2026
- Stock indices rose after the release of US inflation data. China’s GDP slowed sharply Jul 15, 2026
- GBP/USD Awaits Political News: What Will Happen Next Jul 15, 2026
- USD/JPY Holds at Highs: Pressure Lingers on Yen Jul 14, 2026
- Oil prices jumped 4% amid a new wave of escalation between the US and Iran Jul 13, 2026
- EUR/USD: US Inflation Will Determine Everything Jul 13, 2026
