UK Inflation And BOE Rate Hike

By Orbex

Analysts have speculated for a long time that the BOE would be the first of the major central banks to raise rates. Lately, that has come into focus as the bank’s rhetoric shifted from talking about employment to talking about inflation.

Despite the UK having relatively low CPI change, it’s still above target. And the BOE at no point pledged to tolerate higher inflation to compensate for prior deflation.

Yesterday, money markets adjusted to an expectation that the BOE would raise rates at their December meeting.

There is only one more meeting before that, and the consensus is that the BOE will likely offer some kind of advance warning that a hike is coming. This means there is a lot of anticipation building up ahead of the November 4th meeting.

What we’re looking for

Naturally, that means a lot of focus is on the upcoming data releases.

Tomorrow’s inflation data will be the last before the next BOE meeting, so investors are likely to pay a lot of attention to it. Not only could there be an immediate reaction in the market, but the results could pave the way for the market trend for the rest of the month.

Economists anticipate that the annual Headline Inflation will remain at last month’s level of 3.2%. That’s well above the 2.0% target of the BOE.

However, the central bank focuses on the core inflation rate. This figure discounts the price changes in food and energy, and it’s one of the major price drivers as of late in the UK.

Where the complication could lie

Economists expect the annual Core CPI change to show a slight decrease to 3.0% from 3.1%. Of course, that’s still way above target.

A trend towards the downside could be an indication that inflation isn’t as transitory as the BOE expects it to be. This would reduce the pressure on the bank to act quickly. And in turn, they might consider holding off on raising rates for a little while longer to continue to support the economy.

Nonetheless, the monthly change in inflation might be the deciding factor because it’s a “faster” indicator showing what’s going on right now. This is contrary to the annual comparisons, which consider the change in prices compared to a year ago. Monthly inflation could drop to 0.4% from 0.7%, a notable deceleration.

Putting the pieces together

The market has priced in these expectations, so the question is: what could happen if these projections don’t pan out?

If we see a marked reduction in the inflation rate it could lead investors to adjust their expectations for a later rate hike. And this would imply a weaker pound and support for the stock market.

On the contrary, the expected drop in near-term inflation might not manifest, or worse, actually accelerate. That would likely affirm the market’s expectation that the BOE will raise rates, and push the pound higher.

However, there is a pretty strong consensus that a rate hike won’t come as a surprise. So, it’s unlikely that the market will move up expectations of a rate hike to November.


Orbex-LogoArticle by Orbex

Orbex is a fully licensed broker that was established in 2011. Founded with a mission to serve its traders responsibly and provides traders with access to the world’s largest and most liquid financial markets. www.orbex.com

Fibonacci Retracements Analysis 19.10.2021 (EURUSD, USDJPY)

Article By RoboForex.com

EURUSD, “Euro vs US Dollar”

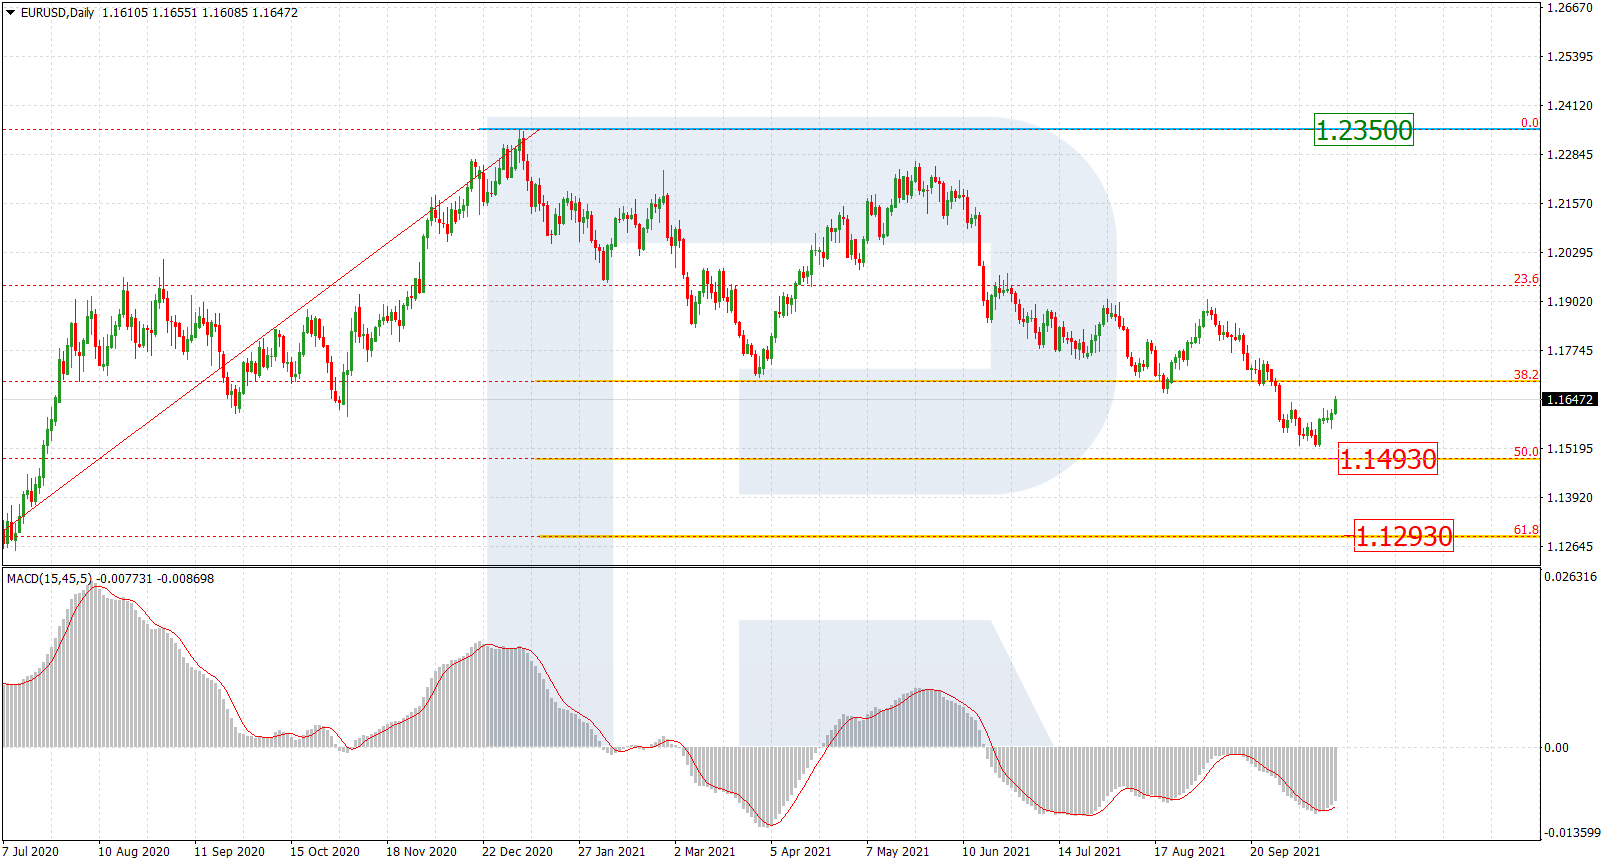
The daily chart of EURUSD shows that after finishing the “bearish” phase close to 50.0% fibo at 1.1493, the asset is starting a new movement to the upside. Convergence on MACD says this movement may be both a correction and a reversal to break the high at 1.2350. After the pullback is over, the pair may resume moving downwards to reach 50.0% and 61.8% fibo at 1.1493 and 1.1293 respectively.

EURUSD_D1
Risk Warning: the result of previous trading operations do not guarantee the same results in the future

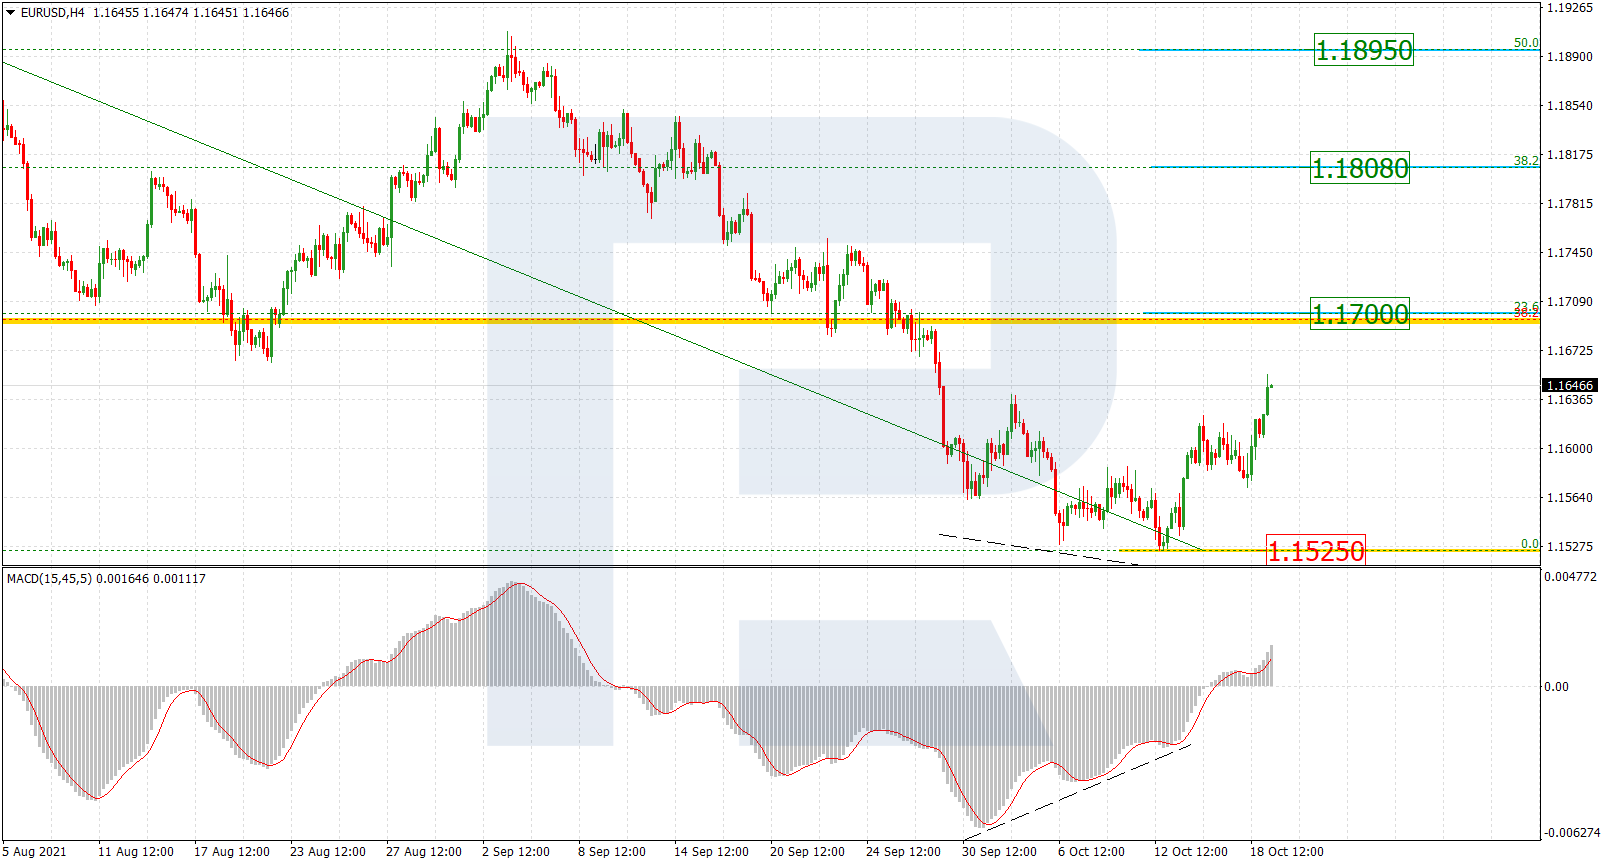
The H1 chart shows the potential correctional targets after local convergence on MACD – 23.6%, 38.2%, and 50.0% fibo at 1.1700, 1.1808, and 1.1895 respectively. On the other hand, a breakout of the low at 1.1529 will lead to a further downtrend.

EURUSD_H4
Risk Warning: the result of previous trading operations do not guarantee the same results in the future

USDJPY, “US Dollar vs. Japanese Yen”

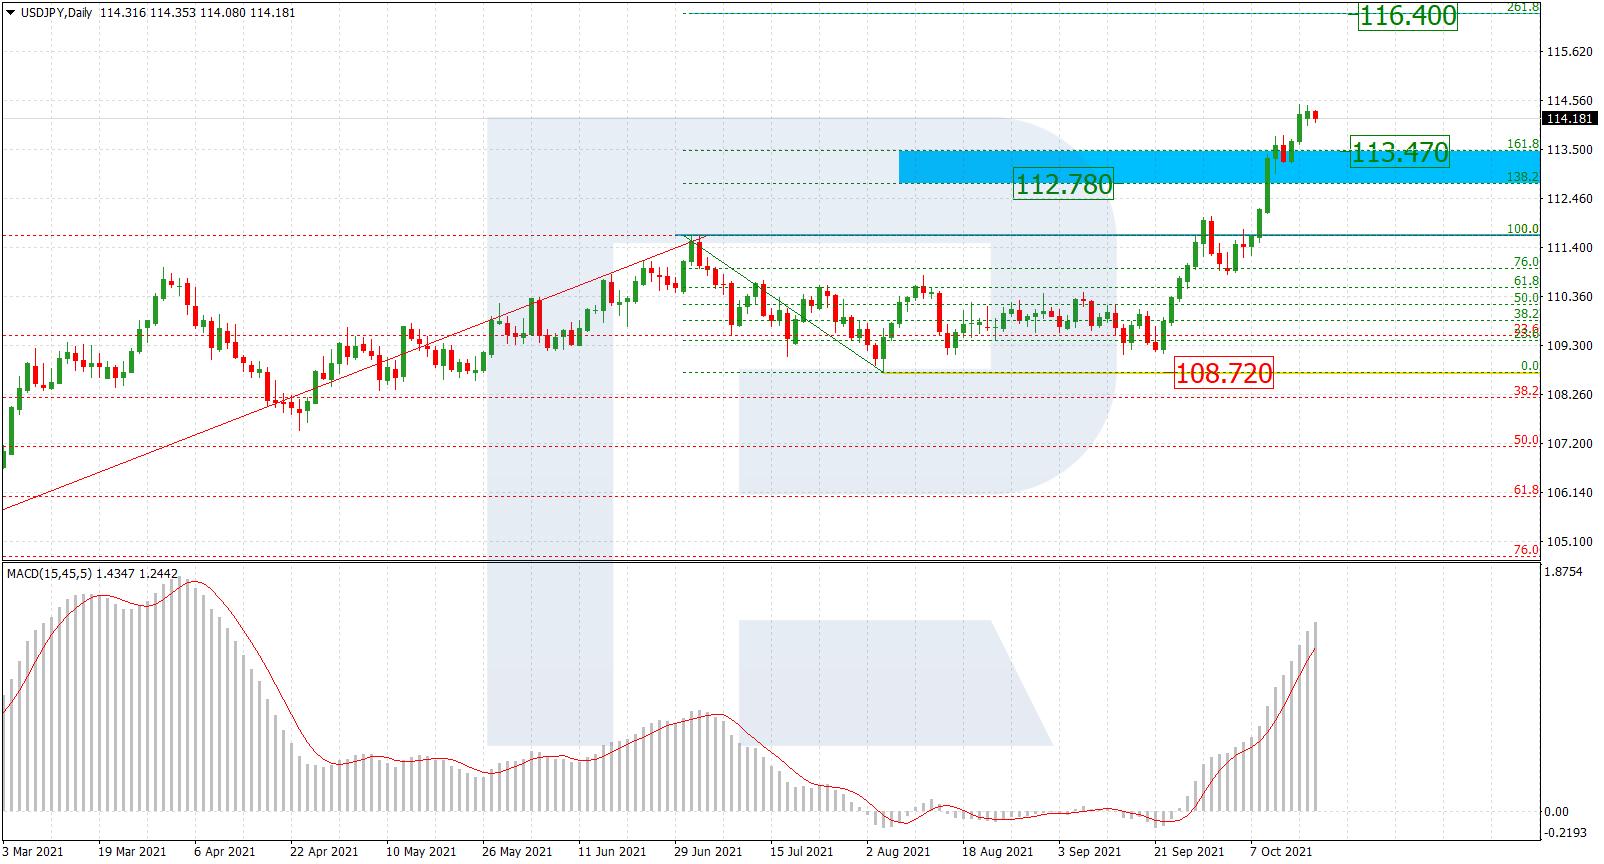
As we can see in the daily chart, USDJPY is forming a wave to the upside; it has already broken the post-correctional extension area between 138.2% and 161.8% fibo at 112.78 and 113.47 respectively and is currently heading towards 261.8% fibo at 116.40. The support is still the local low at 108.72.

USDJPY_D1
Risk Warning: the result of previous trading operations do not guarantee the same results in the future

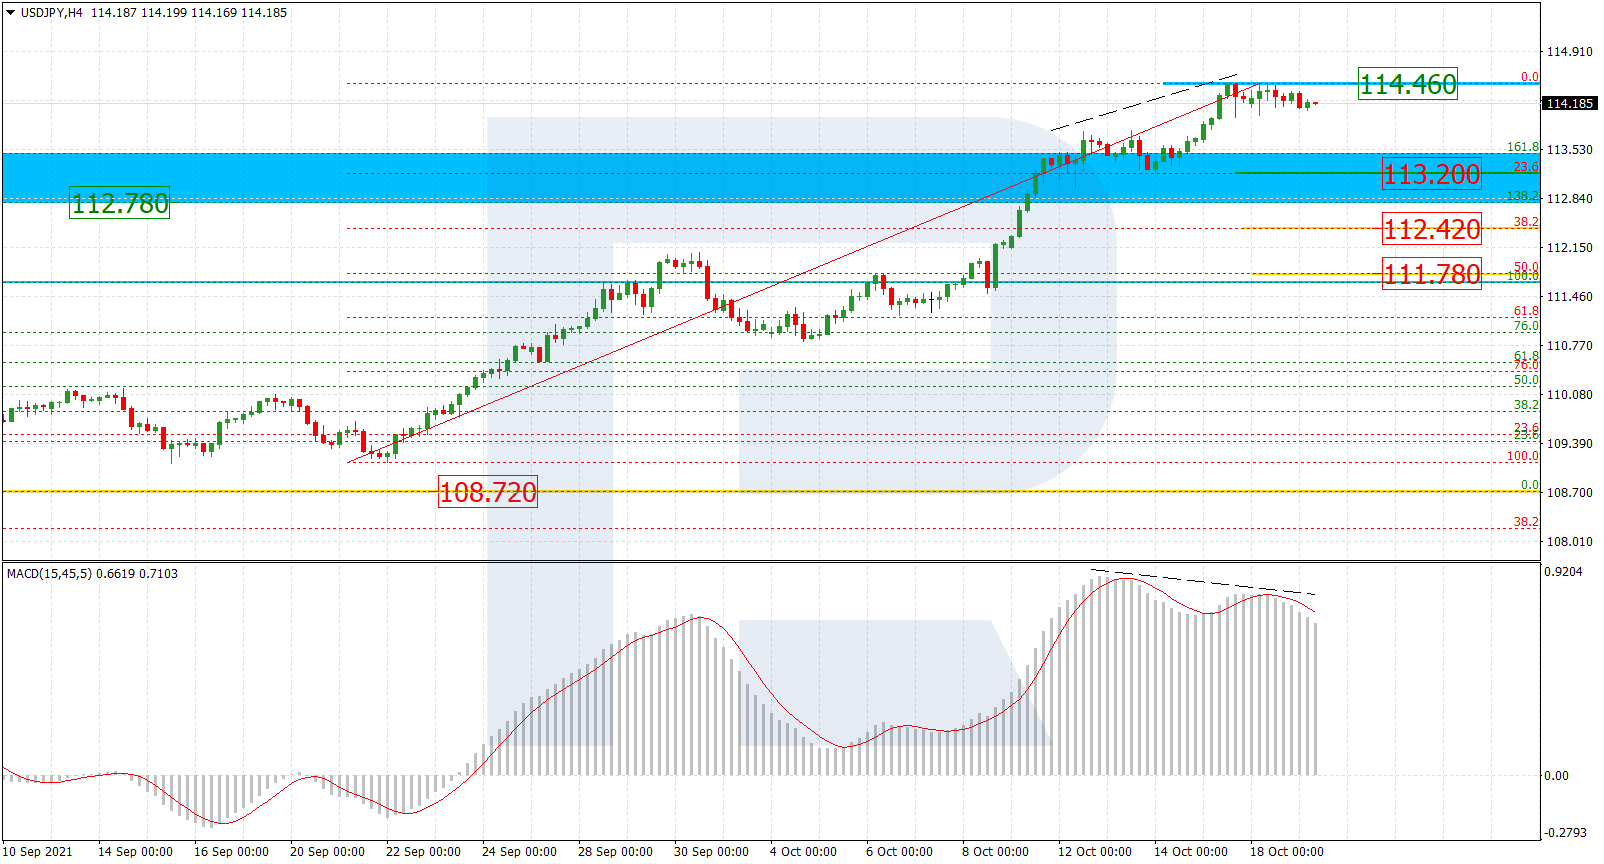
The H4 chart shows divergence on MACD, which may indicate a possible descending correction soon towards 23.6%, 38.2%, and 50.0% fibo at 113.20, 112.42, and 111.78 respectively. The key resistance here is the high at 114.46.

USDJPY_H4

Article By RoboForex.com

Attention!
Forecasts presented in this section only reflect the author’s private opinion and should not be considered as guidance for trading. RoboForex LP bears no responsibility for trading results based on trading recommendations described in these analytical reviews.

The Analytical Overview of the Main Currency Pairs on 2021.10.19

by JustForex

The EUR/USD currency pair

Technical indicators of the currency pair:
  • Prev Open: 1.1591
  • Prev Close: 1.1610
  • % chg. over the last day: +0.16%

Germany is considering ending the state of emergency on November 25. Germany’s inflation has risen rapidly in recent months, so the country needs to improve its economic climate. At its September meeting, the ECB postponed several important decisions until December. Still, since then, rising energy prices have pushed Eurozone inflation to a 13-year high of 3.4% in annual terms, and analysts expect it to continue rising.

Trading recommendations
  • Support levels: 1.1615, 1.1548, 1.1502, 1.1453
  • Resistance levels: 1.1671, 1.1717, 1.1772, 1.1802, 1.1835

From the technical point of view, the EUR/USD trend on the hour timeframe has changed to bullish. In the Asian session, the price confidently broke through the priority change level. But the MACD indicator is already showing signs of the buyer’s weakness. Under such market conditions, traders should consider buying positions from the support levels near the moving average or the buyer’s initiative areas. It is best to look for sell trades from the resistance levels of the higher timeframe.

Alternative scenario: if the price breaks down through the 1.1548 support level and fixes below, the mid-term uptrend will likely be broken.

EUR/USD
News feed for 2021.10.19:
  • – US Building Permits (m/m) at 15:30 (GMT+3);
  • – US FOMC Member Daly Speaks at 18:00 (GMT+3);
  • – US FOMC Member Bostic Speaks at 21:50 (GMT+3).

The GBP/USD currency pair

Technical indicators of the currency pair:
  • Prev Open: 1.3747
  • Prev Close: 1.3728
  • % chg. over the last day: +0.14%

The number of British power companies that have gone bankrupt since early September amid soaring natural gas prices has reached 13. Today investors will closely follow the speech of the head of the Bank of England. According to JPMorgan, the Bank of England will raise the interest rate by 15 bps in November and by another 25 bps in February and in August next year.

Trading recommendations
  • Support levels: 1.3685, 1.3617, 1.3584, 1.3532, 1.3457, 1.3360, 1.3282
  • Resistance levels: 1.3772, 1.3812, 1.3886

On the hourly time frame, the GBP/USD trend is bullish. The British pound is strengthening due to its direct correlation with oil prices and the weakness of the dollar index. The MACD indicator is in the positive zone, but there are the first signs of buyer’s weakness. Buy trades should be considered only within the day and only from the initiative zone of the buyers. It is better to look for sell deals from the resistance levels, but after an additional confirmation in the form of a sellers’ initiative, because the buyers’ pressure is higher now.

Alternative scenario: if the price breaks down through the 1.3532 support level and consolidates below, the bullish scenario is likely to be broken.

GBP/USD
News feed for 2021.10.19:
  • – UK BoE Gov Bailey Speaks at 15:05 (GMT+3).

The USD/JPY currency pair

Technical indicators of the currency pair:
  • Prev Open: 114.16
  • Prev Close: 114.31
  • % chg. over the last day: +0.13%

Several representatives of the Bank of Japan said that the current stimulative monetary policy should be maintained for a longer period, as the Japanese economy is not coping as well as other advanced economies in the aftermath of the pandemic. That is a negative signal for the JPY since with the US Fed cutting its stimulus program soon, the dollar index might increase, which would lead the USD/JPY currency pair to grow further.

Trading recommendations
  • Support levels: 113.66, 113.25, 112.19, 111.53, 110.99, 110.65, 109.95, 109.63
  • Resistance levels: 114.40

The main trend of the USD/JPY currency pair is bullish. The price is trading flat, and a triangle pattern is forming. The MACD indicator has become inactive. However, there is still a divergence in higher time frames, which means that growth is limited, and correction is expected soon. Under such market conditions, it’s better to look for buy positions from the support levels near the moving average since the price has deviated greatly from the average line. Sell positions should be considered only throughout the day from the resistance levels, given there is sellers’ initiative.

Alternative scenario: if the price falls below 112.19, the uptrend is likely to be broken.

USD/JPY
There is no news feed for today.

The USD/CAD currency pair

Technical indicators of the currency pair:
  • Prev Open: 1.2367
  • Prev Close: 1.2377
  • % chg. over the last day: +0.08%

The Canadian dollar is a commodity currency, so USD/CAD is highly dependent on the dynamics of the dollar index and oil prices. Both the dollar index and oil prices declined yesterday. As a result, the USD/CAD currency pair remained approximately at the same level.

Trading recommendations
  • Support levels: 1.2340
  • Resistance levels: 1.2425 1.2518, 1.2565, 1.2628, 1.2729, 1.2774

From the technical point of view, the trend of the USD/CAD currency pair is bearish. But the price has reached the daily support level. The MACD indicator has become inactive, but there are still signs of divergence on higher time frames. Under such market conditions, it is better to look for sell deals from the resistance levels near the moving average. Buy trades should be considered only on lower time frames from the support levels if there is the buyer’s initiative.

Alternative scenario: if the price breaks out through the 1.2518 resistance level and fixes above, the uptrend will likely resume.

USD/CAD
There is no news feed for today.

by JustForex


This article reflects a personal opinion and should not be interpreted as an investment advice, and/or offer, and/or a persistent request for carrying out financial transactions, and/or a guarantee, and/or a forecast of future events.

Q4 2021 Elliott Wave Market Outlook Report – The Deciding Quarter

By Orbex

As the world prepares itself for winter and the deciding quarter of 2021, uncertainty continues to dominate the markets due to the Delta variant.

If infection rates spike again and restrictive measures ensue, will booster shots get us through the colder weather?

Meanwhile, inflation fears are spreading across the globe, and investors are hoping that Q4 provides clues on central bank monetary policy in the near future.

So, how will the central banks of the world handle the uncertainty moving forward?

And are the markets heading for a sell-off?

The Orbex Research Team dives deep into all these questions and more in the highly anticipated Q4 2021 edition of our Elliott Wave Quarterly Market Outlook Reports.

Special focus will be on:

  • FX Majors
  • Indices
  • Commodities
  • Metals
  • Stocks
  • Energies

Our quarterly reports are a holy grail for traders everywhere, providing invaluable fundamental and technical insights delivered by a seasoned research team.

David Kindley – Market Strategist
Mohammed Mariri – Head of Training & Market Strategy
Roman Onegin – Elliott Wave Specialist
Daniel John Grady – Macroeconomist

So wait no longer – the Q4 2021 Market Outlook Report is ready for the taking!

Download your free copy now!


Orbex-LogoArticle by Orbex

Orbex is a fully licensed broker that was established in 2011. Founded with a mission to serve its traders responsibly and provides traders with access to the world’s largest and most liquid financial markets. www.orbex.com

Supply chain problems hamper global economic growth

by JustForex

The US stock market traded yesterday without a single dynamic. At the close of the stock market, the Dow Jones index decreased by 0.10%, the S&P 500 index increased by 0.34%, and the NASDAQ index added 0.84%. The technology sector and the consumer cyclical sector were the leaders. The health care and utility sectors were the fallers. The US industrial production declined as the ongoing global shortage of semiconductors reduced auto production, further evidence that supply constraints hamper economic growth.

Guggenheim Global Chief Investment Officer Scott Minerd said yesterday that the stock market could jump more than 10% over the next year as risks from inflation or rising interest rates are limited. For this reason, individual investors and funds are buying into falling stocks, despite the obvious macroeconomic problems.

A new insider trading scandal is brewing in the United States. According to SEC reports, Federal Reserve Chairman Jerome Powell sold between $1 million and $5 million of stocks from his personal account on October 1, 2020. This sale occurred just before the Dow Jones Index declined significantly. Recall that three other top Fed officials faced heavy criticism for making stock trades during the pandemic. Dallas Fed President Robert Kaplan and Boston Fed President Eric Rosengren were suspended due to the disclosure of their trades. Fed Vice Chairman Richard Clarida has also been criticized for stock trading. Other trades are currently under investigation by the Fed’s inspector general and the SEC.

Data from the Federal Reserve show that the wealthiest 10% of Americans own 89% of all stocks in the United States.

European stock indices closed yesterday in the red zone. German DAX decreased by 0.72%, British FTSE 100 lost 0.42%, French CAC 40 fell by 0.81%, Italian FTSE MIB and Spanish IBEX 35 lost 0.83% and 0.68%, respectively. The market is under pressure from high inflation in the region, the energy crisis, supply chain problems, rising commodity prices, and declining real estate market activity.

The number of British energy companies that have gone bankrupt since the beginning of September amid soaring natural gas prices has reached 13. As the UK Gas and Electricity Markets Authority reported, Goto Energy, Pure Planet, Colorado Energy, and Daligas left the market last week.

According to a Deutsche Bank survey, many investors expect the US Federal Reserve and the European Central Bank to keep a softer monetary policy for much longer.

German digital bank N26 raised $900 million in a new funding round valued at $9 billion, thereby overtaking the country’s second-largest bank, Commerzbank, in terms of capitalization.

Oil prices fell slightly yesterday due to a slowdown in economic growth in China and weak US industrial production data. According to Bloomberg, OPEC+ countries produced 15% less oil in September than planned initially. If oil prices do not fall, the union could face political pressure. The White House continues to press OPEC members to solve the oil supply problem. Some traders are betting that Brent crude will hit a record $200 a barrel by December 2022, according to QuikStrike.

Asian stock indexes mostly rose on Tuesday. Japan’s Nikkei 225 added 0.68%, the China A50 increased by 1.14%, while the Australian ASX 200 fell by 0.08%. Asian investors are following the US colleagues and are buying back declines in stocks, despite many macroeconomic problems in the region. Electricity problems in China appear to be escalating as coal prices rise again to record highs. The latest data showed that fuel supplies fell in September, heightening fears that domestic production may not be able to meet the growing electricity demand.

Main market quotes:

S&P 500 (F) 4,486.46 +15.09 (+0.34%)

Dow Jones 35,258.61 −36.15 (−0.10%)

DAX 15,474.47 −112.89 (−0.72%)

FTSE 100 7,203.83 −30.20 (−0.42%)

USD Index 93.97 +0.03 (+0.03%)

Important events for today:
  • – Australia RBA Meeting Minutes (m/m) at 03:30 (GMT+3);
  • – UK BoE Gov Bailey Speaks at 15:05 (GMT+3);
  • – US Building Permits (m/m) at 15:30 (GMT+3);
  • – US FOMC Member Daly Speaks at 18:00 (GMT+3);
  • – US FOMC Member Bostic Speaks at 21:50 (GMT+3).

by JustForex


This article reflects a personal opinion and should not be interpreted as an investment advice, and/or offer, and/or a persistent request for carrying out financial transactions, and/or a guarantee, and/or a forecast of future events.

Markets show recovery as currencies consolidate

By Admiral Markets

The world’s reserve currency maintained its consolidative mood last week and moved around 12-month highs, although it briefly broke higher on Wednesday, when it reached its highest point since late September 2020. Overall, the US dollar continues to buck the general trend of high risk appetite in financial markets.

USD

US economic data was good. The country’s September retail sales were 14.0% higher than in the same period a year earlier. There is a lot of discussion in the market about disruptions in supply chains, which are partially reducing the availability of goods. One example of this, the car manufacturer Toyota reported an expected -15% drop in November production volumes due to a shortage of components. Another important data point was the September headline inflation rate, which stood at 5.4% year-on-year and has remained stable above the 5% level for the 4th month in a row. Contrary to what the central bank has been communicating, inflation is not retreating and remains high, and the shelter component is a significant contributor to this trend, which has shown a consistent recovery since the beginning of the year and accounts for as much as a third of the overall inflation index. The producer price index was also published, which rose by 8.6% year-on-year and recorded another new cycle high, suggesting that inflationary pressures from this sector are persisting and will continue to spill over to the rest of the economy. In the labour market, the shortage of workers remains severe, with the number of open positions at 10.44 million, only marginally retreating from historical highs. The number of new jobless claims fell further from 0.326 million to 0.293 million during the week.

The pandemic trend showed positive signs and the weekly average of global new cases fell from 408 to 402 thousand per day. Continental trends remained unchanged, with North America showing a -14% weekly decrease, Asia -8% and South America -19%, but Europe continued to grow and increased by +12% during the week. In the US, the data showed further improvement and the average dropped from 87 to 85 thousand per day. The number of vaccinations administered increased from 402 to 405 million, a change of 3 million. Overall in the US, the number of people vaccinated with at least one dose rose from 65.3% to 65.6% of the population, with a weekly increase of 0.3%. In Lithuania, the number of people vaccinated with at least one dose rose from 63.2% to 63.5%, a difference of 0.3%.

Euro

The main currency pair EUR/USD reflected the sentiment of the US dollar and depreciated to the level of 1.153 at the beginning of the week. Later, it recovered its losses and rose to the level of 1.160. Among the economic data in the Old Continent was the industrial production in August, which was 5.1% higher than at the same time a year ago. The ZEW economic sentiment index stood at 21.0 in Europe and 22.3 in Germany, both continuing their steady decline. The EUR/USD pair ended the week trading up 0.2%.

JPY

The most important Asian pair, USD/JPY, continued to show a strong appreciation sentiment, with the pair rising to the 114.2 level, the highest since October 2018. Economic data included the producer price index, which rose by 6.3% year-over-year, and the change in August industrial volumes, which reached 8.8% year-over-year. USD/JPY ended the week’s trading up 1.8%.

GBP

The British pound and US dollar pair showed positive sentiment and appreciated consistently throughout the week, ending trading at 1.375. Important economic data included labour market indicators with the unemployment rate at 4.5% and average earnings rising by 7.2% year-over-year. Industrial production in August was 3.7% higher than a year earlier. GBP/USD ended the week trading up 1.0%.

Economic Events

This week will start with important economic data from China, where economic growth, industrial production and retail sales will be published. This will be followed by US industrial production data on Monday. There are no major releases scheduled for Tuesday, while inflation figures for England and Europe are due on Wednesday. On Thursday, investors will be watching US existing home sales and on Friday Japanese inflation, English retail sales and the preliminary results of the purchasing managers’ index.

According to Admiral Markets market sentiment data, 59% of investors have long positions in EUR/USD (down -8 percentage points compared to last week). In the main Asian pair USD/JPY, 10% of investors have long positions (down -1 percentage point). In GBP/USD, 24% of participants expect a rise (down -22 percentage points). Such market data is interpreted as a contrarian indicator, so that EUR/USD is likely to fall and USD/JPY and GBP/USD to rise. The analysis of positioning data should be combined with fundamental projections and technical analysis.

Sources: bloomberg.com, reuters.com, Admiral Markets MT4 Supreme Edition, investing.com


Trade With MetaTrader 5

INFORMATION ABOUT ANALYTICAL MATERIALS

The given data provides additional information regarding all analysis, estimates, prognosis, forecasts, market reviews, weekly outlooks or other similar assessments or information (hereinafter “Analysis”) published on the websites of Admiral Markets investment firms operating under the Admiral Markets trademark (hereinafter “Admiral Markets”) Before making any investment decisions please pay close attention to the following: 

  • This is a marketing communication. The content is published for informative purposes only and is in no way to be construed as investment advice or recommendation. It has not been prepared in accordance with legal requirements designed to promote the independence of investment research, and that it is not subject to any prohibition on dealing ahead of the dissemination of investment research. 
  • Any investment decision is made by each client alone whereas Admiral Markets shall not be responsible for any loss or damage arising from any such decision, whether or not based on the content. 
  • With view to protecting the interests of our clients and the objectivity of the Analysis, Admiral Markets has established relevant internal procedures for prevention and management of conflicts of interest. 
  • The Analysis is prepared by an independent analyst, Skirmantas Paulavicius (analyst), (hereinafter “Author”) based on their personal estimations. 
  • Whilst every reasonable effort is taken to ensure that all sources of the content are reliable and that all information is presented, as much as possible, in an understandable, timely, precise and complete manner, Admiral Markets does not guarantee the accuracy or completeness of any information contained within the Analysis. 
  • Any kind of past or modeled performance of financial instruments indicated within the content should not be construed as an express or implied promise, guarantee or implication by Admiral Markets for any future performance. The value of the financial instrument may both increase and decrease and the preservation of the asset value is not guaranteed. 
  • Leveraged products (including contracts for difference) are speculative in nature and may result in losses or profit. Before you start trading, please ensure that you fully understand the risks involved.
Avatar-Admirals
Admirals An all-in-one solution for spending, investing, and managing your moneyMore than a broker, Admirals is a financial hub, offering a wide range of financial products and services. We make it possible to approach personal finance through an all-in-one solution for investing, spending, and managing money.

By Admiral Markets

Corporate Earnings To Drive Sentiment

Lukman Otunuga

By Lukman Otunuga Senior Research Analyst, ForexTime

Asian shares were up on Tuesday morning, drawing strength from the tech-driven Wall Street rally overnight. It seems like solid corporate earnings have soothed concerns around inflationary pressures, with the improving risk sentiment elevating equity markets. European markets have opened marginally higher with US futures looking healthy. The Dollar Index (DXY) declined to a one-month low amid the risk-on sentiment while gold is on the move, gaining roughly 0.7% as of writing.

This will a big week for equity markets as the third-quarter earnings season gets in full swing. Since corporate results officially kicked off last week, the reports have painted a positive picture with major US banks smashing analyst forecasts. Big names like Netflix, Tesla and Intel among many others will be under the spotlight this week as investors pay close attention to their earnings.

The key questions on the minds of investors will be what impact higher inflation, supply chain disruptions and labour shortages have on third quarter numbers.  Should we have another solid week of results, this may inject S&P500 bulls with enough confidence to venture into uncharted territory beyond its all-time high.

Currency spotlight – GBPUSD

It has not been a great start to the week for sterling which has weakened against most G10 currencies. Bulls struggled to draw inspiration from Bank of England Governor Andrew Bailey’s hawkish remarks over the weekend with expectations rising over the Bank of England raising interest rates at its November meeting. However, concerns around economic growth and stagflation fears continue to weigh on the pound. All eyes will be on Governor Bailey’s speech this afternoon which could provide more hints on interest rate moves.

Looking at the technical picture, the GBPUSD is up this morning on the back of a weaker dollar. Prices are approaching the 100-day Simple Moving Average around 1.3810. A strong move above this point could push the GBPUSD towards the 200-day Simple Moving Average around 1.3850.

Commodity spotlight – Gold 

Gold prices are advancing this morning, gaining roughly 0.7% thanks to a weaker dollar and lower Treasury yields.  The precious metal is likely to be influenced by conflicting forces this week as investors juggle growth concerns and inflation fears amid prospects of tighter monetary policy.

Should the dollar continue to weaken, gold has the potential to rechallenge $1800, a level just above the 100-day and 200-day Simple Moving Average.  In the meantime, intraday bulls seem to be in the driving seat with the first level of interest at $1784. If the 50-day Simple Moving Average offers resistance and weakens bullish momentum, prices could decline back towards $1760.

Disclaimer: The content in this article comprises personal opinions and should not be construed as containing personal and/or other investment advice and/or an offer of and/or solicitation for any transactions in financial instruments and/or a guarantee and/or prediction of future performance. ForexTime (FXTM), its affiliates, agents, directors, officers or employees do not guarantee the accuracy, validity, timeliness or completeness, of any information or data made available and assume no liability as to any loss arising from any investment based on the same.


Forex-Time-LogoArticle by ForexTime

ForexTime Ltd (FXTM) is an award winning international online forex broker regulated by CySEC 185/12 www.forextime.com

Trade Of The Week: Will Earnings Push S&P500 To Record Highs?

Lukman Otunuga

By Lukman Otunuga Senior Research Analyst, ForexTime

A solid start to third-quarter 2021 earnings and some upbeat US economic data injected S&P500 bulls with renewed confidence last week.

The Index is up 2.8% since last Wednesday when earnings season officially kicked off with bulls clearly in a position of power ahead of another eventful week for US equity markets. Regardless of recent gains, the S&P500 is certainly not out of the woods yet. Let’s not forget that over the past few weeks, fears over slowing global growth, supply disruptions, inflationary pressures, and prospects of tighter monetary policy left investors jittery. This anxiety weighed on risk sentiment with the S&P 500 shedding almost 4.8% in September.

Nevertheless, third-quarter earnings may encourage investors to redirect their focus back towards company fundamentals while providing some key insights on the most important issues impacting corporate earnings.

The big question on the mind of many investors is: what effect rising inflation, supply chain disruptions, and labour shortages will have on earnings?

Big Week, Big Names, Big Gains?

With third-quarter earnings season in full swing, volatility may be the name of the game for the S&P500.

So far so good, earnings have painted an encouraging picture with big banks smashing analyst forecasts.

Financial heavyweights like JPMorgan, Bank of America, Morgan Stanley, Goldman Sachs, and Citigroup topped expectations last week.

Over the next few days, a cavalry of companies will be reporting their earnings with big names such as Johnson & Johnson, Netflix, Tesla, and Intel Corp among many others under the spotlight. If earnings from the majority of companies smash analyst estimates this week, the S&P500 has the potential to push higher with bulls aiming for fresh 2021 highs. Alternatively, a disappointing set of earnings may cap upside gains with the index slipping back towards the 100-day Simple Moving Average around 4380.

Keep An Eye On Economic Fundamentals 

After seeing how the S&P500 reacted to the positive US retail sales report last Friday, it may be a good idea to closely watch how the index reacts to data this week.

Interestingly, the US economic calendar is fairly light this week with weekly initial jobless claims on Thursday and October PMI’s on Friday. Should the pending data uplift investor sentiment, boost confidence over the US economy, and fuel risk appetite, this may inspire S&P500 bulls to push prices higher.

However, if the data ends up boosting taper expectations or sparking discussions around the Federal Reserve raising interest rates sooner than expected – this could weigh on the S&P500. Especially if Treasury yields rise.

Markets expecting a strong earnings quarter 

According to data from FactSet, third-quarter profit growth could total 30% which would be the third-highest quarterly profit growth rate for the S&P500 since 2010.

This sounds encouraging and may instill S&P500 bulls with renewed confidence if expectations match reality. However, concerns still linger over what impact supply chain disruptions may have on earning growth.

S&P500 charges above 50-day SMA 

After concluding last week above its 50-day Simple Moving Average, it looks like bulls are back in business. Prices are pushing higher on the daily timeframe with 4490-4500 acting as minor resistance. A breakout above these regions may inspire an incline towards the 2021 high at 4551.4. Beyond this point are uncharted territories yet to be claimed. Alternatively, a move back below the 50 -day Simple Moving Average could signal a decline towards the 100-day Simple Moving Average at 4380 and 4300, respectively.

Disclaimer: The content in this article comprises personal opinions and should not be construed as containing personal and/or other investment advice and/or an offer of and/or solicitation for any transactions in financial instruments and/or a guarantee and/or prediction of future performance. ForexTime (FXTM), its affiliates, agents, directors, officers or employees do not guarantee the accuracy, validity, timeliness or completeness, of any information or data made available and assume no liability as to any loss arising from any investment based on the same.


Forex-Time-LogoArticle by ForexTime

ForexTime Ltd (FXTM) is an award winning international online forex broker regulated by CySEC 185/12 www.forextime.com

BABA Impulse In The Primary Wave Ⓒ

By Orbex

The formation of BABA shares suggests the construction of a large zigzag Ⓐ-Ⓑ-Ⓒ.

Apparently, the construction of the middle part of this zigzag correction Ⓑ has come to an end. It consists of three main sub-waves (A)-(B)-(C) of the intermediate degree. The final part of the intermediate impulse wave (C) took the form of an ending diagonal of the minute degree.

Most likely, we are currently at the beginning of the development of a bullish wave Ⓒ, which can take the form of a simple impulse. Its growth may end above the level of 274.86, which was marked by the correction wave (B).

BABA

An alternative scenario assumes the continuation of the development of the primary correction wave Ⓑ. It can take the form of an intermediate triple zigzag (W)-(X)-(Y)-(X)-(Z).

The actionary wave (W) is a minor double zigzag, and the second actionary wave (Y) is a triple zigzag.

In the near future, the price could rise in the intermediate intervening wave (X) to the level of 191.11, where it will be at 38.2% of wave (Y).

Then we can expect a decline in the actionary wave (Z) near 54.98. At that level, intermediate waves (Y) and (Z) will be equal.


Orbex-LogoArticle by Orbex

Orbex is a fully licensed broker that was established in 2011. Founded with a mission to serve its traders responsibly and provides traders with access to the world’s largest and most liquid financial markets. www.orbex.com
Intraday Market Analysis – USD Seeks Support

By Orbex

AUDUSD tests major supply zone

AUDUSD

The Australian dollar rallied after the RBA expected a return to growth in October’s meeting minutes.

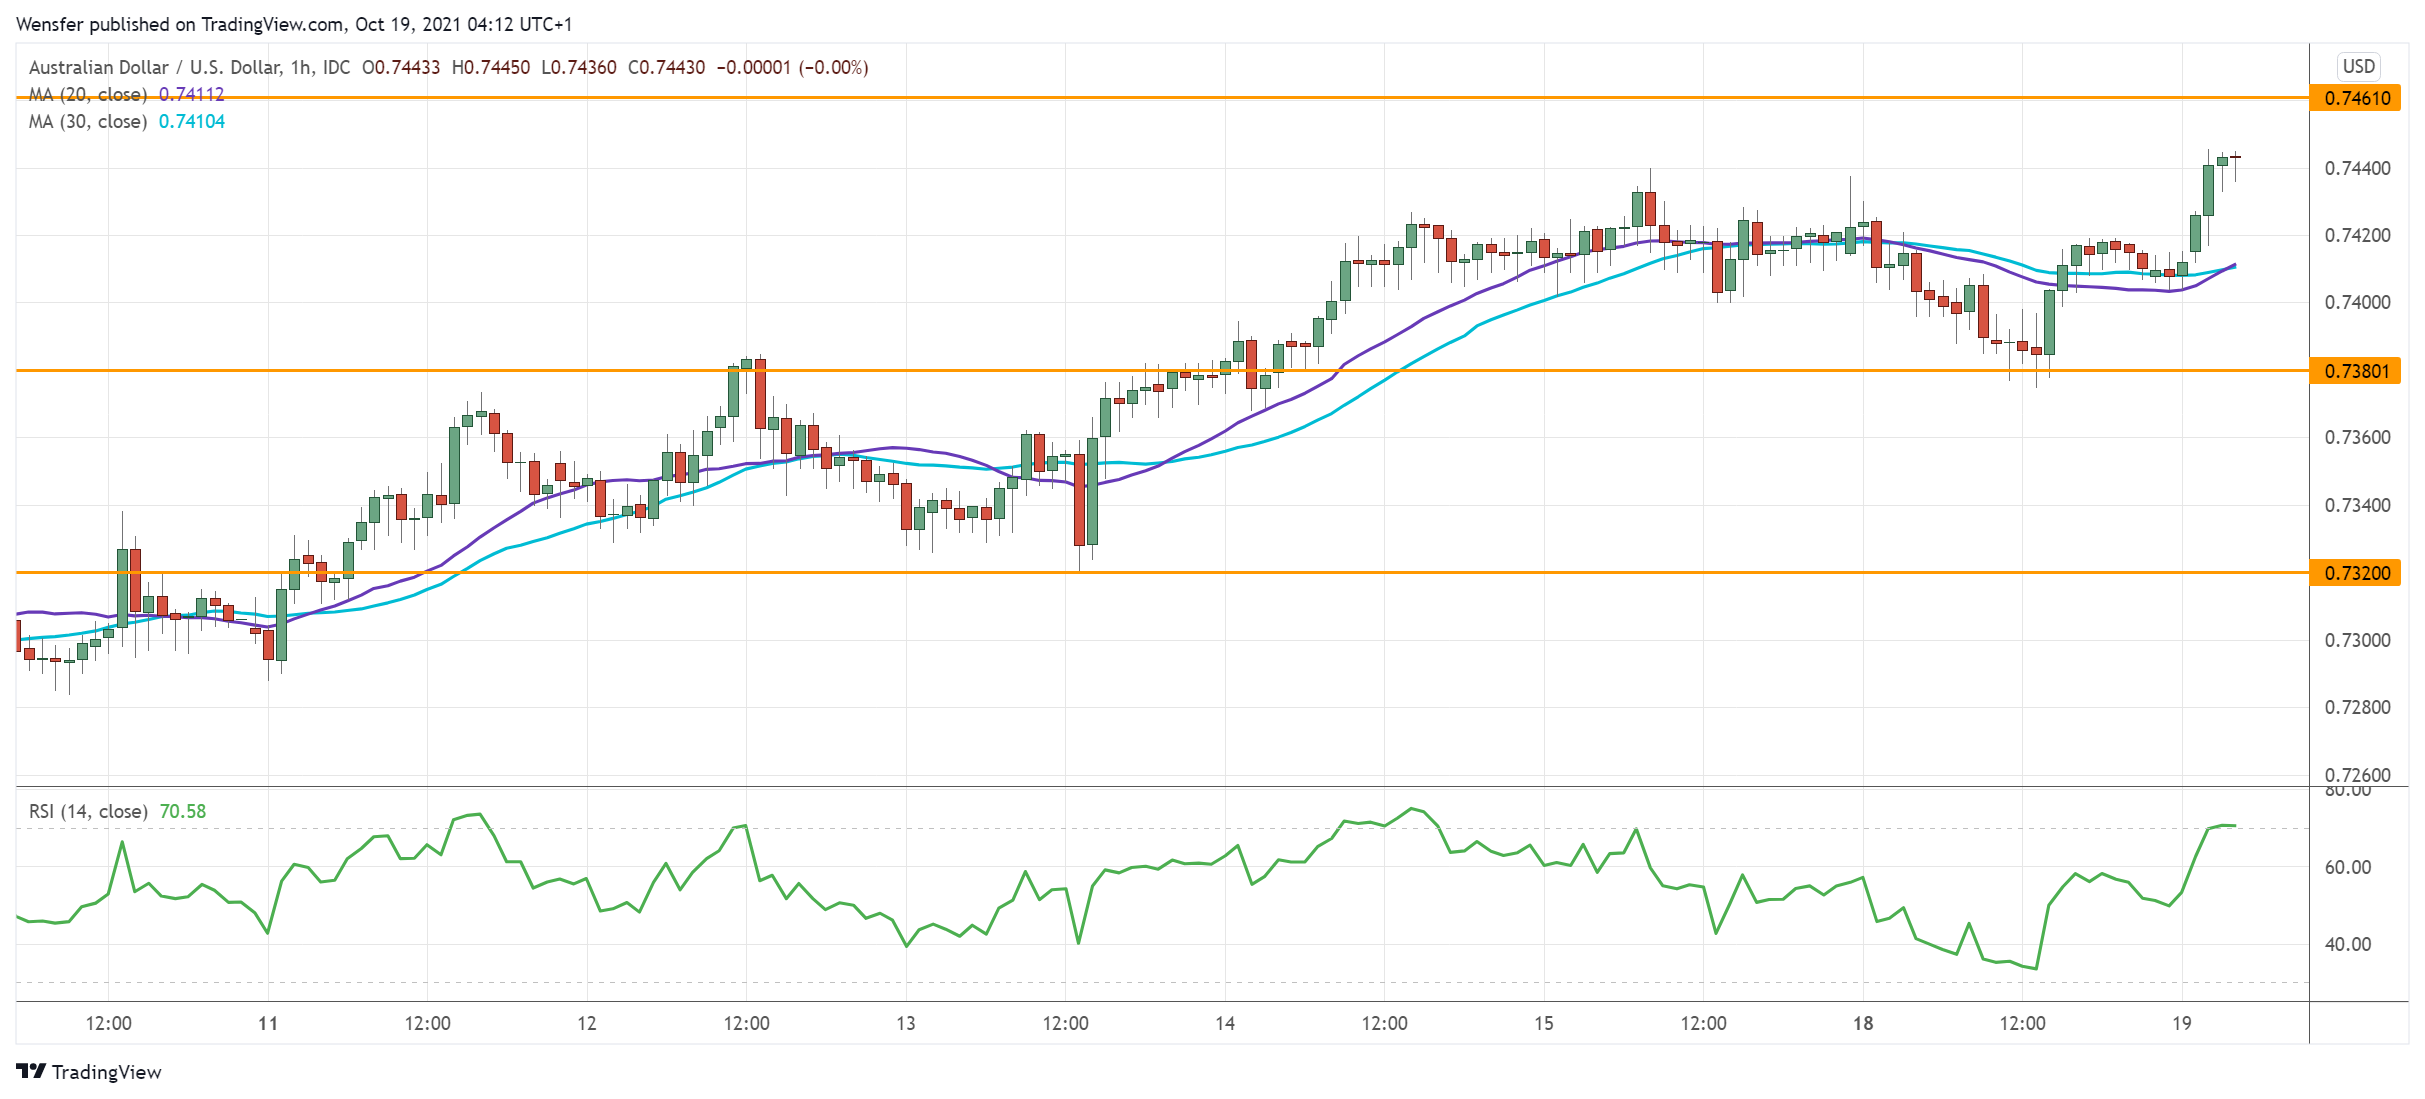
The pair has met stiff selling pressure in the supply zone (0.7460) from the September sell-off. And the RSI is once again in the overbought area. Short-term buyers would be eager to take profit, driving the price lower in the process.

0.7380 is the first support and will test the bulls’ resolve. A bounce above the said resistance would trigger an extended rally. On the downside, a bearish breakout may cause a correction to 0.7320.

USDCHF sees limited rebound

USDCHF

The US dollar recoups some losses supported by recovering Treasury yields.

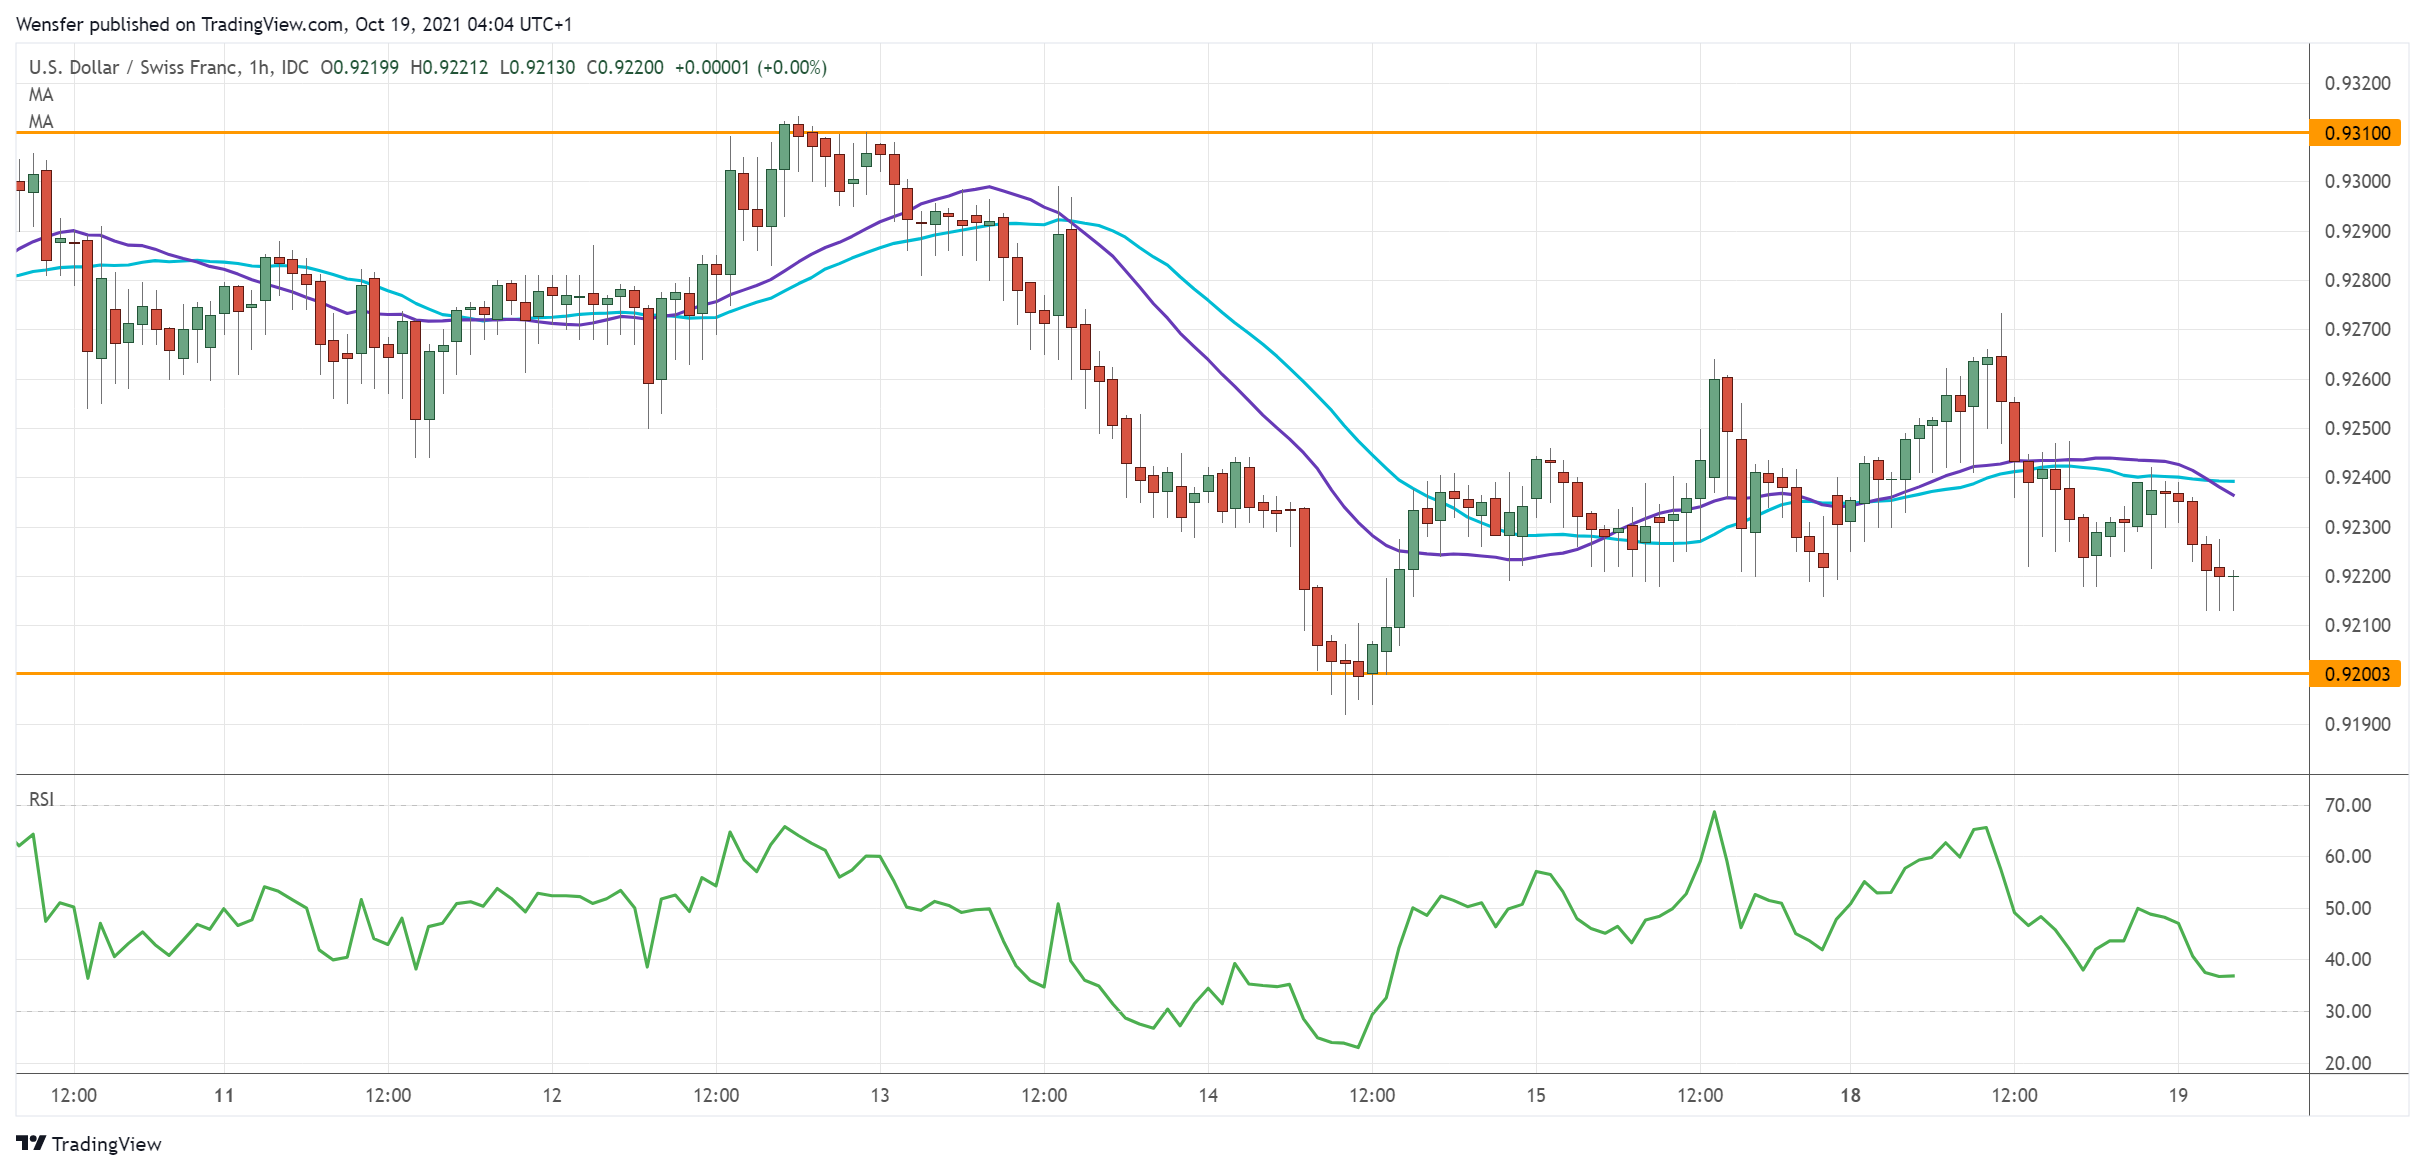
The drop below the demand zone around 0.9230 has put the bulls under pressure. An oversold RSI has triggered the buy-the-dips mentality at the fresh support at 0.9200.

The buy-side will need to clear the hurdle at 0.9310 to reclaim control of the direction. Otherwise, the latest rebound may be an opportunity for the bears to sell into strength.

A new round of sell-off would send the pair towards the daily support at 0.9100.

NAS 100 tests resistance

US 100

The Nasdaq 100 rallies as investors seem to be feeling confident about the upcoming earnings.

A rebound above the psychological level of 15000 suggests strong buying interest in keeping the rally intact in the medium-term. The RSI’s overbought situation has temporarily held the impetus back. A retracement is likely to attract bids in the vicinity of 15050.

15400 is a major resistance from the daily timeframe and its breach may resume the uptrend above 15700. Failing that, 14800 is a key floor on the downside.


Orbex-LogoArticle by Orbex

Orbex is a fully licensed broker that was established in 2011. Founded with a mission to serve its traders responsibly and provides traders with access to the world’s largest and most liquid financial markets. www.orbex.com