World Trade Threatened by Unilateralism

By Dan Steinbock

– Recently, the WTO celebrated the 20th anniversary of China’s entry into the global trading system. To overcome the threat of unilateralism, the WTO can no longer be an arm of the G7. It must become more inclusive and multilateral.

In the postwar era, the World Trade Organization (WTO) achieved significant reduction of trade barriers promoting trade expansion and facilitating trade frictions.

Yet, it has failed to negotiate a successful round of major trade liberalization since 1994. And it remains constrained by increasing polarization between developed and developing countries.

Until recently, rich economies fueled global economic prospects, which are today increasingly driven by large developing economies. A multipolar world economy needs a more inclusive, multilateral WTO.

From trade talks to WTO friction

Established in 1995, the 164-member international organization replaced the General Agreement on Tariffs and Trade (GATT), created in 1948. Today, the WTO’s mandate is to oversee global trade rules and resolve trade disputes.

The latest round of multilateral trade negotiations, the Doha Development Agenda, was launched in 2001 but it ended in stalemate. The talks have been complicated by persistent differences among the US, European Union (EU), and developing countries on key issues, such as agriculture, industrial tariffs and nontariff barriers, services, and trade remedies.

The timing is telling. The stalemate ensued with the rise of the large developing economies, which increasingly drive the global economy. While rich economies insist on their past privileges, poor economies demand a proportionate voice.

Moreover, the trade stance of the US, the architect of the GATT/WTO system, is changing. Unlike the previous US administrations, the Trump trade-war hawks believed the WTO did not add “value” to American economy. They favored bilateral pressure to multilateralism and international rules.

The Biden administration prefers to use multilateral rhetoric for unilateral trade primacy, but the net effect remains the same. Hence, world trade’s lingering stagnation.

Double standards in high-income West

When the key clause in China’s agreement to join the WTO expired on December 11, 2016, President Obama, the EU and Japan were supposed to grant China its market economy status (MES).  They refused to do so. The Trump-Biden stance continues to build on that refusal.

When China joined the WTO, it was written into the agreement that member states could treat China as a “non-market economy.” Due to the size of the Chinese economy, government intervention, and state-owned enterprises, rich economies argued that Chinese domestic price comparisons must be ignored and “constructed values” should be used to gain a “true picture” of the Chinese economy.

In 2001, Chinese GDP was $1.3 trillion (12% of US GDP). Today, it is about $16.9 trillion (74% of US GDP), thanks to reforms and opening-up policies. Yet, China is still treated as it was two decades ago, as a pretext for heavy anti-dumping duties.

Imagine what would happen if these double-standards had been applied to rich economies when they were industrializing. In the 19th century America, tariffs were among the highest in the world, and infant-industry protection the norm. Washington saw US-based manufacturing critical to US sovereignty. In Western Europe, similar practices prevailed. And the same went for Japan at the turn of the 20th century.

The real litmus test of world trade

Had the WTO existed at the time and had these economies fully abided by its rules, Imperial Britain would have captured most markets in Europe and East Asia. Which is precisely why the US, Germany and France, Japan and other major economies resorted to tariffs and protection in the early stages of their industrialization.

If large emerging economies, led by China, and large developing economies, spearheaded by India, are subjected to the double standards of the high-income West, the net effect would devastate their markets and nascent industries. And it would undermine their catch-up growth, which is vital for rising living standards.

Furthermore, unlike the Western powers amid their industrialization, China has made vigorous efforts since 2001 to align itself with WTO rules, open its markets and abide by WTO rules, as vice-minister of commerce Wang Shouwen noted recently. Meanwhile, China’s overall tariff level has halved to 7.4 percent, which is lower than that of WTO’s developing members and close to that of its developed peers.

China is not the litmus test of the WTO or the world trade. Trade unilateralism is.

Risk of trade unilateralism     

Recently, the WTO has been strained by US tariffs, counter-tariffs by other countries, and subsequent trade rows. Several WTO disputes are pending dispute settlement decisions. In one involving US tariffs on China, a panel ruled against the US.

Pursued in the name of national or economic security, unilateral tariffs could derail the credibility of the WTO and its principles fostering new trade restrictions.

The Trump administration amplified these pressures, when it blocked appointment of new jurists to the Appellate Body, which reviews appeals of dispute cases but hasn’t functioned since December 2019. While the EU and others have proposed reforms to address US concerns, thus far they have been rejected by the US.

The Biden administration has pledged to reengage in multilateral cooperation. Yet, it is reluctant to reset Trump’s trade policy. The possible return of Trump or like-minded unilateralists to the White House by 2024 would escalate the risks. Unilateralism is undermining the system.

Among WTO members, the US has been a complainant in the most dispute cases since the system was established in 1995. Typically, the two largest targets of complaints initiated by the US are China and the EU, which, combined, account for more than one-third. The perception is that trade disputes are exploited to foster ailing competitiveness (Figure).

Figure WTO Disputes: US as Complainant
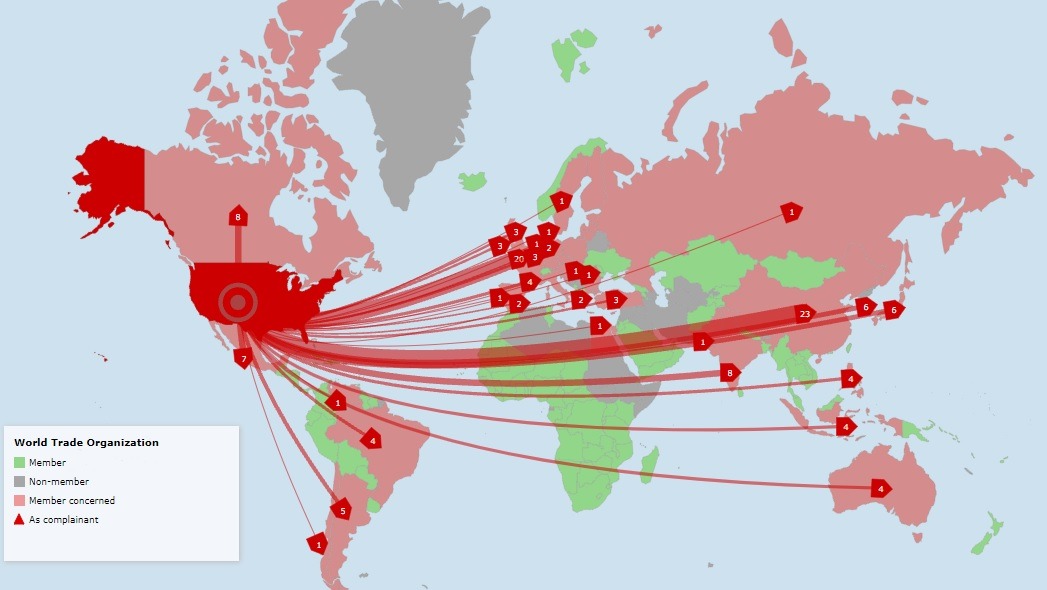
Source: WTO


Toward inclusive trade multilateralism

Since 2017, “my country first” doctrines have undermined world trade, investment and migration. and hence global economic recovery.

Relying on flawed economics, misguided nationalism and horrid xenophobia, such doctrines are the surest path to the kind of horrors that contributed to World War II.

In the early 21st century, when developing countries increasingly fuel global economic prospects, what the multipolar world economy needs is a WTO dedicated to inclusive multilateralism.

About the Author:

Dr. Dan Steinbock is an internationally recognized strategist of the multipolar world and the founder of Difference Group. He has served at the India, China and America Institute (USA), Shanghai Institutes for International Studies (China) and the EU Center (Singapore). For more, see https://www.differencegroup.net 

The original version was published by Shanghai Daily on Nov 5, 2021, the opening day of the 4th China International Import Expo (CIIE) in Shanghai, the huge business event that complements the Guangzhou (Canton) Export Fair


 

Bitcoin pushing towards fresh all-time highs this week

By George Prior

Bitcoin could hit fresh all-time highs this week, which will bring upside to other cryptocurrencies, particularly those directly involved in fintech development.

This is the bullish prediction from Nigel Green, the CEO and founder of deVere Group, one of the world’s largest independent financial advisory, asset management and fintech organisations.

The ultra-bullish prediction comes as prices are on an upward trajectory and as Australia’s regulator, the ASIC, has become the latest watchdog to approve spot ETFs in the world’s two largest cryptocurrencies, Bitcoin and Ethereum.

Mr Green comments: “It’s taken a week or so longer than the Bitcoin bulls would’ve liked, but overnight on Sunday the world’s largest crypto took off again.

“It reclaimed its previous high of $64,900 from April and is closing in on its all-time high spot price of $66,000 from 19 October.

“Bitcoin will maintain its strength and is likely to shoot further this week, possibly hitting fresh all-time highs, as this current ‘take off’ generates further interest and momentum, attracting even more retail investors.”

He continues: “In addition, Australia’s securities watchdog has followed other global regulators, by giving the green light to the highly anticipated spot exchange-traded funds (ETFs) in a move that has provided a framework for other countries to follow suit.

“This move – especially when other regulators do the same, which they will – will mean that not only more retail investors will pile in but, crucially, more institutional investors such as family offices, hedge funds and real money asset managers will further increase their exposure into digital assets.

“They will bring with them unprecedented levels of capital and stability to the famously volatile crypto market. This will further drive prices skywards.”

The deVere boss goes on to add that the U.S. Securities and Exchange Commission (SEC) would be the “tipping point” in regard to ETFs.

“I believe that the Wall Street’s top regulator will eventually approve a spot Bitcoin ETF.

“A U.S.-based spot Bitcoin ETF would give the sector an unseen level of legitimacy and act as the ultimate tipping point for the market as it will allow corporates to buy and sell quickly and have direct exposure to the crypto itself, unlike with a futures-based ETF.”

As Bitcoin moves towards fresh all-time highs, other cryptos can also be expected to move to the upside, says Nigel Green.  His observation follows Solana and Ether both hitting record highs last week.

“Bitcoin’s gravitational pull on other digital assets will show itself again this week, pulling up other major cryptocurrencies as it maintains its own strength.

“We can expect those cryptos involved with fintech development, such as Ether, Solana and Cardano, to do particularly well.

“Bitcoin is just the start of the fintech revolution which is redefining and reshaping the way that all financial services are delivered.”

He concludes: “This is going to be another good week for crypto investors as interest and demand, as well as regulatory recognition, take flight again.”

About:

deVere Group is one of the world’s largest independent advisors of specialist global financial solutions to international, local mass affluent, and high-net-worth clients.  It has a network of more than 70 offices across the world, over 80,000 clients and $12bn under advisement.


Japanese Candlestick Analysis for 08.11.2021 (EURUSD, USDJPY, EURGBP)

Article By RoboForex.com

EURUSD, “Euro vs US Dollar”

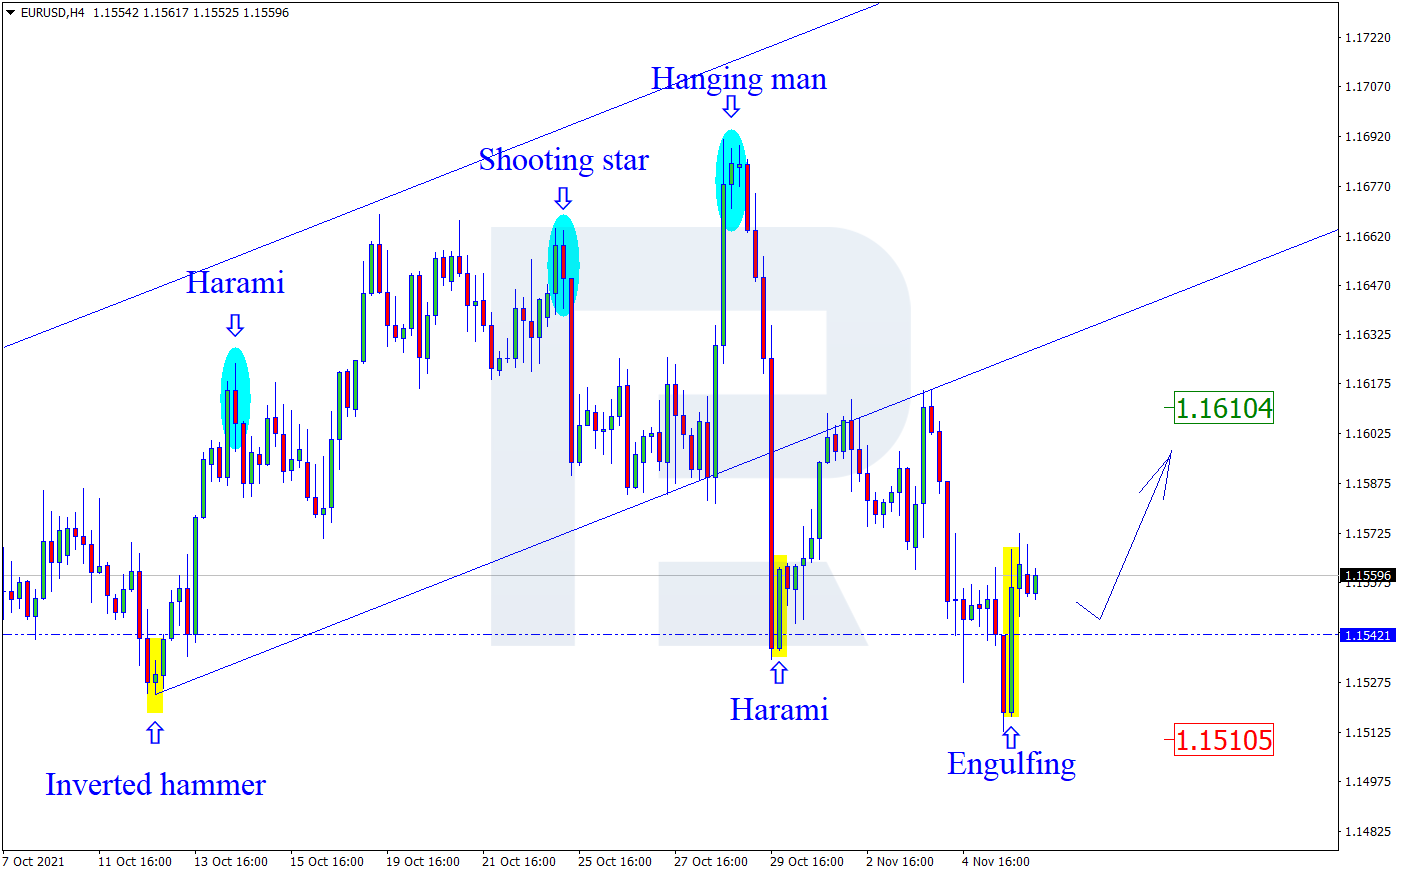
On H4, near the support level, the pair has formed several reversal candlestick patterns, including a Hammer and an Engulfing. At this stage, going by the pattern, the pair might start an upward momentum. The aim of growth is 1.1610. After a breakaway of the resistance level, the pair can continue with the uptrend. However, the quotations might pull back to 1.1510 before continuing growth.

EURUSD
Risk Warning: the result of previous trading operations do not guarantee the same results in the future

USDJPY, “US Dollar vs Japanese Yen”

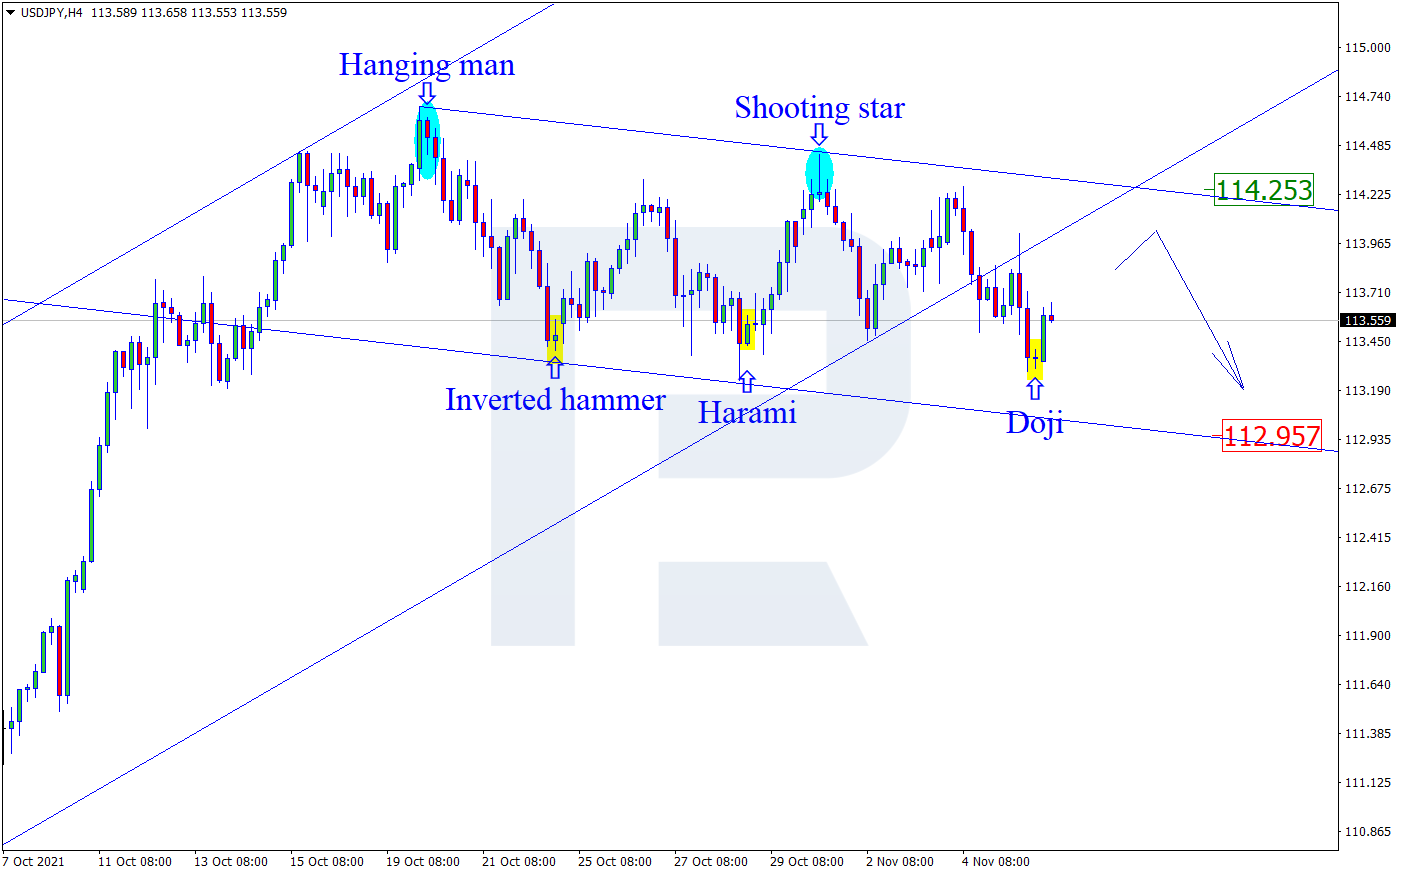
On H4, the quotations are testing the resistance level and have formed several reversal patterns, including a Doji. At this stage, going by the patterns, the quotations can start a correction. The aim of the pullback is 114.25. However, the quotations might drop to 112.95 without a pullback to the resistance level.

USDJPY
Risk Warning: the result of previous trading operations do not guarantee the same results in the future

EURGBP, “Euro vs Great Britain Pound”

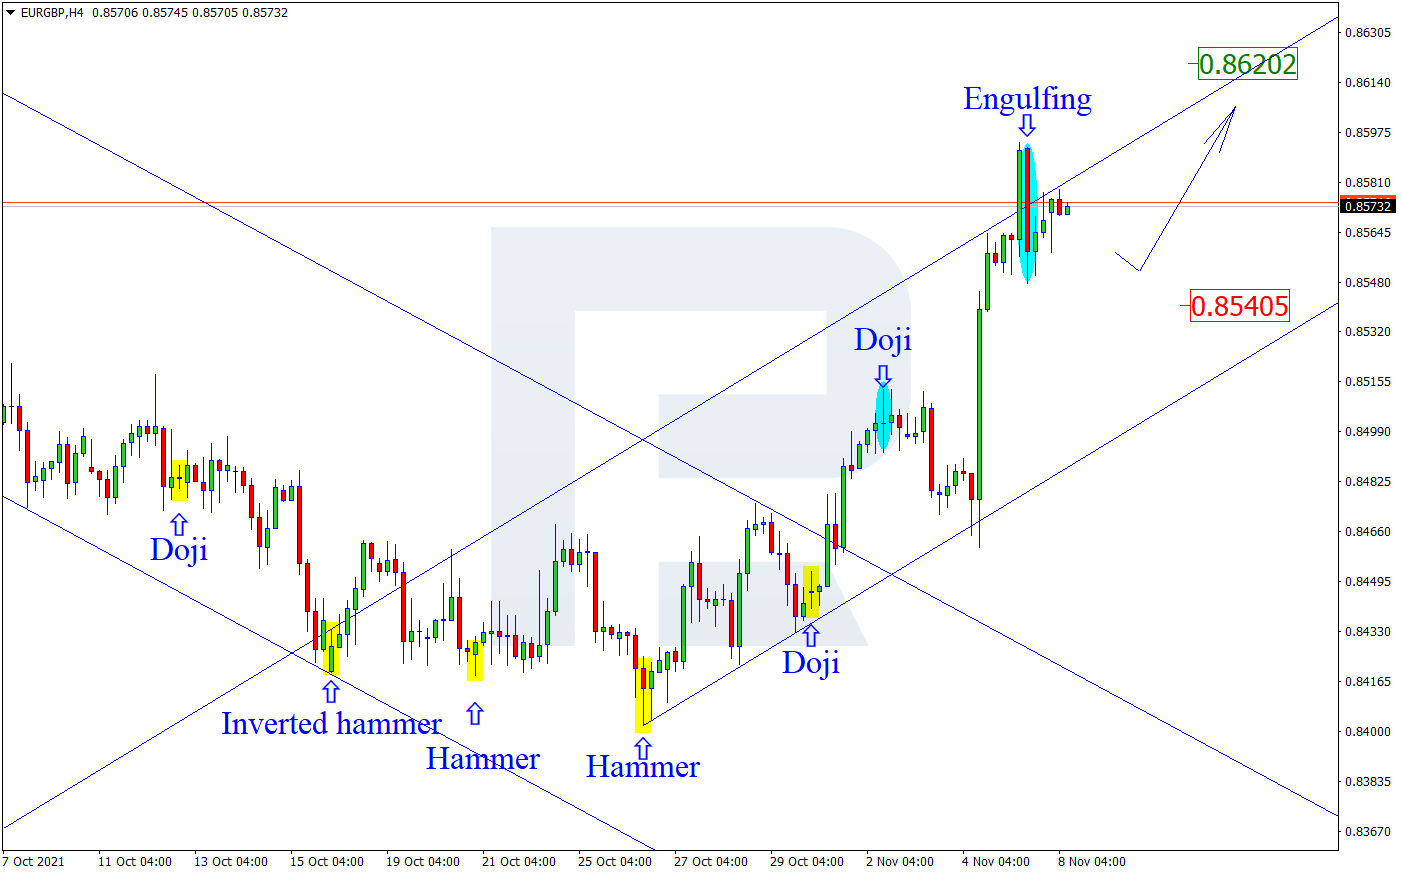
On H4, at the resistance level, the pair has formed several reversal patterns, including an Engulfing. Currently, going by the signals, the quotations might start a correction. The aim of the pullback is 0.8540. Testing the support level and bouncing off it, the price might continue an uptrend. However, the quotations might grow to 0.8620 without any correction to the support level.

EURGBP

Article By RoboForex.com

Attention!
Forecasts presented in this section only reflect the author’s private opinion and should not be considered as guidance for trading. RoboForex LP bears no responsibility for trading results based on trading recommendations described in these analytical reviews.

Ichimoku Cloud Analysis 08.11.2021 (AUDUSD, GBPUSD, NZDUSD)

Article By RoboForex.com

AUDUSD, “Australian Dollar vs US Dollar”

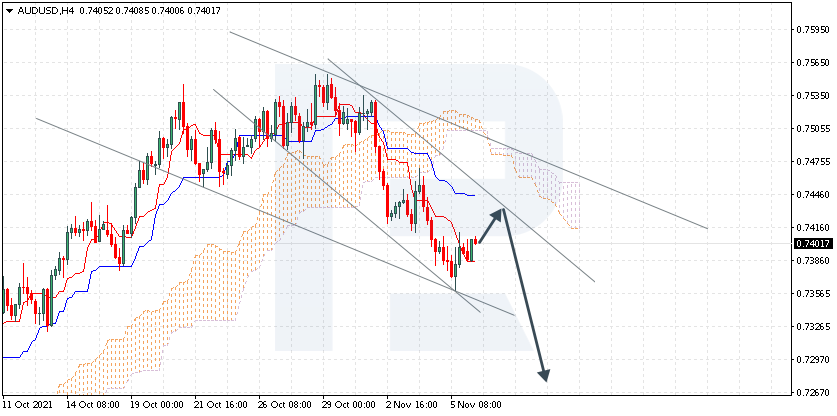
The currency pair is trading at 0.7410 under the Ichimoku Cloud, suggesting a downtrend. A test of the signal lines of the indicator at 0.7420 is expected, followed by falling to 0.7275. An additional signal confirming the decline might become a bounce off the upper border of the descending channel. The scenario can be canceled by a breakaway of the upper border of the Cloud and securing above 0.7515, which will mean further growth to 0.7605.

AUDUSD
Risk Warning: the result of previous trading operations do not guarantee the same results in the future

GBPUSD, “Great Britain Pound vs US Dollar”

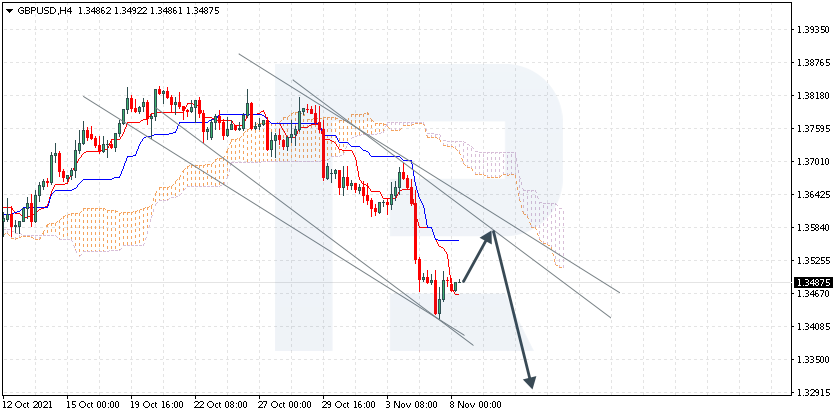
The currency pair is trading at 1.3487 under the Ichimoku Cloud, suggesting a downtrend. A test of the signal lines of the indicator at 1.3540 is expected, followed by falling to 1.3295. The decline can be additionally confirmed by a bounce off the upper border of the descending channel. The scenario can be canceled by a breakaway of the upper border of the Cloud and securing above 1.3755, which will entail further growth to 1.3845.

GBPUSD
Risk Warning: the result of previous trading operations do not guarantee the same results in the future

NZDUSD, “New Zealand Dollar vs US Dollar”

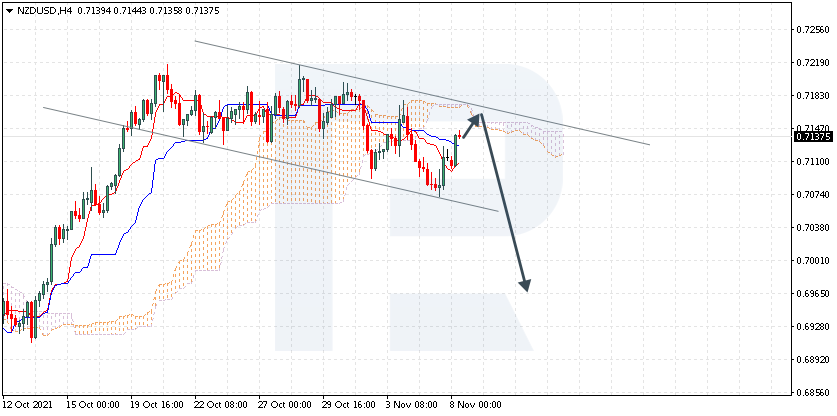
Gold is trading at 0.7137 under the Ichimoku Cloud, suggesting a downtrend. A test of the upper border of the Cloud at 0.7150 is expected, followed by falling to 0.6965. An additional signal confirming the decline will be a bounce off the upper border of the descending channel. The scenario can be canceled by a breakaway of the upper border of the Cloud and securing above 0.7205, which will entail further growth to 0.7305.

NZDUSD

Article By RoboForex.com

Attention!
Forecasts presented in this section only reflect the author’s private opinion and should not be considered as guidance for trading. RoboForex LP bears no responsibility for trading results based on trading recommendations described in these analytical reviews.

German ZEW Economic Sentiment, And Lockdowns

By Orbex

Just three weeks ago, the German Health Minister Jens Spahn was talking about bringing the covid emergency to an end.

However, at the close of last week, Germany recorded the highest number of new covid cases ever for two consecutive days. Health authorities have acknowledged their anxiety about the situation.

It’s still in the early days of a new spike, but as the weather gets colder and people move indoors, it’s not surprising that case rates have risen all across Europe.

In Germany, the positivity rate has shot up by over 10% of tests, on par with last winter’s records. The seven-day moving average of cases is fast approaching where it was in December of last year. The difference is that virtually all the cases recorded are of the delta variant.

So, what does this imply for the markets?

Are we in for a repeat?

Of course, last winter the situation was quite different as there were no vaccines. And while case rates have spiked dramatically, the number of patients in intensive care or death rates have not mirrored what happened last year.

Therefore, as it stands, Germany hasn’t been talking about a return to lockdowns. But we have to remember that the current Health Minister has his days numbered.

Coalition talks between the Greens, SPD, and FDP continue, without confirming a date for when they will form a new government. But it will likely be before the official start of winter. This means that any decisions on economic or social restrictions to combat the virus will probably be a matter of the new government.

With investors already uncertain about what policies on a wide range of other issues the new coalition will agree on, the additional question regarding covid is probably not helping risk sentiment.

What it means for the markets

The question now is whether the rise in cases is affecting decisions made by businesses and investors. That is likely to be the driver of the market, particularly as we go into the close of the year.

To help answer that question, we can review the ZEW Economic Sentiment survey. It’s important to note that this survey was conducted as covid cases across Germany rose. Nonetheless. it concluded days before the new peaks in cases, and before Pfizer announced that they developed a new treatment for covid that was 90% effective.

Even so, the ZEW survey could show a little bit of softening of optimism, with the Current Conditions metric falling to 18.0 from 21.6. That’s still positive, but off the summer highs. And unfortunately, it could continue a trend towards less optimism as we move into winter.

The shakers and movers

What the market cares most about, however, is the outlook.

In this metric, analysts also expect the German ZEW Economic Sentiment Index to drop to 20.0 from 22.3 in the last month. The interpretation from this is that German businesses still see the situation over the coming months as better than it is currently. In turn, that could keep optimism alive for a little while.

At the same time, we have the release of the ZEW Economic Sentiment Index for the whole eurozone. Again, analysts anticipate that this figure will decline to 18.5 from 21.0 in October. A considerable change in this indicator could affect the market’s risk appetite.

If there is a reversal of the trend and a substantial beat of expectations, then we could see better performance across European equities.


Orbex-LogoArticle by Orbex

Orbex is a fully licensed broker that was established in 2011. Founded with a mission to serve its traders responsibly and provides traders with access to the world’s largest and most liquid financial markets. www.orbex.com

The Analytical Overview of the Main Currency Pairs on 2021.11.08

by JustForex

The EUR/USD currency pair

Technical indicators of the currency pair:
  • Prev Open: 1.1552
  • Prev Close: 1.1567
  • % chg. over the last day: +0.13%

Europe is again in the epicenter of the COVID-19 Pandemic. According to the WHO, hospitalizations of patients with Covid-19 have more than doubled in just one week, with cases approaching record levels due to the more infectious Delta strain. All of this could lead to new quarantine restrictions in European countries, undoubtedly leading to lower economic numbers.

Trading recommendations
  • Support levels: 1.1535, 1.1502, 1.1453
  • Resistance levels: 1.1573, 1.1618, 1.1645, 1.1667, 1.1717, 1.1772

From the technical point of view, the EUR/USD on the hour time frame is bearish. But the price managed to return above the breakdown level, which indicates a possible false break move. The MACD indicator also shows a divergence. Under such market conditions, traders should consider sell positions from the resistance levels near the moving average. It is best to look for buy trades from the false breakdown zone.

Alternative scenario: if the price breaks out through the 1.1667 resistance level and fixes above, the mid-term uptrend will likely resume.

EUR/USD
News feed for 2021.11.08:
  • – US FOMC Member Clarida’s Speech at 16:00 (GMT+2);
  • – US FED Chair Powell’s Speech at 17:30 (GMT+2);
  • – US FOMC Member Williams’s Speech at 17:55 (GMT+2);
  • – US FOMC Member Bowman’s Speech at 19:00 (GMT+2);
  • – US FOMC Member Evans’s Speech at 20:50 (GMT+2).

The GBP/USD currency pair

Technical indicators of the currency pair:
  • Prev Open: 1.3496
  • Prev Close: 1.3494
  • % chg. over the last day: -0.01%

The British pound is under intense selling pressure after the central bank of England did not tighten its monetary policy. Before the meeting, analysts were sure that it would happen, and the Governor of the Bank of England said that such a possibility existed. The British currency is now looking less confident than the Euro. The British pound may be supported only by the growing Brent oil quotes, as these two instruments are historically correlated.

Trading recommendations
  • Support levels: 1.3482, 1.3360
  • Resistance levels: 1.3562, 1.3616, 1.3685, 1.3748, 1.3780, 1.3831, 1.3886

On the hourly time frame, the trend on GBP/USD is bearish. The MACD indicator is in the negative zone, but there are signs of divergence. After Friday’s false breakdown, traders can look for buy trades on the lower time frames with the expectation of a technical rebound. It is best to look for sell deals from the resistance levels around the moving average, as prices have deviated strongly from the averages.

Alternative scenario: if the price breaks out through the 1.3685 resistance level and consolidates above, the bullish scenario will likely resume.

GBP/USD
News feed for 2021.11.08:
  • – UK BoE Gov Bailey’s Speech at 19:00 (GMT+2).

The USD/JPY currency pair

Technical indicators of the currency pair:
  • Prev Open: 113.75
  • Prev Close: 113.39
  • % chg. over the last day: -0.32%

At the moment, there is no fundamental reason for the JPY to strengthen. Firstly, the Bank of Japan has kept its monetary policy soft until the end of the year. Secondly, the Fed started to tighten its monetary policy, making the dollar index stronger and leading to the growth of USD/JPY quotes. Thirdly, investors often use the Japanese yen for borrowing to buy assets such as stocks, which usually negatively affect the Japanese currency.

Trading recommendations
  • Support levels: 113.42, 112.30, 111.53, 110.99, 110.65
  • Resistance levels: 114.48, 115.15

The main trend of the USD/JPY currency pair is bullish. The price attempted to break down the “triangle,” but the movement was weak, and the buyers returned the price to the wide corridor, forming a false breakdown zone below. The MACD indicator has become inactive. Under such market conditions, it’s better to look for buy positions from the buyers’ initiative zone on the lower time frames. Sell positions should be considered from the resistance levels of a higher time frame, given there is sellers’ initiative.

Alternative scenario: if the price falls below 112.30, the uptrend will likely be broken.

USD/JPY
There is no news feed for today.

The USD/CAD currency pair

Technical indicators of the currency pair:
  • Prev Open: 1.2455
  • Prev Close: 1.2452
  • % chg. over the last day: -0.02%

The Canadian dollar is a commodity currency, so the USD/CAD currency pair highly depends on the dollar index dynamics and oil prices. On Friday, the dollar index remained at the same level, while oil prices increased by the end of the day. As a result, USD/CAD quotes slightly decreased due to strengthening the Canadian currency. The unemployment rate in Canada fell from 6.9% to 6.7%.

Trading recommendations
  • Support levels: 1.2428, 1.2352, 1.2306, 1.2260
  • Resistance levels: 1.2518, 1.2565, 1.2628, 1.2729, 1.2774

From the technical point of view, the USD/CAD currency trend has changed to bullish. The price broke through the priority change level and consolidated above. The MACD indicator has become inactive, and there are no signs of reversal. Under such market conditions, it is better to look for buy trades from the support levels, given there is the buyers’ initiative. Sell deals should be considered from the resistance levels of the higher time frame.

Alternative scenario: if the price breaks down through the 1.2351 support level and fixes below, the downtrend will likely resume.

USD/CAD
There is no news feed for today.

by JustForex


This article reflects a personal opinion and should not be interpreted as an investment advice, and/or offer, and/or a persistent request for carrying out financial transactions, and/or a guarantee, and/or a forecast of future events.

Weekly Stock Market Forecast

By Ino.com

This week we have a stock market forecast for the week of 11/7/21 from our friend Bo Yoder of the Market Forecasting Academy. Be sure to leave a comment and let us know what you think!

The S&P 500 (SPY)

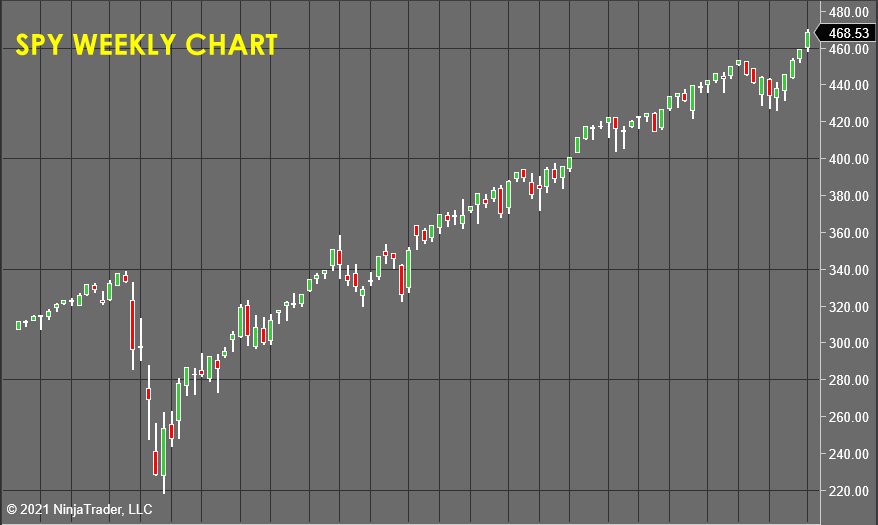
SPY Weekly Chart - Stock Market Forecast

It’s so destructive what the Fed is doing, and their “crystal meth” jacked right into the market’s veins had the expected effect. This injection of demand overwhelmed the available supply and we have “doinked” higher.

I can’t analyze and forecast a market with accuracy where politics and policy trump human behavior models and basic supply and demand.

The intraday markets in the S&P remain solid. I had back-to-back winners today and produced double-digit gains.

Average holding time?

Less than an hour.

Yet that nice day feels ruined as I do the research for this forecast…

Watching my beautiful S&P get yanked around by the pond scum in our political system is like watching somebody vandalize an art masterpiece. People have no idea of the consequences of all this stimulus.

Or, maybe for the first time in my career they do!

Go buy a nice steak or try to buy a used car and you will begin to understand how fiat currency dilution and inflation work.

If you are so inclined, go read “When Money Dies” by Adam Furgusson…

And why you are at it…

Read “The Creature From Jekyll Island” by G Edward Griffen

“Confessions Of An Economic Hitman” by John Perkins

“The Hundred Year Marathon” By Michael Pillsbury

“The Fourth Turning” by Strauss and Howe

And, remember this classic from 2010?

It’s an ugly education, but you read these and you will understand CLEARLY what’s happening in our world, what to expect, and the mess it will leave for those of us who know how to survive it.

Caterpillar Inc. (CAT)

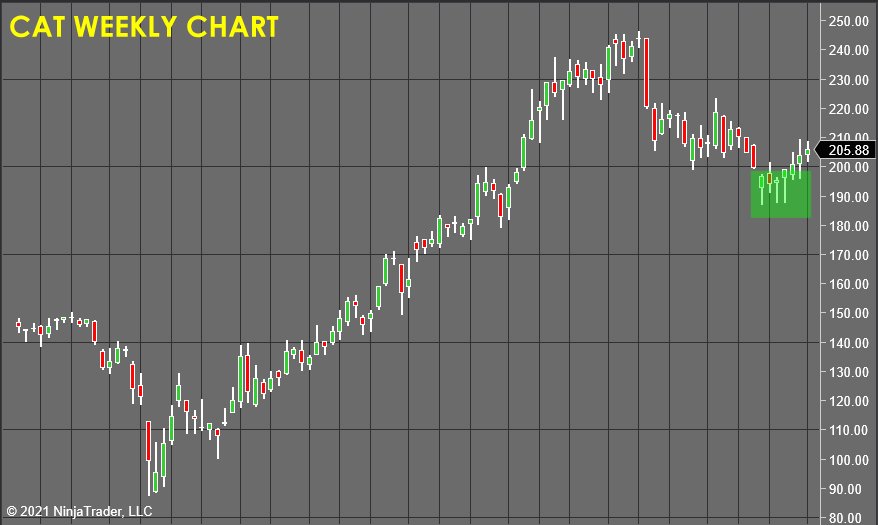
CAT Weekly Chart - Stock Market Forecast

CAT continues to drift higher which isn’t good. The markets had such a “hot” week, and that pressure should have pushed CAT up nicely. This relative weakness is the indication I have been waiting for. Time to scratch this trade for a small profit.

SPDR Gold Shares (GLD)

GLD Weekly Chart

Gold pushed lower early in the week, then the bulls came crashing in and closed the markets at their highs. This bearish rejection is VERY GOOD for this forecast and could be the catalyst I have been waiting patiently for. I’d expect next week to also be a big one for this precious metal market.

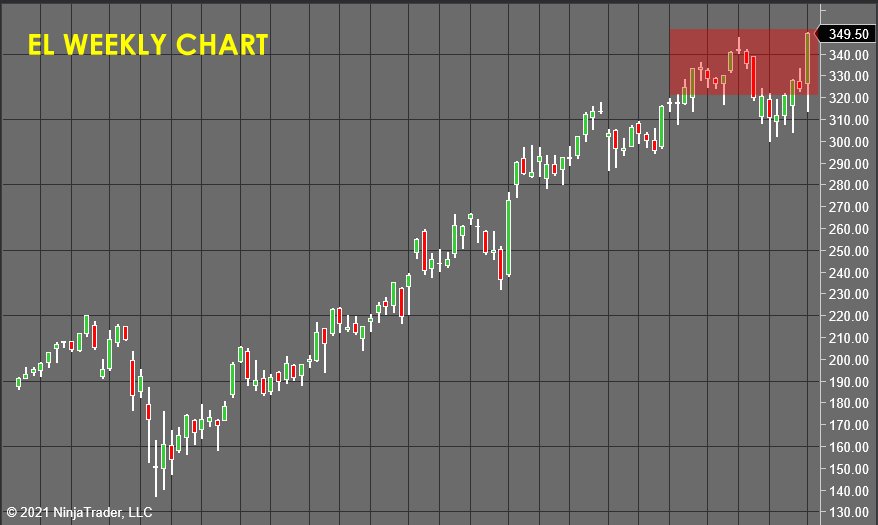
Estee Lauder Company (EL)

EL Weekly Chart - Stock Market Forecast

EL produced a violent whipsaw bar just like previously described in GLD. Caught up in the “fed-whip”, this stock closed right near the highs of the red zone and I’d expect to take the loss at the open on Monday.

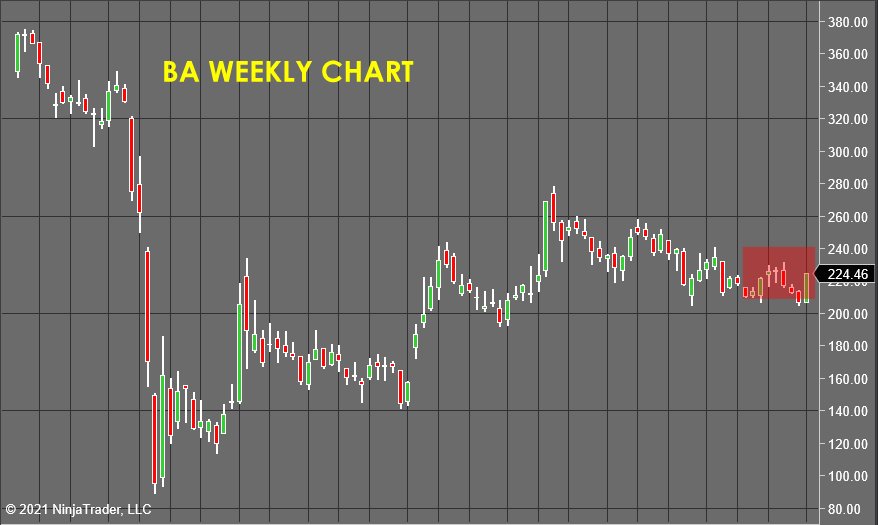
The Boeing Company (BA)

BA Weekly Chart - Stock Market Forecast

BA went right to the edge, then got caught up in the “current” of the Fed rally and closed with a big green bar on its weekly chart.

This is a kick in the shins to the bears and I expect they will react in pain by withdrawing, rather than counter-attacking. I’d say it’s time to reset and get ready to re-deploy capital.

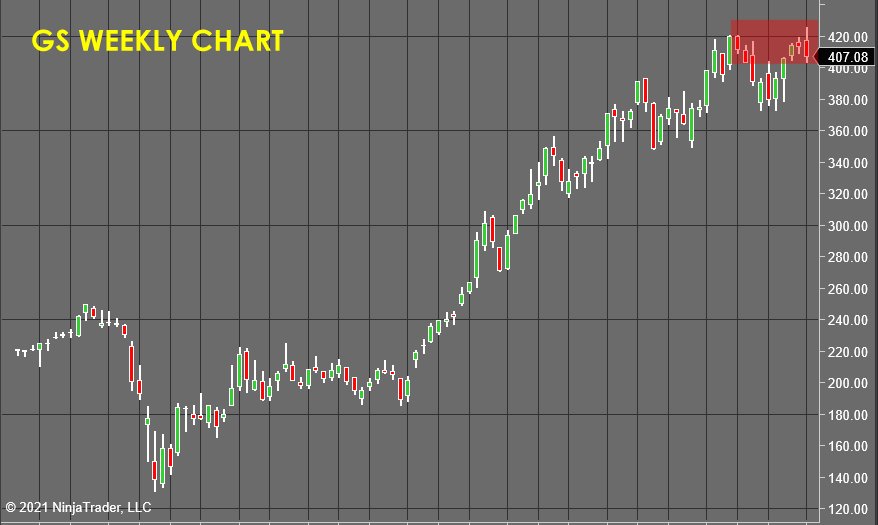
Goldman Sachs (GS)

GS Weekly Chart - Stock Market Forecast

Well, what do you know!

In a Fed stimulated week that blew out most bearish price patterns, somehow Goldman Sachs managed to produce a badly failed breakout (at $420 no less… ironic) and this leaves a clear double top on its weekly chart.

That relative weakness should attract some attention from the bears next week, so this is a perfect place to re-deploy capital this week. Any prices in the red zone would be attractive to me with stop losses set above the highs of that same red zone.

To Learn How To Accurately and Consistently Forecast Market Prices Just Like Me, Using Market Vulnerability Analysis™, visit Market Forecasting Academy for the Free 5 Day Market Forecasting Primer.

Check back to see my next post!
Bo Yoder
Market Forecasting Academy

About Bo Yoder:

Beginning his full-time trading career in 1997, Bo is a professional trader, partner at Market Forecasting Academy, developer of The Myalolipsis Technique, two-time author, and consultant to the financial industry on matters of market analysis and edge optimization.

Bo has been a featured speaker internationally for decades and has developed a reputation for trading live in front of an audience as a real-time example of what it is like to trade for a living.

In addition to his two books for McGraw-Hill, Mastering Futures Trading and Optimize Your Trading Edge (translated into German and Japanese), Bo has written articles published in top publications such as TheStreet.com, Technical Analysis of Stocks & Commodities, Trader’s, Active Trader Magazine and Forbes to name a few.

Bo currently spends his time with his wife and son in the great state of Maine, where he trades, researches behavioral economics & neuropsychology, and is an enthusiastic sailboat racer.

He has an MBA from The Boston University School of Management.

Disclosure: This article is the opinion of the contributor themselves. The above is a matter of opinion provided for general information purposes only and is not intended as investment advice. This contributor is not receiving compensation for their opinion.

By Ino.com – See our Trader Blog, INO TV Free & Market Analysis Alerts

Source: Weekly Stock Market Forecast


EUR/USD Resigned to Pressure

By Dmitriy Gurkovskiy, Chief Analyst at RoboForex

At the beginning of the second week of November, euro/dollar is trading at 1.1560. The market keeps supporting the USD, and there are reasons for it.

According to statistics, the unemployment rate in October dropped to 4.6%, which is quite good. Average hourly wage over the reporting period increased by 0.4% m/m, which is a great result. The NFP in October grew above the expected – by 531 thousand.

On the whole, the employment statistics was positive, which supported the dollar. However, it felt quite confident earlier: the results of the Fed conference in November went according the expectations. The Fed cut down on stimulation as forecast.

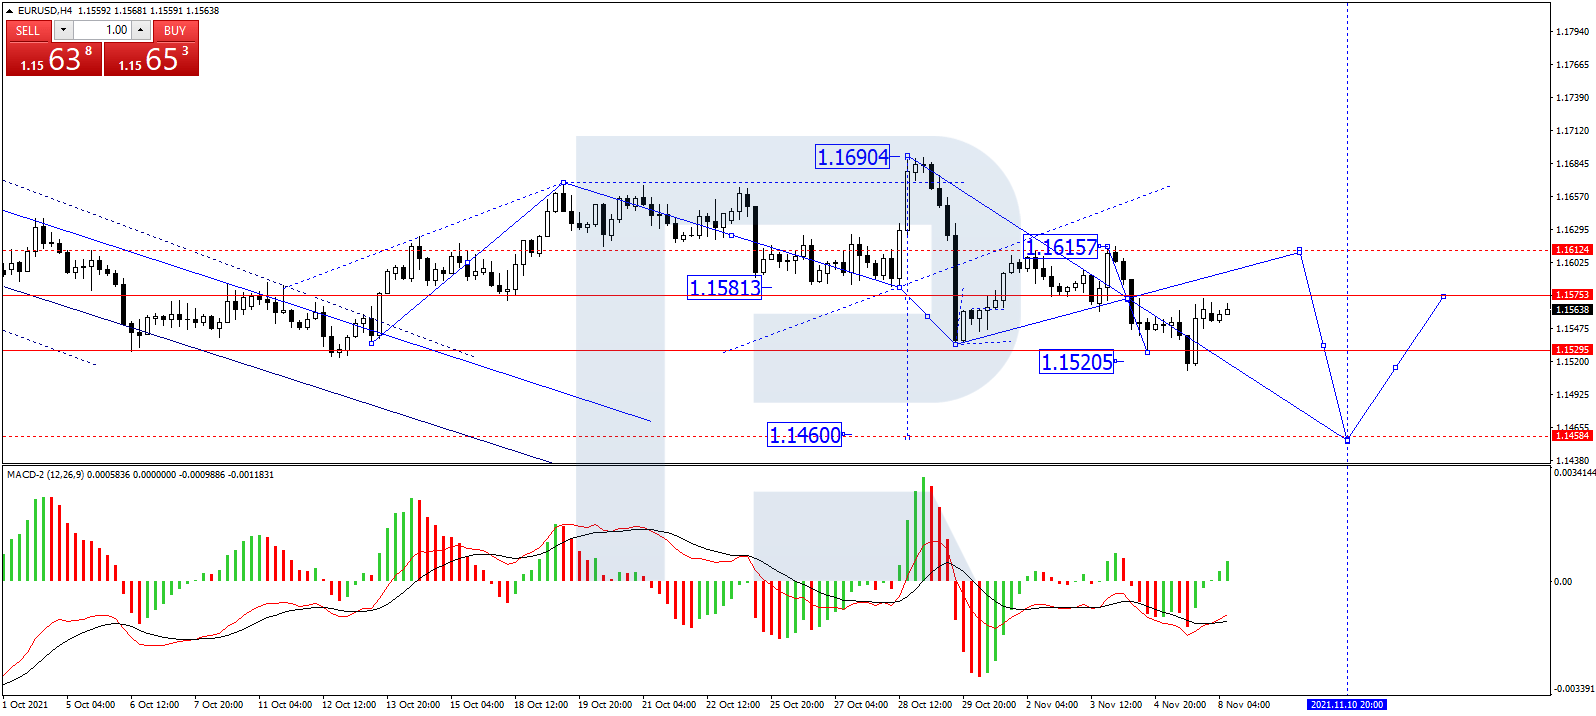
On H4, EUR/USD performed a wave of decline to 1.1514 and a correction to 1.1560. The correction might continue to 1.1626. When it is over, the next wave of decline should continue, aiming at 1.1480. The goal is local. Then we expect a link of growth to 1.1560. Technically, this scenario is supported by the MACD: its signal line is trading below zero. Today, the indicator signals a possible correction. When it is over, we expect the signal lines renew next lows.

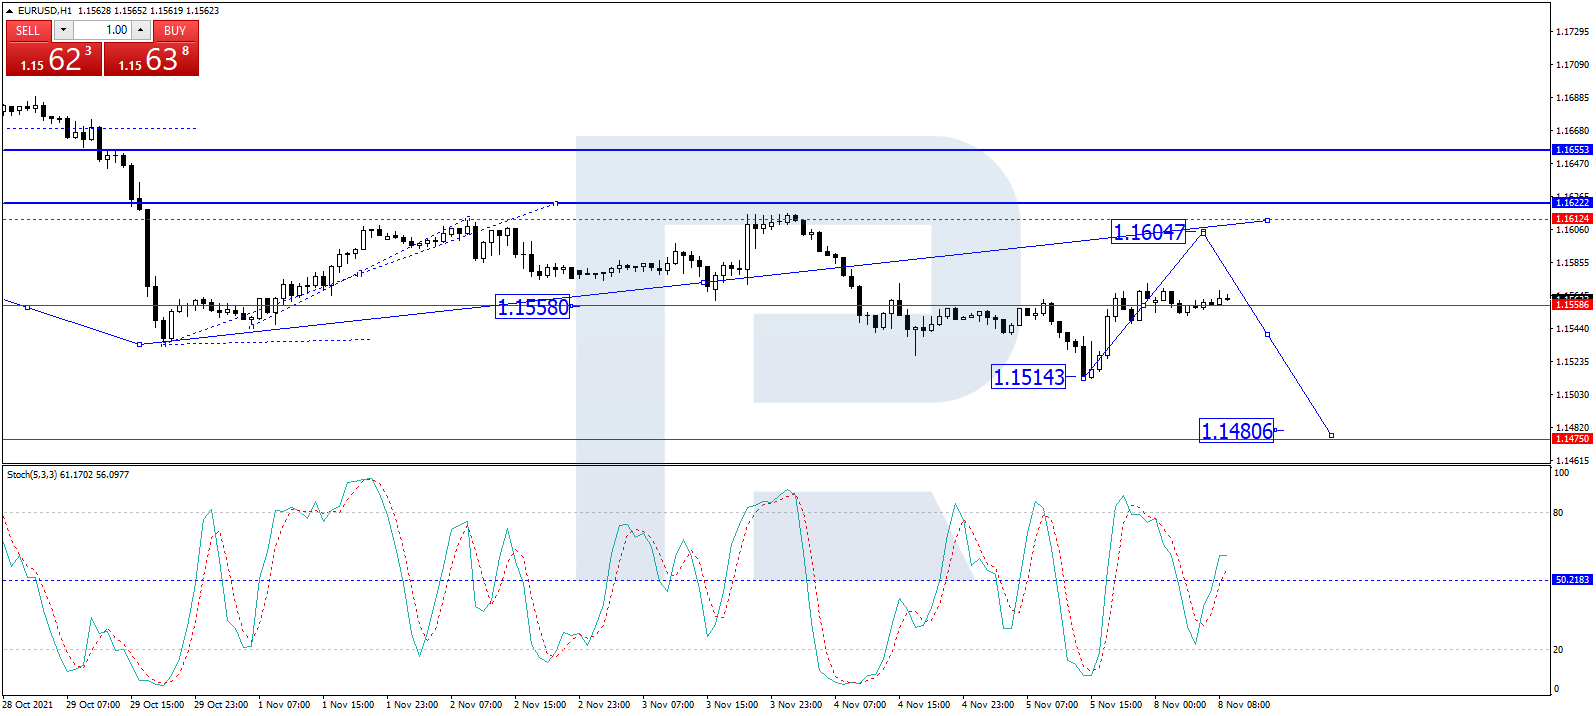
On H1, EUR/USD bounces off 1.1615 and performed another link of a declining wave to 1.1514. Today the market has performed a correction to 1.1558 and at the moment is trading in the consolidation range. With an escape upwards, a pathway to 1.1605 (at least) will open. With an escape downwards, trend will continue to 1.1480. Technically, this scenario is confirmed by the Stochastic oscillator. Its signal line is trading above 50. We expect growth to 80. Then the indicator might drop to 20.

Disclaimer

Any forecasts contained herein are based on the author’s particular opinion. This analysis may not be treated as trading advice. RoboForex bears no responsibility for trading results based on trading recommendations and reviews contained herein.

AAPL Ending Diagonal Pushes To $200

By Orbex

The current AAPL structure shows an ending diagonal of the intermediate degree. In addition, this wave will complete the cycle wave a.

At the moment we are likely in an intermediate wave (3), taking the form of a double combination W-X-Y.

The bulls in the minor wave Y can send the market to the level of 173.33, which is on the resistance line. And then the price could fall within correction (4) to the support level of 138.14.

An approximate scheme of a possible future move is shown on the chart.

AAPL

An alternative scenario shows the price moving higher in the final wave (5). This is likely to reach the level of 160.94, where wave ⑤ will be at 50% of primary wave ③.

After the completion of the ending diagonal, and with it the cycle impulse wave a, we can expect the AAPL stock to decline. That will be as part of the cycle correction b, below the level of 115.79, marked by the primary wave ④.


Orbex-LogoArticle by Orbex

Orbex is a fully licensed broker that was established in 2011. Founded with a mission to serve its traders responsibly and provides traders with access to the world’s largest and most liquid financial markets. www.orbex.com

Pfizer and Merek are going to approve COVID-19 drug

by JustForex

Last week, investors’ attention was focused on US nonfarm payrolls data and the FOMC meeting. The Federal Reserve officially announced the reduction of the QE program. An interest rate hike is scheduled for the middle of next year. The labor market statistics were improving. The US economy added 531,000 (vs. 455 000 expected) jobs in October. The US Unemployment Rate fell to 4.6%. On the other hand, the US labor productivity fell in the third quarter, reflecting a sharp slowdown in economic growth and an increase in the number of working hours.

The US stock market ended Friday’s trading with growth. At the close of the day the Dow Jones increased by 0.56% (+1.38% for the week), the S&P 500 gained 0.37% (+1.88% for the week), and the NASDAQ technology index increased by 0.20% (+2.77% for the week). But last week’s growth leader was the Russell 2000 index, which jumped by 5.88% by the end of the week, indicating the strengthening of small-cap companies. All four indices hit new all-time highs on Friday.

Pfizer announced that their antiviral COVID-19 drug reduced the risk of hospitalization or death by 89% in an interim analysis of the EPIC-HR phase 2/3 study. The company plans to provide data to the FDA soon for approval for emergency use of the drug. Already more than 50 countries appealed to Pfizer for the COVID-19 medicine.

The UK will begin releasing Merck’s antiviral tablet Molnupiravir as part of a drug trial against COVID-19 later this month.

The White House says it is preparing to purchase the COVID-19 drug from both Merck and Pfizer.

European stock indices also closed the week with growth. By the end of the week, the British FTSE 100 gained 0.92%, the German DAX added 1.84%, the Spanish IBEX 35 increased by 0.7%, the Italian FTSE MIB added 2.24%, and the French CAC 40 jumped by 2.48% and became a growth leader. Eurozone industrial production unexpectedly decreased in September, indicating a long-term impact of restrictions on the supply and shortage of semiconductors.

Asian stocks fell on Friday. Japan’s Nikkei index decreased by 0.61% (+2.75% for the week), Hong Kong’s Hang Seng lost 1.41% (-1.57% for the week), China’s benchmark CSI 300 index decreased by 0.54% (-0.73% for the week), the exception was Australia’s ASX 200, which increased by 0.39% (+1.60% for the week) on Friday.

In the commodities market, sugar futures (+3.68%), natural gas (+3.63%), lumber (+3.3%), palladium (+2.46%), gold (+2.02%), and cotton (+1.95%) showed the biggest gains by the end of the week. Soybean oil futures (-3.93%), cocoa (-3.77%), soybeans (-3.64%), WTI oil (-2.87%), gasoline (-2.73%), corn (-2.73%), and orange juice (-2.72%) showed the largest drop.

Saudi Arabia and its OPEC+ allies rejected US President Joe Biden’s calls for a significant increase in production. That leaves Biden’s ability to use the US strategic reserve.

“The oil market is short of supply, it has entered a period of strong volatility, and prices will continue to rise in the near and medium-term. The emerging disagreement between OPEC and the US administration, the possible release of oil from the US strategic reserves, and the potential resumption of talks with Iran on the nuclear program will increase the volatility of oil prices in the coming weeks,” Goldman Sachs analysts said.

Gold prices unexpectedly increased last week, despite rises in both the dollar index and government bond yields, which have an inverse correlation with gold prices. Analysts are confident that the rise in gold is not supported fundamentally, so they expect gold and silver prices to decline in the coming weeks.

Main market quotes:

S&P 500 (F) 4,697.53 +17.47 (+0.37%)

Dow Jones 36,327.95 +203.72 (+0.56%)

DAX 16,054.36 +24.71 (+0.15%)

FTSE 100 7,303.96 +24.05 (+0.33%)

USD Index 94.22 -0.13 (-0.14%)

Important events for today:
  • – US FOMC Member Clarida’s Speech at 16:00 (GMT+2);
  • – US FED Chair Powell’s Speech at 17:30 (GMT+2);
  • – US FOMC Member Williams’s Speech at 17:55 (GMT+2);
  • – UK BoE Gov Bailey’s Speech at 19:00 (GMT+2);
  • – US FOMC Member Bowman’s Speech at 19:00 (GMT+2);
  • – US FOMC Member Evans’s Speech at 20:50 (GMT+2).

by JustForex


This article reflects a personal opinion and should not be interpreted as an investment advice, and/or offer, and/or a persistent request for carrying out financial transactions, and/or a guarantee, and/or a forecast of future events.