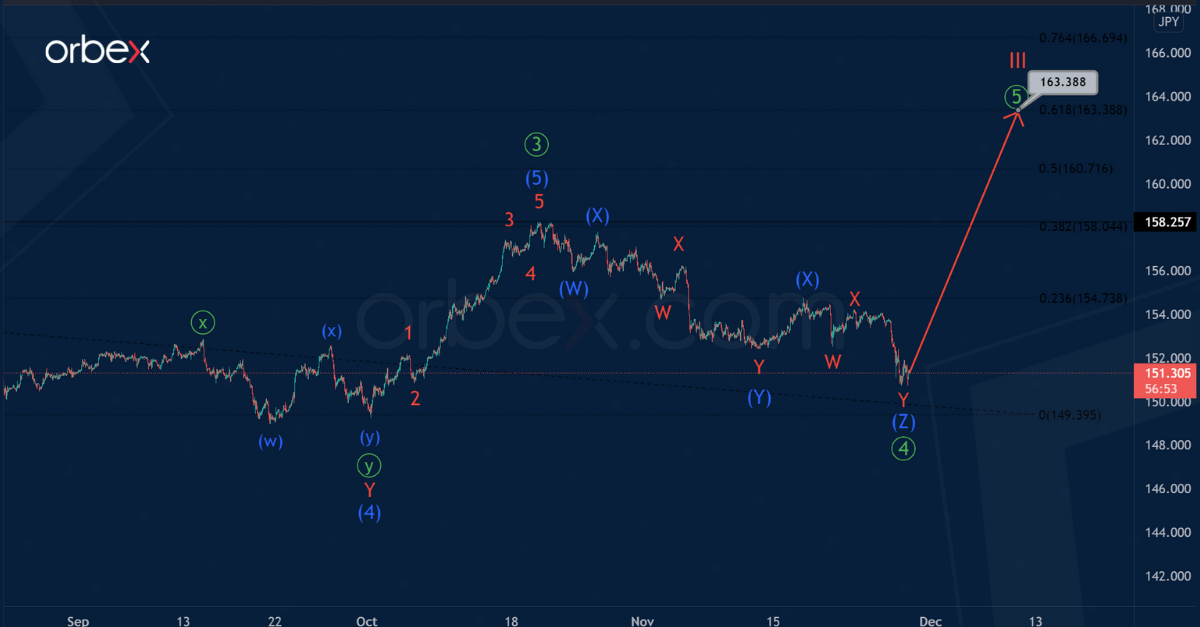
In the long run, GBPJPY seems to be forming a cycle impulse. Now the third part of this impulse, wave III, is under development.
Only the second half of the bullish impulse wave III is visible on the current chart. It seems that the price reduction within the bearish correction ④ of the primary degree has come to an end in its composition. This correction took the form of an intermediate triple zigzag.
If our assumption is right and the correction has ended, then in the near future the price is likely to rise in the primary wave ⑤. This can take the form of either an impulse or an ending diagonal.
The entire primary wave ⑤ can complete its pattern near 163.38. At that level, it will be at 61.8% of wave ③.
It is possible that the formation of the primary correction ④ can continue. In an alternative scenario, it may take the form of an intermediate double zigzag (W)-(X)-(Y).
The actionary wave (W) is a triple zigzag W-X-Y-X-Z. And it is likely that the second actionary wave (Y) will also be a triple zigzag, as shown on the chart.
If this scenario is confirmed, then we should expect a bearish price movement within the minor sub-waves Y-X-Z to the level of 145.71, where wave ④ will be at 50% of impulse ③.
Orbex is a fully licensed broker that was established in 2011. Founded with a mission to serve its traders responsibly and provides traders with access to the world’s largest and most liquid financial markets. www.orbex.com
The Brent price reached stability on Monday after experiencing severe stress last Friday; the asset is trading at $75.30. Still, there is too much volatility and emotions in the instrument.
The reason for that is the new coronavirus strain found in South Africa, which has much more mutations than any other before it. The strain is believed to be very aggressive and may complicate the current epidemiological situation. Many countries started sealing their borders from any contact with South African countries. Israel, for example, forbade the country from foreigners. Under such circumstances, a possibility of new lockdowns is not in favour of the commodity market: the demand for energies may plummet.
At the moment, market players are switching their attention to the December meeting of OPEC+. Maybe this time the cartel and its allies will take a break and put the 400K daily output increase in January on hold. Under current conditions, it would be a great relief for the commodity market.
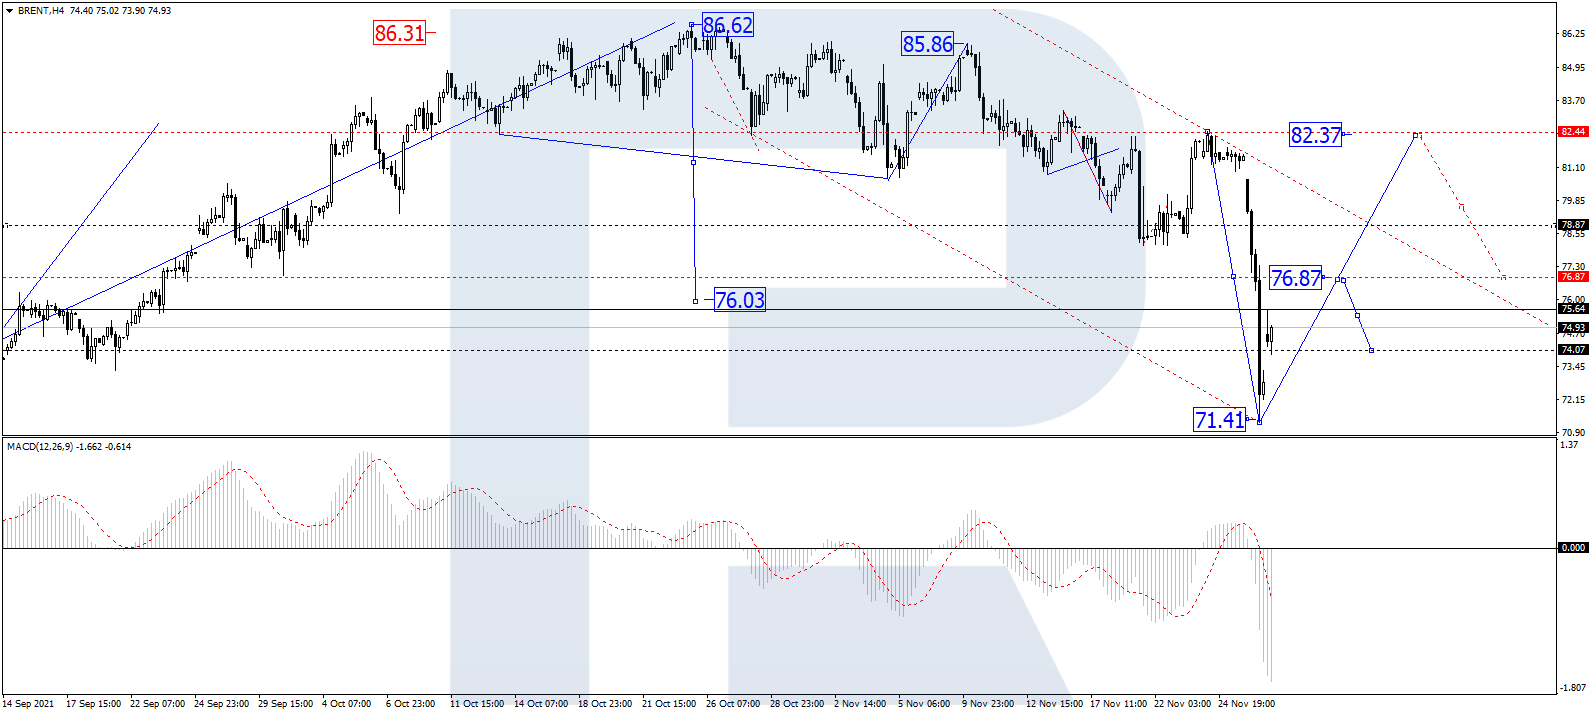
In the H4 chart, completing the descending wave at 71.40 and finishing the correction, Brent is growing with the first target at 82.40. After that, the asset may start a new correction to reach 77.00. From the technical point of view, this scenario is confirmed by MACD Oscillator: its signal line is moving near the lows within the histogram area. Later, the line is expected to leave the area and grow towards 0.
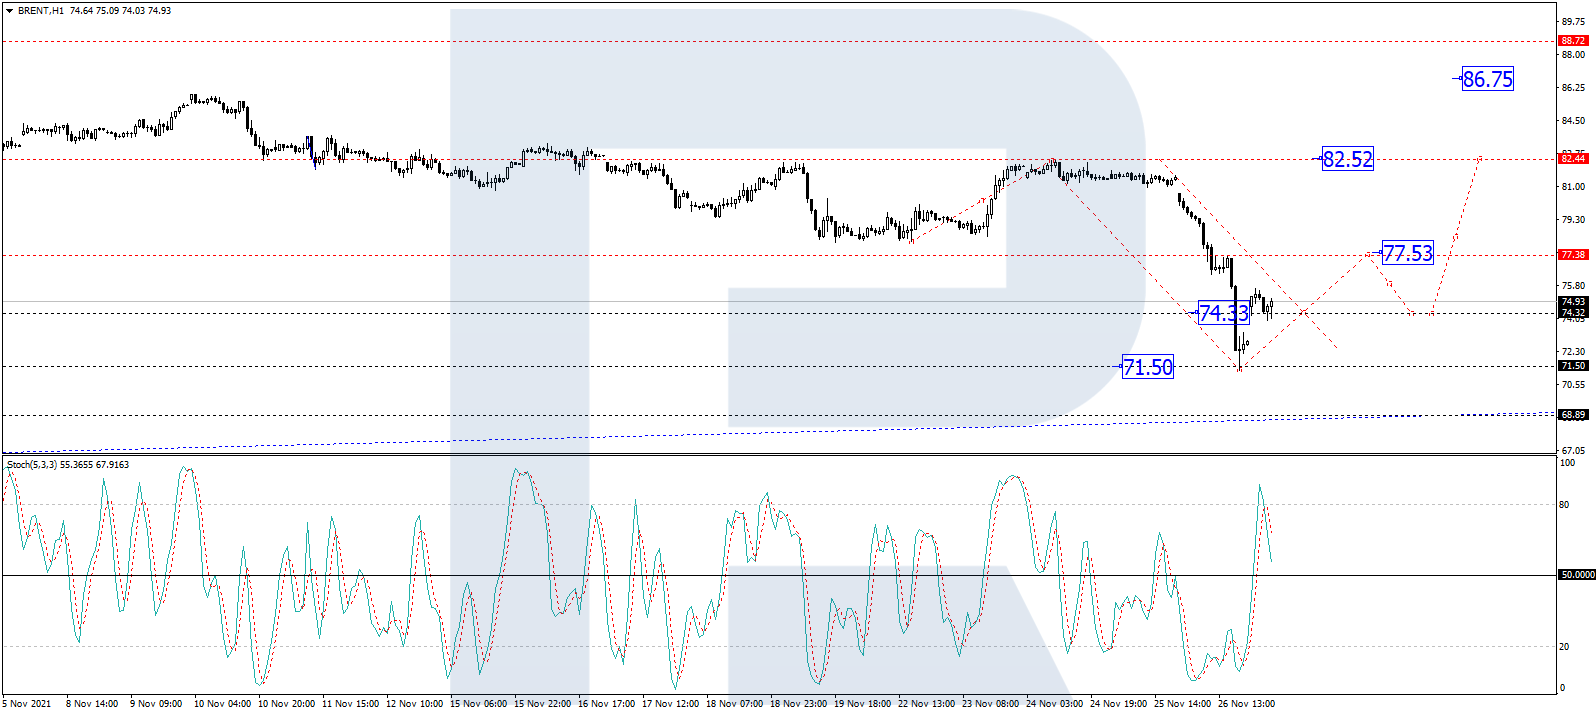
As we can see in the H1 chart, Brent s forming the first ascending structure and may soon reach 77.53. Later, the market may correct towards 74.33 and then resume trading upwards with the first target at 82.52. From the technical point of view, this idea is confirmed by the Stochastic Oscillator: after breaking 50 to the upside, its signal line is expected to test this level and then resume growing to reach 80.
Disclaimer
Any forecasts contained herein are based on the author’s particular opinion. This analysis may not be treated as trading advice. RoboForex bears no responsibility for trading results based on trading recommendations and reviews contained herein.
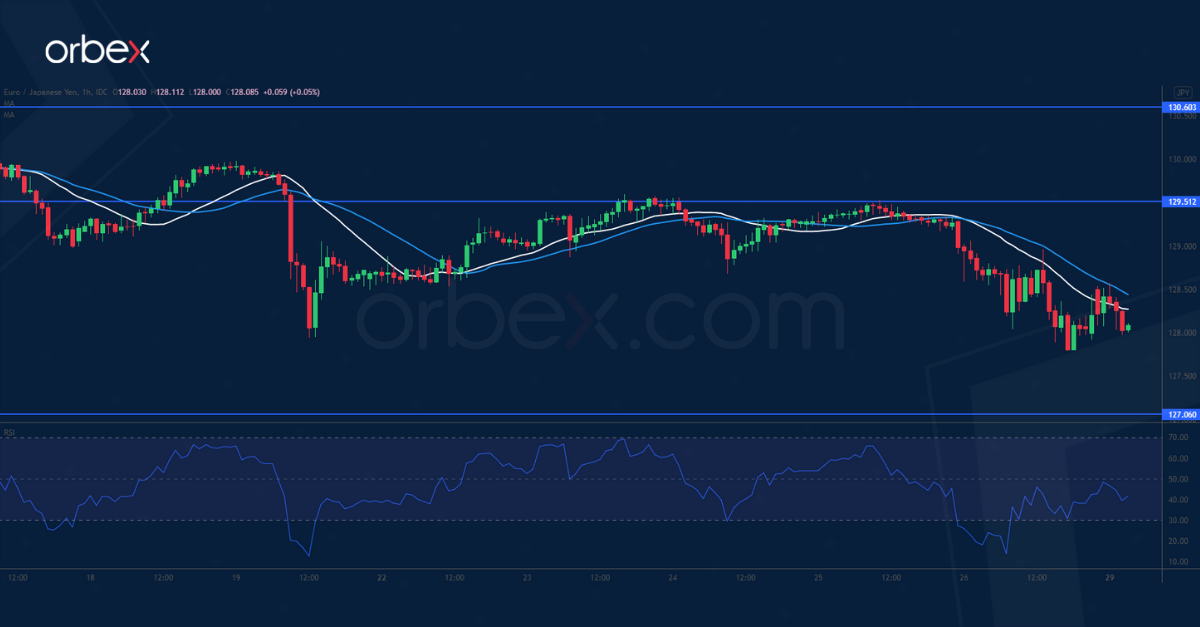
The safe-haven Japanese yen soars on news of a vaccine-resistant covid variant. A bearish MA cross on the daily chart indicates weakness in the euro’s previous rebound.
The pair has closed below last September’s low at 127.90, a major floor to keep price action afloat in the medium term. This is a bearish signal that the sell-off is yet to end with 127.00 as the next support.
The RSI’s double bottom in the oversold area may attract some buying interest. However, the bulls will need to lift 129.50 before a reversal could take shape.
GBPUSD struggles to bounce back
The pound continues on its way down against the US dollar over divergent monetary policy. The pair is hovering near a 12-month low around 1.3280.
Sentiment remains bearish after a failed rebound above 1.3420. A bullish RSI divergence suggests a deceleration in the downward momentum.
1.3390 is the first hurdle ahead. Its breach would prompt the short side to cover and open the door to the daily resistance at 1.3510. Otherwise, a bearish breakout would send the price to 1.3200.
GER 40 to test major floor
The Dax 40 plunged as investors fret that new lockdowns could wreck the recovery. The gap below 15760 has forced leveraged buyers to bail out, stirring up volatility in the process.
The momentum is typical of a catalyst-driven sell-off. Below 15150 the index is testing the psychological level of 15000. The RSI’s oversold situation has attracted a ‘buying-the-dips’ crowd in the demand zone.
Further down, 14820 is a key floor to maintain the uptrend. 15530 has become the closest resistance in case of a rebound.
Orbex is a fully licensed broker that was established in 2011. Founded with a mission to serve its traders responsibly and provides traders with access to the world’s largest and most liquid financial markets. www.orbex.com
The euro plunges as the pandemic situation worsens across the continent. A record rise in covid cases has prompted Austria and Germany to consider imposing another round of lockdowns, with others to follow suit.
Now that Europe accounts for half of global cases and deaths, new restrictions mean that the economy is unlikely to exit the stop-and-go mode any time soon. Without seeing the light at the end of the tunnel, the ECB would be one of the last major central banks to lift its stimulus.
The euro is testing July 2020’s lows near 1.1200. A rebound could be an opportunity to sell into strength. 1.1450 is the closest resistance.
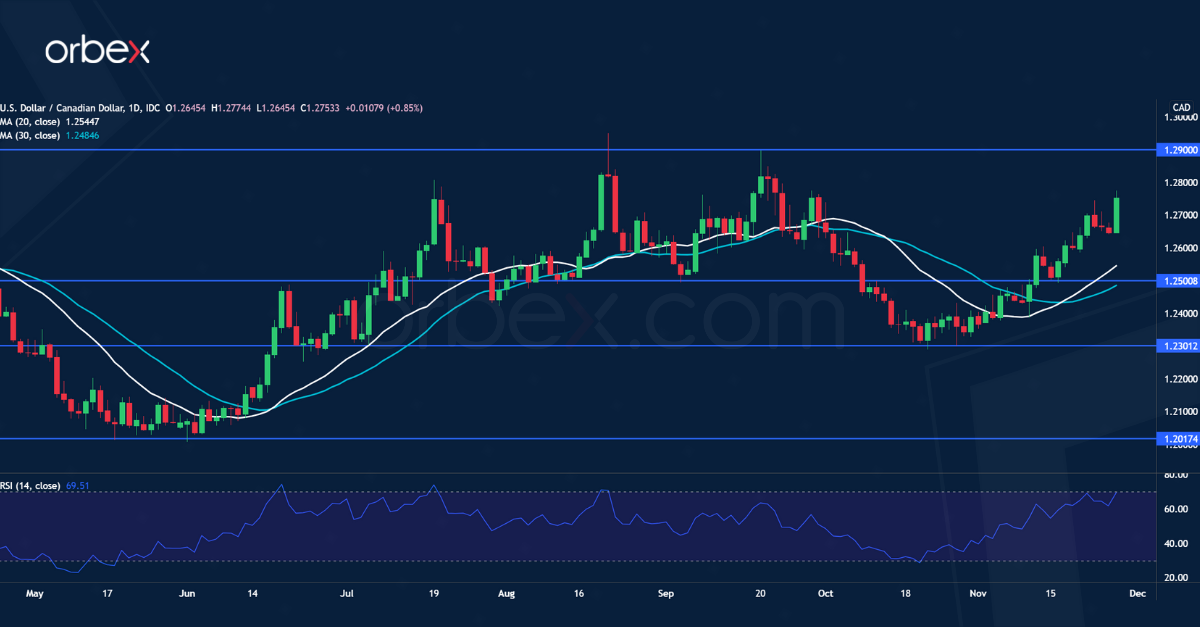
USDCAD rallies on hawkish Fed minutes
The US dollar rallies on speculation that the Fed could raise interest rates sooner than anticipated. The Fed’s latest meeting minutes signaled policymakers’ willingness to hike if inflation remains stubbornly high.
Every data point from now on could be a buildup to the path of normalization. And the upcoming nonfarm payrolls are no exception. A solid employment reading would raise bets that the US central bank may speed up tapering way ahead of its peers.
The long US dollar has become an overcrowded trade. A break above 1.2900 may trigger a bullish reversal beyond 1.3400. 1.2500 is a support in case of a pullback.
SPX 500 falls over new covid variant
News of a possibly vaccine-resistant coronavirus variant sent stock markets lower. Investors fear that the new strain could render massive vaccine campaigns irrelevant and derail the recovery. Nonetheless, it’s important to note that little is known about the new variant.
Markets have been looking for a reason to sell amid record-high valuations and the virus could just fit that role. Fundamentally, things have not changed though. Current recovery momentum and robust corporate profits may offer support once news-driven selling fades.
The S&P 500 is dropping from the all-time high of 4720. 4400 is a major support to maintain the uptrend.
USOIL tumbles as supply may exceed demand
WTI crude plummeted on the concern of a new variant detected in South Africa. The prospect of another round of travel restrictions and Europe-like lockdowns may seriously affect the demand.
The news could not have been of better timing as the US orchestrated a coordinated release of strategic reserves to tackle price pressures. Now that major consumers are at odds with producers, traders are awaiting a response from the OPEC+ meeting this Thursday.
Oil prices could find support if the cartel signals a pause in output increases. The psychological level of 70.00 is the next support. 79.00 is a fresh resistance.
Orbex is a fully licensed broker that was established in 2011. Founded with a mission to serve its traders responsibly and provides traders with access to the world’s largest and most liquid financial markets. www.orbex.com
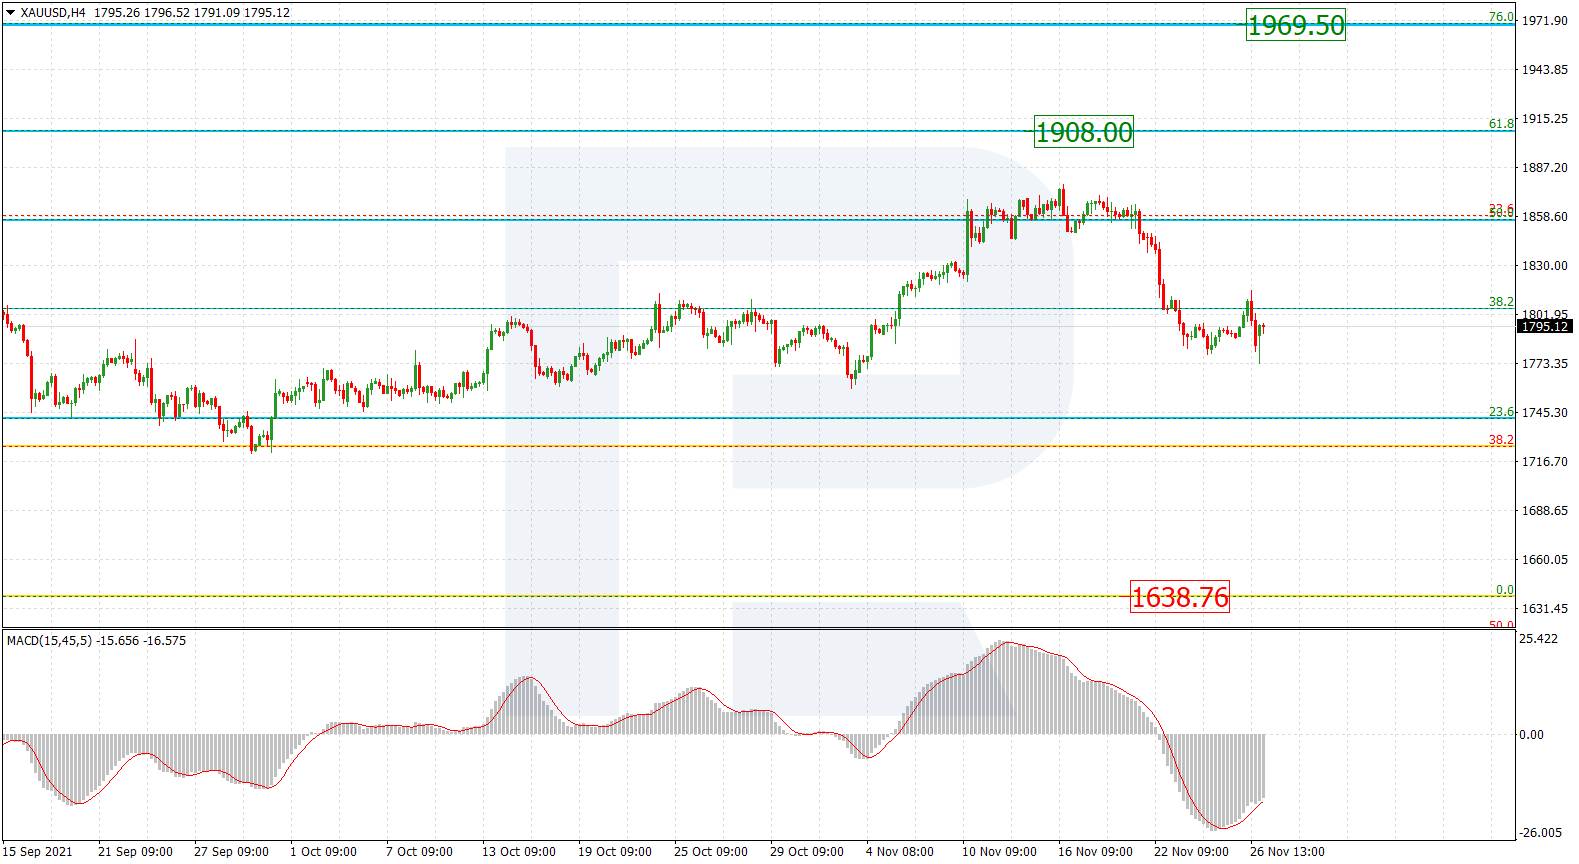
In the H4 chart, XAUUSD is correcting downwards. After the correction is over, the next upside targets may be 61.8% and 76.0% fibo at 1908.00 and 1969.50 respectively. The key support is the low at 1638.76.
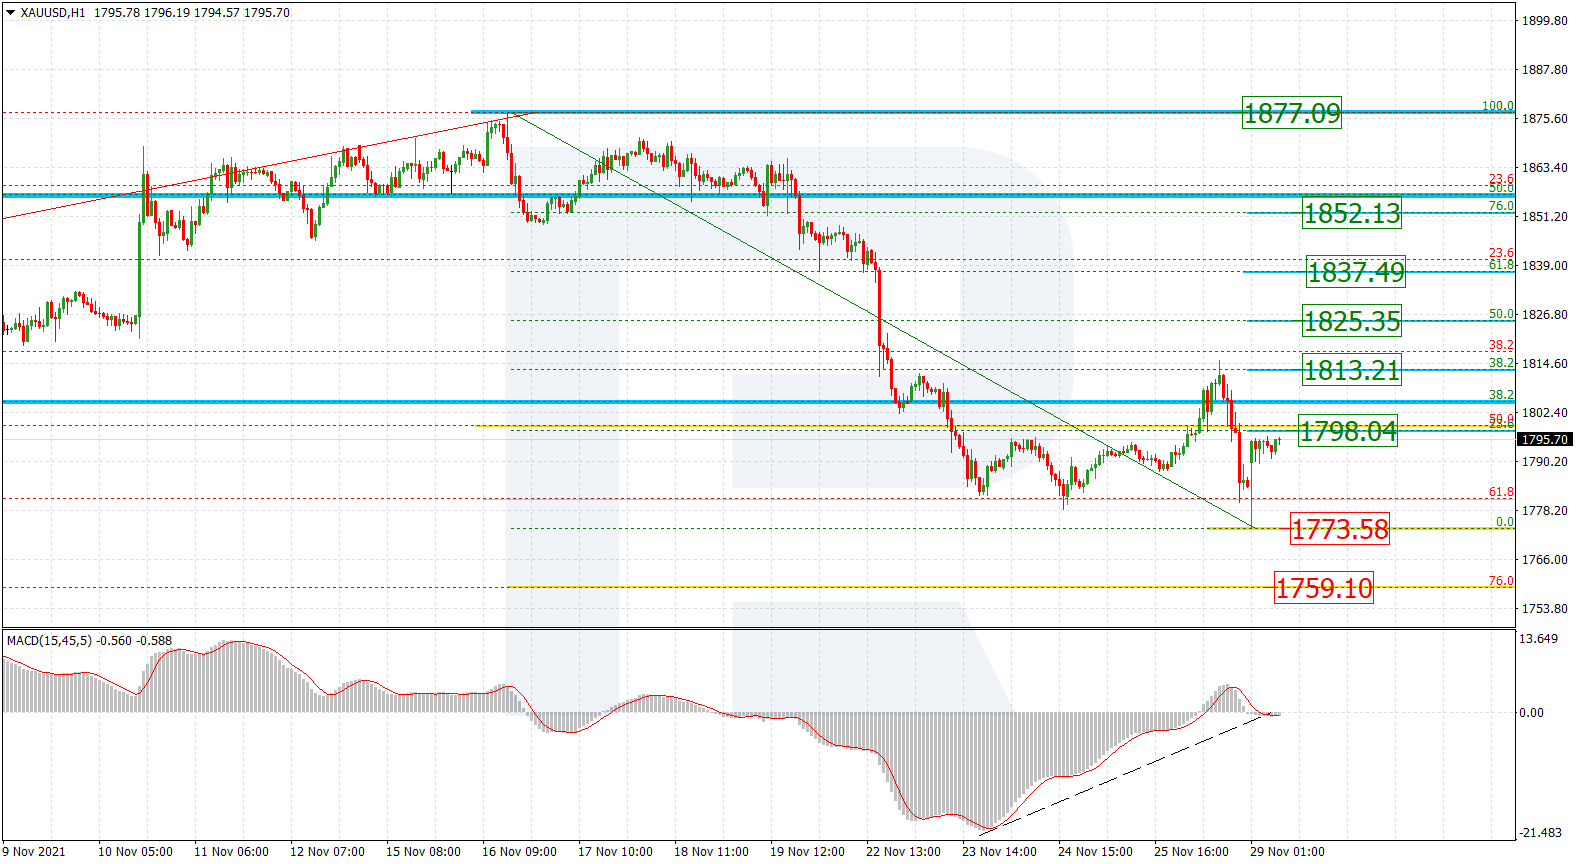
As we can see in the H1 chart, the pair is moving upwards after convergence on MACD. At the same time, there is a possibility that the descending correction may yet continue to break the low at 1773.58 and then reach 76.0% fibo at 1759.10. So far, the first rising impulse is testing 23.6% fibo at 1798.04 and may later continue towards 38.2%, 50.0%, 61.8%, and 76.0% fibo at 1813.21, 1825.35, 1837.49, and 1852.13 respectively. The key upside target is the current high at 1877.09.
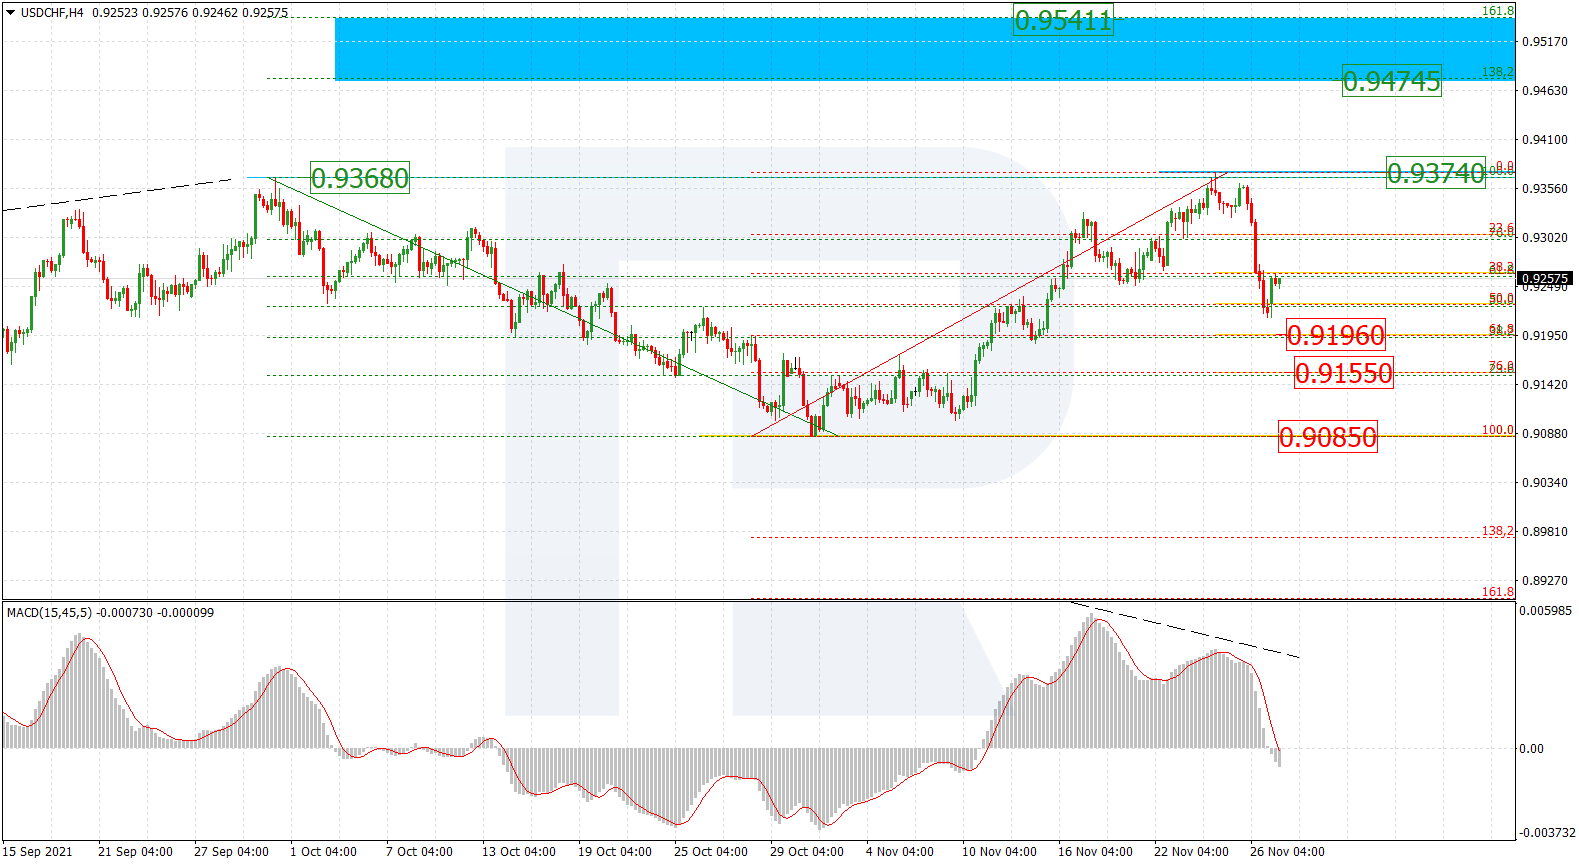
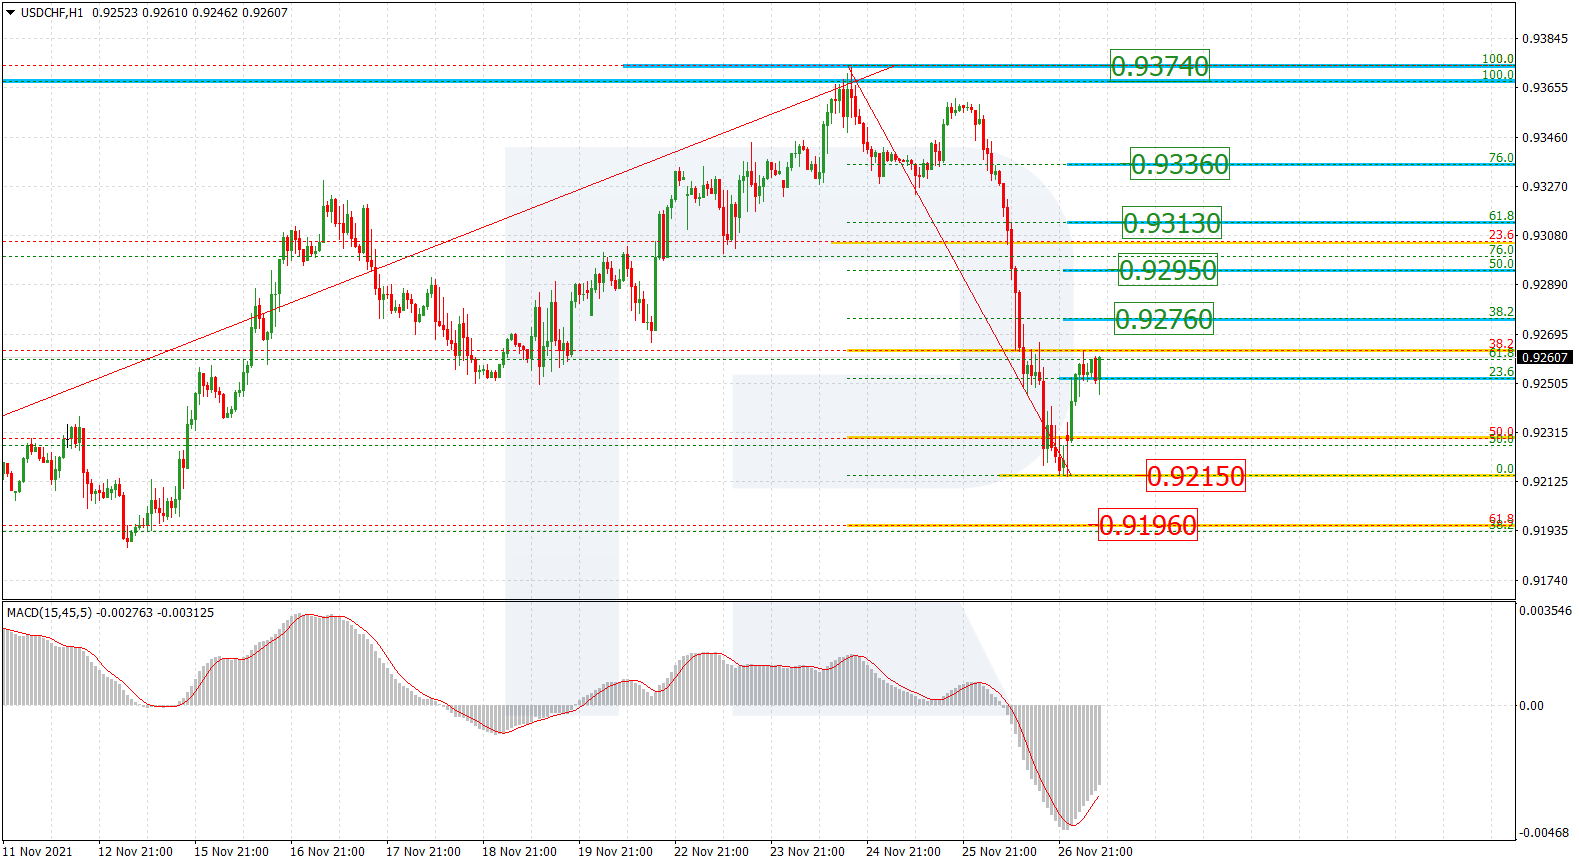
USDCHF, “US Dollar vs Swiss Franc”
As we can see in the H4 chart, after breaking the high at 0.9368 but failing to continue its growth, the asset started a new correction, which has already reached 50.0% fibo and may later continue towards 61.8% and 76.0% fibo at 0.9196 and 0.9155 respectively. On the other hand, a breakout of the high at 0.9374 will result in a further uptrend towards the post-correctional extension area between 138.2% and 161.8% fibo at 0.9474 and 0.9541 respectively. The key support is at 0.9085.
In the H1 chart, after completing the correctional decline and breaking 23.6% fibo, the pair is growing to reach 38.2%, 50.0%, 61.8%, and 76.0% fibo at 0.9276, 0.9295, 0.9313, and 0.9336 respectively. The local support is at 0.9215.
Attention! Forecasts presented in this section only reflect the author’s private opinion and should not be considered as guidance for trading. RoboForex LP bears no responsibility for trading results based on trading recommendations described in these analytical reviews.
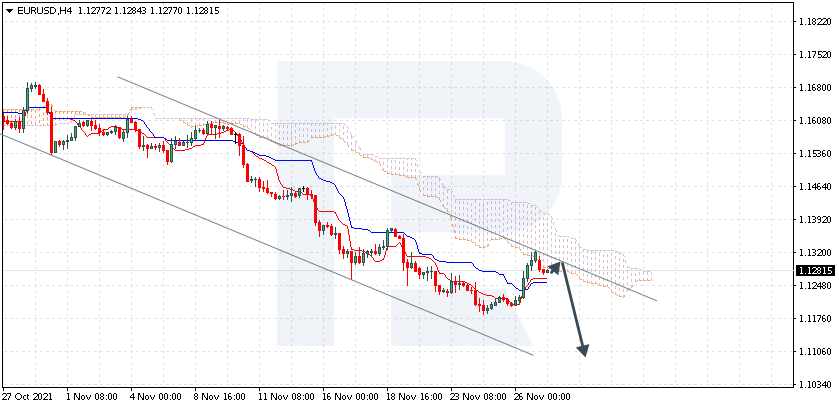
EURUSD is trading at 1.1281; the instrument is moving below Ichimoku Cloud, thus indicating a descending tendency. The markets could indicate that the price may test the cloud’s downside border at 1.1285 and then resume moving downwards to reach 1.1105. Another signal in favour of a further downtrend will be a rebound from the descending channel’s upside border. However, the bearish scenario may no longer be valid if the price breaks the cloud’s upside border and fixes above 1.1375. In this case, the pair may continue growing towards 1.1465.
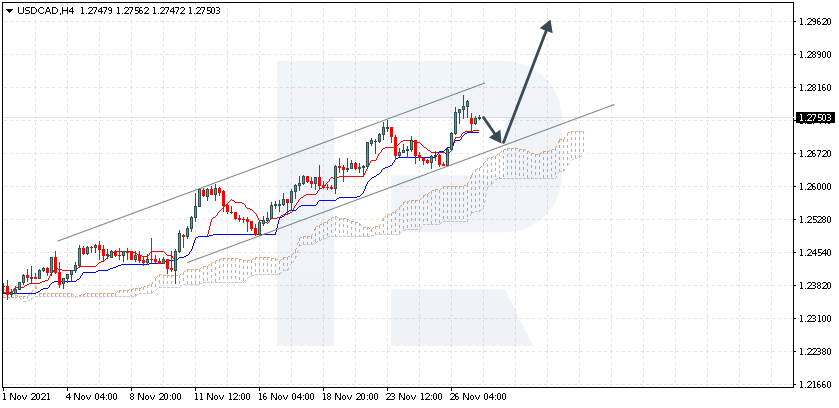
USDCAD, “US Dollar vs Canadian Dollar”
USDCAD is trading at 1.2750; the instrument is moving above Ichimoku Cloud, thus indicating an ascending tendency. The markets could indicate that the price may test Tenkan-Sen and Kijun-Sen at 1.2685 and then resume moving upwards to reach 1.2965. Another signal in favour of a further uptrend will be a rebound from the rising channel’s downside border. However, the bullish scenario may no longer be valid if the price breaks the cloud’s downside border and fixes below 1.2585. In this case, the pair may continue falling towards 1.2495.
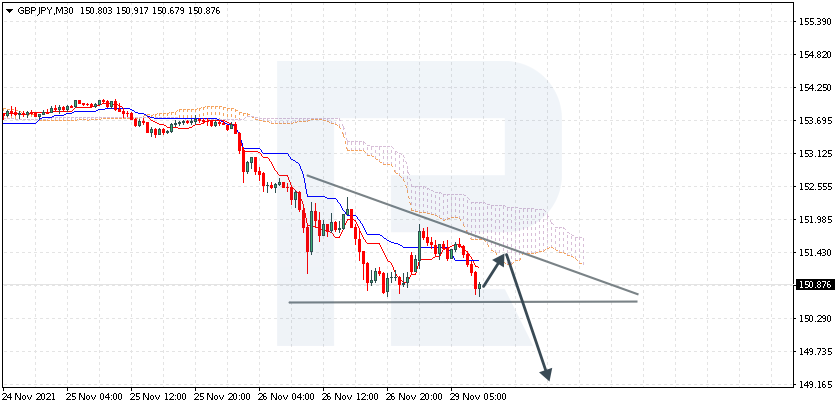
GBPJPY, “Great Britain Pound vs Japanese Yen”
GBPJPY is trading at 150.87; the instrument is moving below Ichimoku Cloud, thus indicating a descending tendency. The markets could indicate that the price may test the cloud’s downside border at 151.30 and then resume moving downwards to reach 149.15. Another signal in favour of a further downtrend will be a rebound from the upside border of the Triangle pattern. However, the bearish scenario may no longer be valid if the price breaks the cloud’s upside border and fixes above 162.55. In this case, the pair may continue growing towards 153.45. To confirm further decline, the asset must break the support level and fix below 150.10, thus indicating a breakout of the pattern’s downside border.
Attention! Forecasts presented in this section only reflect the author’s private opinion and should not be considered as guidance for trading. RoboForex LP bears no responsibility for trading results based on trading recommendations described in these analytical reviews.
Buying a house is complicated enough in a market that has become supercharged in many U.S. cities. Emerging climate change risks will further complicate those decisions. Investors will be less likely to regret their decisions if they do due diligence in researching local climate risks. Mortgage lenders will face less risk of borrowers defaulting, and insurers will face fewer losses, if they factor climate risks into decisions on loans and insurance policies.
I study environmental economics, and in my recent book, “Adapting to Climate Change: Markets and the Management of an Uncertain Future”, I explore how the rise of Big Data will help people, firms and local governments make better decisions in the face of climate risks. I see the emergence of a climate risk analysis industry for real estate as a promising development, but believe the federal government should set standards to ensure that it provides reliable, accurate information.
Climate change is increasingly affecting home values across the U.S. Not everyone can afford to live in risky areas.
Prices send climate signals, but not everyone listens
Home prices reflect implicit judgments about whether properties are good investments – including the house and the area around it. For example, the current median home value in California is nearly US$720,000 – more than twice the national median. This difference reflects a judgment that California offers a desirable climate, lifestyle and job opportunities.
People who buy property in California are betting that the state will continue to be a great place to live in the future. If climate change devastates large portions of it, buyers could regret their investment.
Recent research studying U.S real estate shows that flood risk and fire risk are reflected in current housing prices. Properties that are perceived to be riskier sell for a lower price – but it’s not clear whether these climate price discounts fully compensate buyers for the risks they are exposed to.
Concern about emerging climate risks varies, due partly to the partisan divide. It’s fair to assume that some buyers will be eager to purchase homes in locations that others view as too risky. When people disagree about the probability of a bad outcome, the more optimistic bidder is more likely to purchase the asset.
As Nobel laureate economist George Akerlof has shown, asymmetric information in markets – when sellers know more about a product than buyers – can impede trade. Buyers rightly fear getting stuck with a “lemon,” whether it’s a used car or a house that floods with every big storm.
In the auto market, rating systems like Carfax help level the playing field; in the real estate industry, climate concerns are creating an opportunity for a nascent industry of climate risk screening modelers offering similar service for homebuyers.
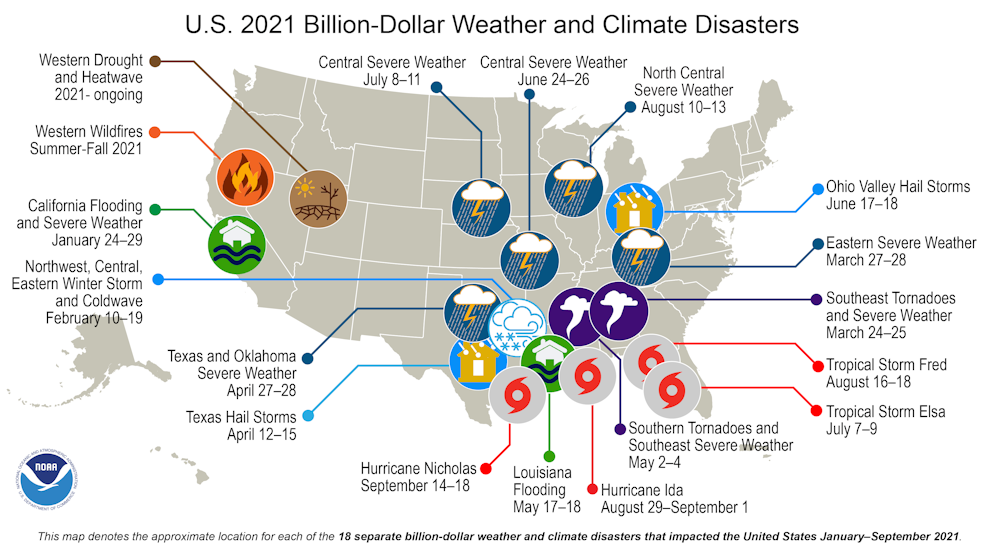
During the first nine months of 2021, there were 18 separate billion-dollar weather and climate disaster events across the U.S. that caused $104.8 billion in damages. NOAA
Like Standard & Poor’s but for climate risk
Just as Moody’s and Standard & Poor’s rate private companies’ creditworthiness to help inform investor decisions, a growing set of firms seek to assess spatially refined climate risks, ranging from flooding to extreme heat and wildfire risk. These companies include Climate Check, First Street Foundation, Jupiter Intelligence, Moody’s ESG Solutions Group and RMS.
Climate risk raters use recent natural disasters to compare the geography of recent flood events to what their model predicts. Typically, they combine peer-reviewed research in climatology and hydrology with a climate change model to generate risks maps. First Street Foundation has posted a step-by-step overview of its modeling approach.
Like any emerging industry, spatially refined climate prediction has grown unevenly. Some models are scientifically sound and highly precise, while others are lower quality. In a normal market, consumers would select the winning products through market competition – but for climate risk forecasts, it may take years to assess which offerings are most reliable.
I believe the federal government should play a role in screening the new generation of climate risk products. Regulators could work with the National Science Foundation to create a jury of experts to evaluate the new products.
One way to quality-check these offerings would be to foster a competition in which teams post forecasts about the likely locations of disasters in 2022, and then are ranked early in 2023 based on how well they predicted actual outcomes. This kind of annual review could nudge participants to upgrade their models regularly. One potential example is algorithmic trading competitions in financial markets, in which contestants develop new models to accurately predict how the stock market will respond to large trades.
Saving lives and protecting assets
Climate risk assessment firms could help make the U.S. real estate sector more resilient by helping homebuyers become more sophisticated and realistic property shoppers. Lending patterns will shift as banks offer borrowers less-generous terms for riskier properties. This incentive should nudge people to bid more for relatively safer properties and to seek to live in less risky areas.
Such shifts in turn could nudge changes in local land use and zoning laws to upzone – allow higher-value or denser uses – in relatively safer areas. Building more homes in less risky areas would make climate adaptation more affordable.
Climate change confronts people with fundamental uncertainty. I see developing the skills and infrastructure to better predict local climate risks as a useful strategy for adapting to climate risks. If forecasters can develop trusted predictive models, people will face less future regret about their real estate investments and less risk in their daily lives.
Electricity prices in the Eurozone are rising again despite the risk of another lockdown. Inflationary pressures in Germany continue to rise. German import prices have increased to 21.7% in annual terms, the largest value since 1980. Germany will report today on the inflation rate.
From a technical point of view, the EUR/USD on the hour time frame is bearish. The MACD indicator has become positive; there is a buyers’ initiative. Under such market conditions, traders should consider sell positions from the priority change level of 1.1350. Buy trades should be considered only from the support levels of the higher time frame, given the buyers’ initiative, but only with short targets.
Alternative scenario: if the price breaks out through the 1.1350 resistance level and fixes above, the mid-term uptrend will likely resume.
News feed for 2021.11.29:
– Germany Consumer Price Index (m/m) at 15:00 (GMT+2);
– S Pending Home Sales (m/m) at 17:00 (GMT+2);
– ECB President Lagarde’s Speech at 19:15 (GMT+2);
– US FOMC Member Clarida’s Speech at 20:00 (GMT+2);
– US FOMC Member Williams’s Speech at 22:00 (GMT+2);
– US Fed Chair Powell’s Speech at 22:05 (GMT+2).
The GBP/USD currency pair
Technical indicators of the currency pair:
Prev Open: 1.3320
Prev Close: 1.3326
% chg. over the last day: +0.05%
Last month, the price spike in the UK forced some industrial companies to cut production and seek government aid. For the government, it could mean tensions with neighboring countries over supply protection measures. For households, it could mean being asked to use less energy.
On the hourly time frame, the trend on GBP/USD is bearish. The MACD indicator has become inactive but is signaling divergence on several time frames. Under such market conditions, traders should consider sell positions from the support levels around the moving average. The buyers need to get the price back above the 1.3360 level, so buy trades should be considered only if the price returns to the 1.3360-1.3507 corridor, given the buyers’ initiative.
Alternative scenario: if the price breaks out through the 1.3434 resistance level and consolidates above, the bullish scenario will likely resume.
There is no news feed for today.
The USD/JPY currency pair
Technical indicators of the currency pair:
Prev Open: 115.29
Prev Close: 113.23
% chg. over the last day: -1.82%
The Japanese yen strengthened sharply on Friday as a new strain of Covid-19 detected in South Africa sparked a wave of caution in global markets. The Japanese Yen is one of the “safe-haven” currencies in case of emergency shocks. But it is important to understand that this can only be a temporary effect. Fundamentally, there is no reason for JPY to get stronger as the Bank of Japan plans to keep its stimulus program as long as possible while the US FED has been already cutting the program.
Trading recommendations
Support levels: 112.87, 112.30
Resistance levels: 113.79, 114.48, 115.15, 115.50
The global trend on the USD/JPY currency pair has changed to bearish. The price confidently broke through the priority change level and consolidated lower. Under such market conditions, it is best for traders to look for sell positions from the resistance levels around the moving average. Given the buyers ‘ initiative, buy positions should be considered from the support levels of the higher time frames.
Alternative scenario: if the price rises above 115.15, the uptrend will likely resume.
News feed for 2021.11.29:
– Japan Retail Sales at 01:50 (GMT+2);
– Japan BoJ Gov Haruhiko Kuroda’s Speech (Tentative).
The USD/CAD currency pair
Technical indicators of the currency pair:
Prev Open: 1.2647
Prev Close: 1.2786
% chg. over the last day: +1.10%
On Friday, oil prices fell sharply as news of the new strain “Omicron.” caused many countries to rush to restrict travel, which strengthened the concerns that there may be an excess supply in the first quarter of next year. The Canadian dollar is a commodity currency, so the CAD fell sharply against the dollar amid a drop in oil.
Trading recommendations
Support levels: 1.2729, 1.2646, 1.2598, 1.2571, 1.2483, 1.2416, 1.2388
Resistance levels: 1.2807
From a technical point of view, the trend of the USD/CAD currency is bullish. The MACD indicator became positive, the pressure of buyers is increasing. Under such market conditions, it is better to look for buy trades from the support levels near the moving average. Sell deals should be considered from the resistance levels of the higher time frames.
Alternative scenario: if the price breaks down through the 1.2646 support level and fixes below, the downtrend will likely resume.
News feed for 2021.11.29:
– Canada BoC Gov Macklem’s Speech at 21:00 (GMT+2).
This article reflects a personal opinion and should not be interpreted as an investment advice, and/or offer, and/or a persistent request for carrying out financial transactions, and/or a guarantee, and/or a forecast of future events.
Since early in the COVID pandemic, the Network for Genomics Surveillance in South Africa has been monitoring changes in SARS-CoV-2. This was a valuable tool to understand better how the virus spread. In late 2020, the network detected a new virus lineage, 501Y.V2, which later became known as the beta variant. Now a new SARS-CoV-2 variant has been identified – B.1.1.529. The World Health Organisation has declared it a variant of concern, and assigned it the name Omicron. To help us understand more, The Conversation Africa’s Ozayr Patel asked scientists to share what they know.
What’s the science behind the search?
Hunting for variants requires a concerted effort. South Africa and the UK were the first big countries to implement nationwide genomic surveillanceefforts for SARS-CoV-2 as early as April 2020.
Variant hunting, as exciting as that sounds, is performed through whole genome sequencing of samples that have tested positive for the virus. This process involves checking every sequence obtained for differences compared to what we know is circulating in South Africa and the world. When we see multiple differences, this immediately raises a red flag and we investigate further to confirm what we’ve noticed.
In addition, South Africa has several laboratories that can grow and study the actual virus and discover how far antibodies, formed in response to vaccination or previous infection, are able to neutralise the new virus. This data will allow us to characterise the new virus.
The beta variant spread much more efficiently between people compared to the “wild type” or “ancestral” SARS-CoV-2 and caused South Africa’s second pandemic wave. It was therefore classified as a variant of concern. During 2021, yet another variant of concern called delta spread over much of the world, including South Africa, where it caused a third pandemic wave.
Very recently, routine sequencing by Network for Genomics Surveillance member laboratories detected a new virus lineage, called B.1.1.529, in South Africa. Seventy-seven samples collected in mid-November 2021 in Gauteng province had this virus. It has also been reported in small numbers from neighbouring Botswana and Hong Kong. The Hong Kong case is reportedly a traveller from South Africa.
The World Health Organisation has given B.1.1.529 the name Omicron and classified it as a variant of concern, like beta and delta.
Why is South Africa presenting variants of concern?
We do not know for sure. It certainly seems to be more than just the result of concerted efforts to monitor the circulating virus. One theory is that people with highly compromised immune systems, and who experience prolonged active infection because they cannot clear the virus, may be the source of new viral variants.
The assumption is that some degree of “immune pressure” (which means an immune response which is not strong enough to eliminate the virus yet exerts some degree of selective pressure which “forces” the virus to evolve) creates the conditions for new variants to emerge.
Despite an advanced antiretroviral treatment programme for people living with HIV, numerous individuals in South Africa have advanced HIV disease and are not on effective treatment. Several clinical cases have been investigated that support this hypothesis, but much remains to be learnt.
Why is this variant worrying?
The short answer is, we don’t know. The long answer is, B.1.1.529 carries certain mutations that are concerning. They have not been observed in this combination before, and the spike protein alone has over 30 mutations. This is important, because the spike protein is what makes up most of the vaccines.
We can also say that B.1.1.529 has a genetic profile very different from other circulating variants of interest and concern. It does not seem to be a “daughter of delta” or “grandson of beta” but rather represents a new lineage of SARS-CoV-2.
Some of its genetic changes are known from other variants and we know they can affect transmissibility or allow immune evasion, but many are new and have not been studied as yet. While we can make some predictions, we are still studying how far the mutations will influence its behaviour.
We want to know about transmissibility, disease severity, and ability of the virus to “escape” the immune response in vaccinated or recovered people. We are studying this in two ways.
Firstly, careful epidemiological studies seek to find out whether the new lineage shows changes in transmissibility, ability to infect vaccinated or previously infected individuals, and so on.
At the same time, laboratory studies examine the properties of the virus. Its viral growth characteristics are compared with those of other virus variants and it is determined how well the virus can be neutralised by antibodies found in the blood of vaccinated or recovered individuals.
In the end, the full significance of the genetic changes observed in B.1.1.529 will become apparent when the results from all these different types of studies are considered. It is a complex, demanding and expensive undertaking, which will carry on for months, but indispensable to understand the virus better and devise the best strategies to combat it.
Do early indications point to this variant causing different symptoms or more severe disease?
There is no evidence for any clinical differences yet. What is known is that cases of B.1.1.529 infection have increased rapidly in Gauteng, where the country’s fourth pandemic wave seems to be commencing. This suggests easy transmissibility, albeit on a background of much relaxed non-pharmaceutical interventions and low number of cases. So we cannot really tell yet whether B.1.1.529 is transmitted more efficiently than the previously prevailing variant of concern, delta.
COVID-19 is more likely to manifest as severe, often life-threatening disease in the elderly and chronically ill individuals. But the population groups often most exposed first to a new virus are younger, mobile and usually healthy people. If B.1.1.529 spreads further, it will take a while before its effects, in terms of disease severity, can be assessed.
Fortunately, it seems that all diagnostic tests that have been checked so far are able to identify the new virus.
Even better, it appears that some widely used commercial assays show a specific pattern: two of the three target genome sequences are positive but the third one is not. It’s like the new variant consistently ticks two out of three boxes in the existing test. This may serve as a marker for B.1.1.529, meaning we can quickly estimate the proportion of positive cases due to B.1.1.529 infection per day and per area. This is very useful for monitoring the virus’s spread almost in real time.
Are current vaccines likely to protect against the new variant?
Again, we do not know. The known cases include individuals who had been vaccinated. However we have learnt that the immune protection provided by vaccination wanes over time and does not protect as much against infection but rather against severe disease and death. One of the epidemiological analyses that have commenced is looking at how many vaccinated people become infected with B.1.1.529.
The possibility that B.1.1.529 may evade the immune response is disconcerting. The hopeful expectation is that the high seroprevalence rates, people who’ve been infected already, found by several studies would provide a degree of “natural immunity” for at least a period of time.
Ultimately, everything known about B.1.1.529 so far highlights that universal vaccination is still our best bet against severe COVID-19 and, together with non-pharmaceutical interventions, will go a long way towards helping the healthcare system cope during the coming wave.
This article was updated following the World Health Organisation’s announcement on the new variant.
The discovery of a new mutated virus has suddenly shifted the market narrative back to Covid-19 concerns. While Thanksgiving holiday-thinned markets may have exacerbated some of Friday’s price action, traders are shooting first and will look for answers later. There are some reports that symptoms from the Omicron variant are generally mild, but the world is waiting to see what scientists say about how transmissible the new variant is and if existing vaccines remain effective.
A more virulent mutation has always been a risk, but one which the market has been prepared to look through. The global recovery, and the ensuing story around Fed policy normalization and how quickly policymakers will taper and raise rates was the current narrative. But the new lockdowns in Europe and the reimposition of travel bans across the globe, in the hope of buying some time for scientists, have hit sentiment very hard.
Whatever happens now, the market is going to be a little more wary and watchful of the Covid outlook. Markets may struggle to find a bid in the next few sessions as a sense of gloom spreads over the festive season. Friday’s market swings were encapsulated in the Vix index, known as Wall Street’s fear gauge. This widely followed indicator of market volatility spiked up to multi-month highs as investors scrambled to hedge their portfolios against further market swings.
US Non-farm payrolls to inform on December FOMC meeting
As always, traders will be watching the monthly US jobs report on Friday as questions mount about the future direction of monetary policy in the world’s largest economy. The headline non-farm payrolls figure is forecast to print around 500,000 job gains in November and unemployment fall one tenth to 4.5%. Recent data point to signs of a tightening labor market, with new applications for US unemployment benefits falling to their lowest level in over fifty years.
A big jobs print could add to expectations of a rise in borrowing costs. The US dollar has surged higher recently to levels last seen in July last year, as the market increases the chances of the Fed having to act sooner. Indeed, before the worrying Covid news last week, traders had price in the first interest rate rise in June next year.
These bets have now been pushed back with the yield on the 10-year US Treasury bond sinking below 1.50% on Friday. The Dollar Index (DXY) also printed a bearish looking candle on the week, though the greenback closed above 96. Whether the classic risk-off trading continues into this week with havens in demand and commodity currencies beaten down will very much depend on the science. This means position unwinds may have a little further to run. We also note that seasonal trends for the USD tend to turn more negative in December.
Monday, November 29
JPY: BOJ Governor Haruhiko Kuroda speech, Japan October retail sales
Disclaimer: The content in this article comprises personal opinions and should not be construed as containing personal and/or other investment advice and/or an offer of and/or solicitation for any transactions in financial instruments and/or a guarantee and/or prediction of future performance. ForexTime (FXTM), its affiliates, agents, directors, officers or employees do not guarantee the accuracy, validity, timeliness or completeness, of any information or data made available and assume no liability as to any loss arising from any investment based on the same.


 Article by Orbex




















 Article by