
By Dmitriy Gurkovskiy, Chief Analyst at RoboForex
The Brent price reached stability on Monday after experiencing severe stress last Friday; the asset is trading at $75.30. Still, there is too much volatility and emotions in the instrument.
The reason for that is the new coronavirus strain found in South Africa, which has much more mutations than any other before it. The strain is believed to be very aggressive and may complicate the current epidemiological situation. Many countries started sealing their borders from any contact with South African countries. Israel, for example, forbade the country from foreigners. Under such circumstances, a possibility of new lockdowns is not in favour of the commodity market: the demand for energies may plummet.
At the moment, market players are switching their attention to the December meeting of OPEC+. Maybe this time the cartel and its allies will take a break and put the 400K daily output increase in January on hold. Under current conditions, it would be a great relief for the commodity market.
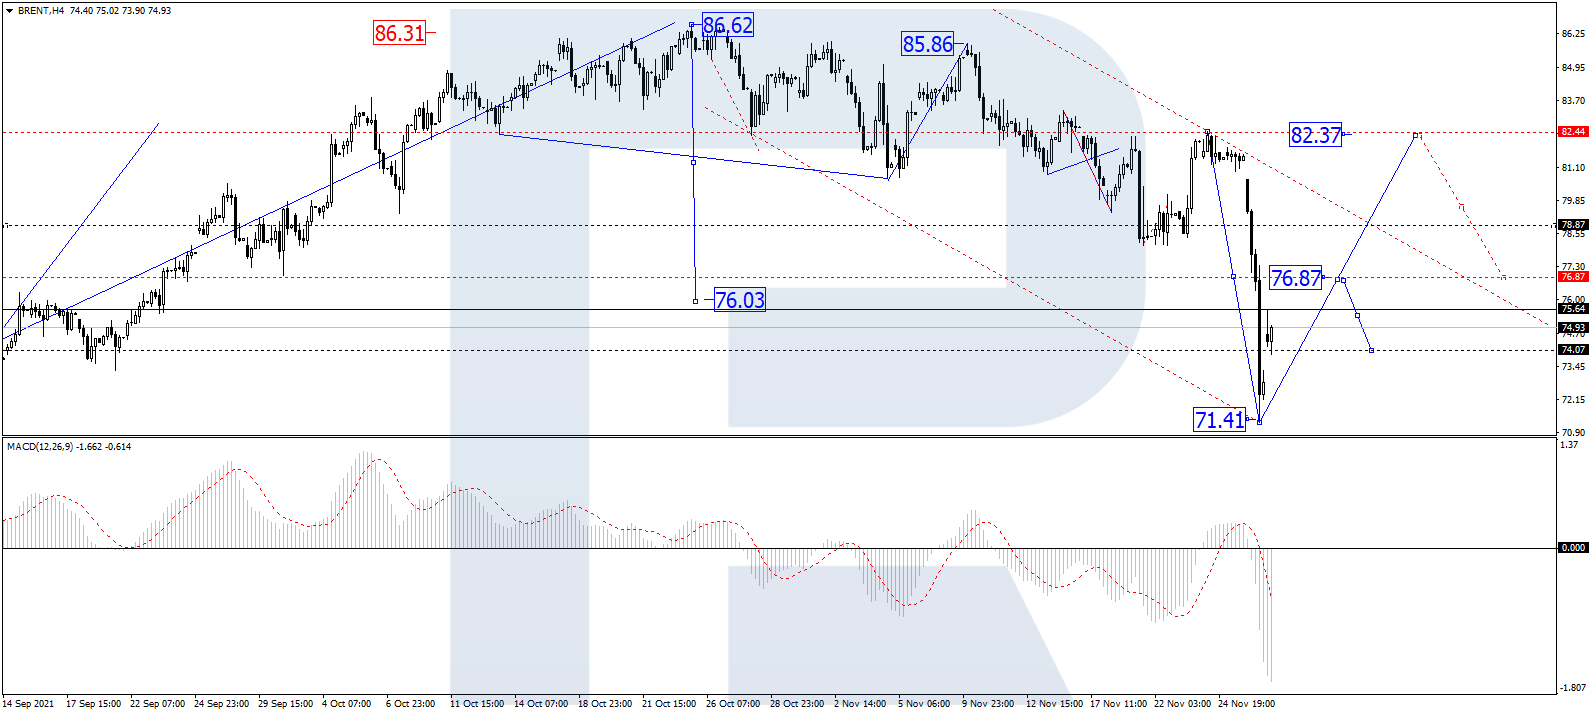
In the H4 chart, completing the descending wave at 71.40 and finishing the correction, Brent is growing with the first target at 82.40. After that, the asset may start a new correction to reach 77.00. From the technical point of view, this scenario is confirmed by MACD Oscillator: its signal line is moving near the lows within the histogram area. Later, the line is expected to leave the area and grow towards 0.
Free Reports:
 Get our Weekly Commitment of Traders Reports - See where the biggest traders (Hedge Funds and Commercial Hedgers) are positioned in the futures markets on a weekly basis.
 Download Our Metatrader 4 Indicators – Put Our Free MetaTrader 4 Custom Indicators on your charts when you join our Weekly Newsletter
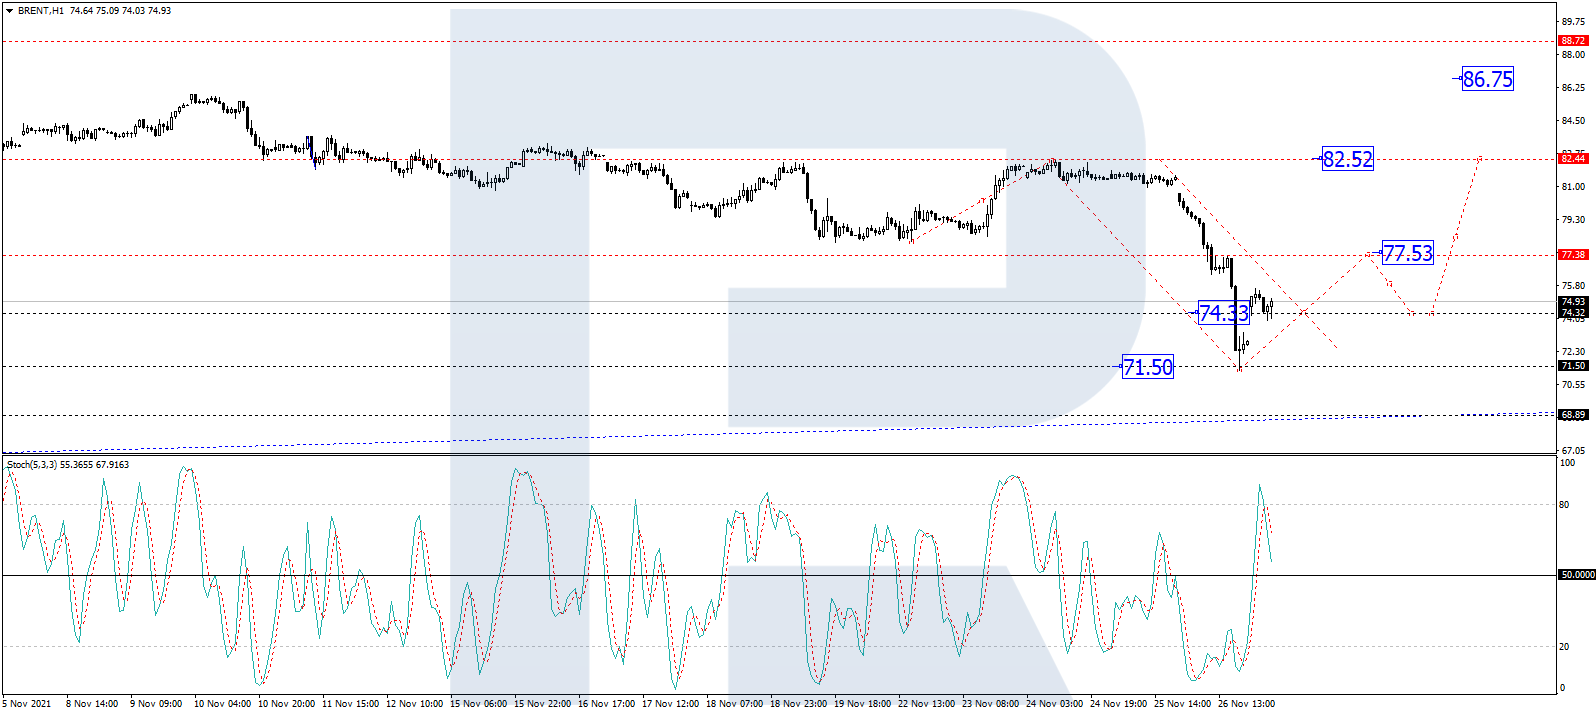
As we can see in the H1 chart, Brent s forming the first ascending structure and may soon reach 77.53. Later, the market may correct towards 74.33 and then resume trading upwards with the first target at 82.52. From the technical point of view, this idea is confirmed by the Stochastic Oscillator: after breaking 50 to the upside, its signal line is expected to test this level and then resume growing to reach 80.
Disclaimer
Any forecasts contained herein are based on the author’s particular opinion. This analysis may not be treated as trading advice. RoboForex bears no responsibility for trading results based on trading recommendations and reviews contained herein.

- Australian trade balance returned to positive territory Aug 6, 2026
- Results in Line for Most Reporting Companies Aug 5, 2026
- Stock indices continue to break records. Oil is falling amid intensified diplomatic dialogue between the US and Iran Aug 5, 2026
- USD/JPY Holds Steady After Intervention: Outlook Remains Uncertain Aug 5, 2026
- EUR/USD: Busy Week Ahead Aug 3, 2026
- Positive sentiment in the AI sector supported stock indices. Oil prices remain volatile Aug 3, 2026
- The Tech‑heavy NASDAQ Index jumped by more than 3.3%. The offshore yuan is trading at its highest level since 2023 Jul 31, 2026
- USD/JPY After Volatility: Multiple Events in One Day Jul 31, 2026
- The US indices sell off amid renewed US-Iran clashes. Oil jumps by 7% Jul 30, 2026
- USD/JPY Temporary in Equilibrium: Multiple Factors in Focus Jul 30, 2026
